Overview
Dashboards are powerful visualizations that enable you to share persuasive narratives, demonstrate how KPIs change in different scenarios, and align your business initiatives with convincing data-backed visual metrics.
In this article we focus on using dashboards — some key topics include the following:
Add and remove charts to/from dashboards
Customize dashboards via CSS
View underlying SQL code of charts
Edit a dashboard's properties, such as owners
Share charts and dashboards
How to Add a Chart to a Dashboard
There are three ways to add a chart to a dashboard:
When saving a chart
When editing a dashboard
Create new chart from an empty dashboard
Let's have a look at both methods.
When Saving a Chart
When on the Explore page, select Save.
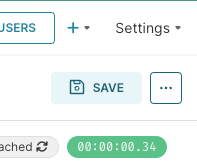
The Save chart panel appears.
If working with a new chart, then the Save as option will be enabled — if not, then you will also have the option to Save (overwrite) the chart.
The Chart Name field is auto-populated with the chart name (if defined); feel free to modify this if needed.
Create New Dashboard
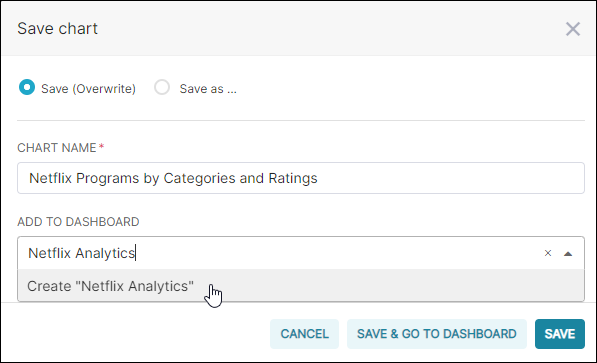
In the Add to Dashboard field, if you would like to create a new dashboard, then enter the dashboard name in the field and then select Create "dashboard name".
Select Save or, to browse directly to the defined dashboard, select Save & Go To Dashboard.
In the example below, we are creating a new dashboard called "Netflix Analytics".
Save to Existing Dashboard
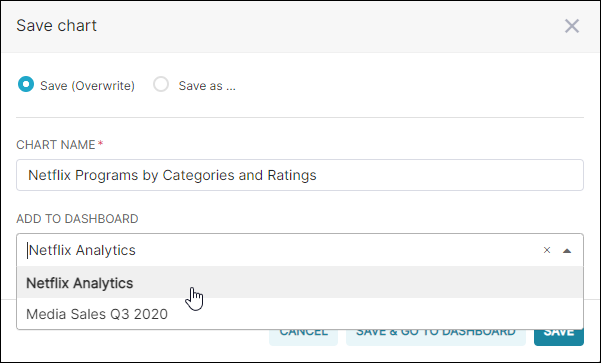
In the Add to Dashboard field, if you would like to save the chart to an existing dashboard, then select the dashboard from the drop-down list.
Select Save or, to browse directly to the defined dashboard, select Save & Go To Dashboard.
In the example below, we are selecting the existing dashboard called "Netflix Analytics".
When Editing a Dashboard
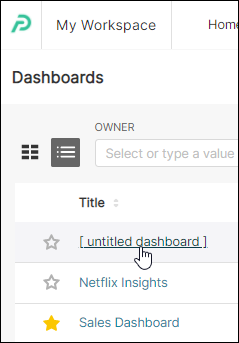
Navigate to the Dashboards screen and select a dashboard.
Select the Edit dashboard button.
Select the Charts tab.
The Charts tab contains a list of all charts that you have access to (i.e., charts that you have created or a team member has shared ownership access).
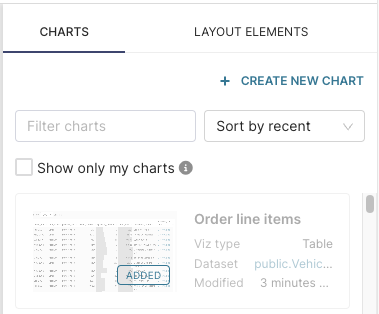
To add a chart, just drag & drop the chart card into a space on the dashboard.
To only see charts that you own, click the check box "Show only my charts".
Create a New Chart from an Empty Dashboard
When creating a new dashboard
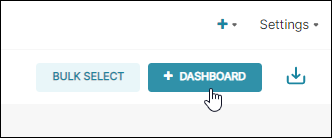
Navigate to the Dashboards screen and select + Dashboard.
In the Content panel, select + Create a new chart.
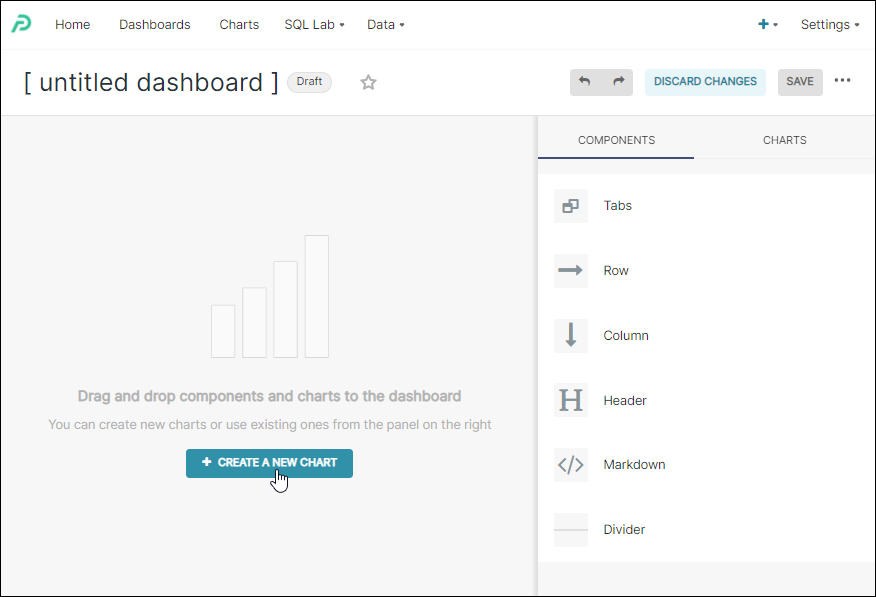
At this stage, you can proceed with the process of creating a new chart.
When loading an empty dashboard
Navigate to the Dashboards screen and select an empty dashboard.
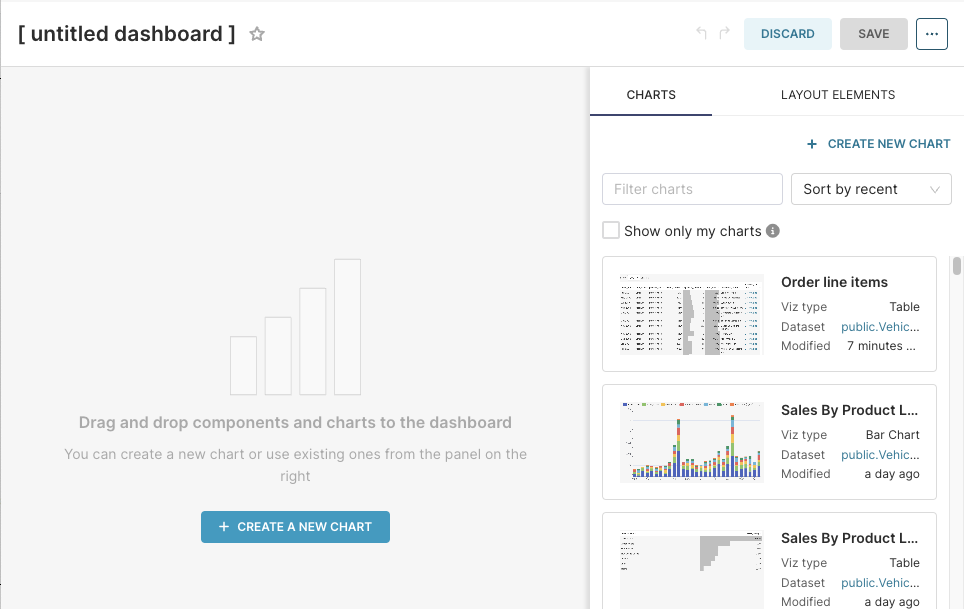
In the Content panel, select + Create a new chart.
At this stage, you can proceed with the process of creating a new chart.
How to Remove a Chart
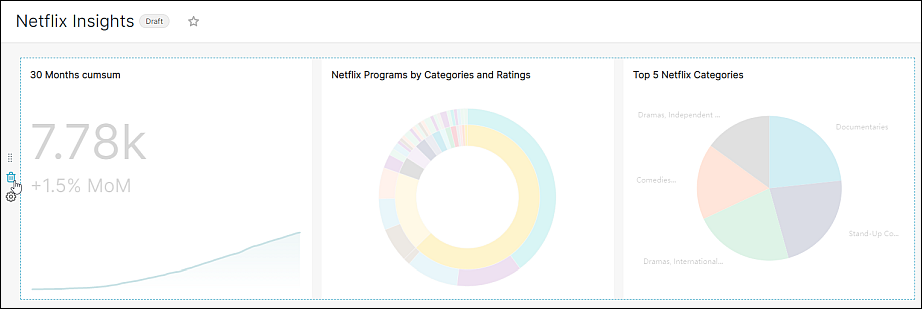
To remove a chart, from the Dashboards screen, select the pencil Edit dashboard icon.
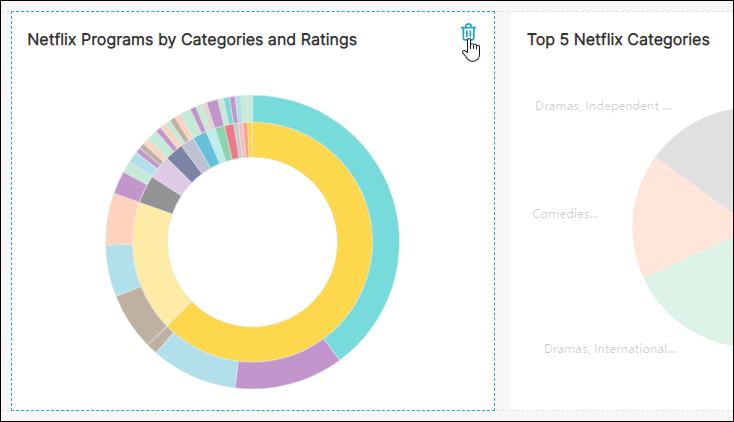
While your cursor is hovering over a chart, select the trash icon in the upper-right corner of the chart:
To delete an entire row of charts, select the trash icon on the far left side of the row:
Don't worry
Selecting the trash bin icon merely removes the chart(s) from your dashboard, it does not delete them from Preset.
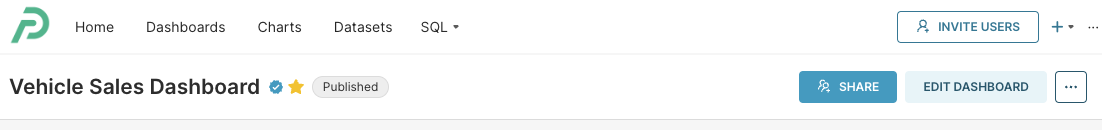
Dashboard Options
The ellipsis as the top right side courner of the screen shoes different options whether you’re in live mode or edit mode of the dashboard.
Dashboard Option in Live Mode
Select the ellipsis icon (3 dots) while in editing mode to view the following options:

Refresh dashboard: Select to refresh all dashboard charts (i.e. rerun chart queires and retrieve fresh data).
Enter fullscreen: hides the Preset menu options.
Save as: duplicate a dashboard, this dashboard will contain all of the same charts as the existing dashboard. This is useful to allow you to create a dashboard from an existing dashboard.
Download: download the dashboard as either a PDF or as an image (jpg). The files will contain only the first page of any tabs.
Share:
Copy permalink to clipboard: Copies a shareable dashboard link to your system's clipboard (see Sharing and Collaboration).
Share permalink by email: Launches your system's default e-mail client and composes a new message featuring your dashboard URL (see Sharing and Collaboration).
Embed dashboard: allows you to enable embedding for a dashboard, for more details on embedding see: Dashboard Embedding. This option will only appear if you have embedding enabled for your Preset team.
Set auto-refresh interval: Select to specify an automatic refresh rate for the dashboard. Options include seconds (10 or 30), minutes (1, 5, or 30), or hours (1, 6, 12, or 24). Note that this will be only applied to the current session.
Setting a permanent auto-refresh
If you would like to set a permanent auto-refresh instead, you would need to modify the JSON metadata in the Dashboard Properties. For that, set a value (in seconds) to the "refresh_frequency" parameter (default value is 0). For example, to set a 1 hour refresh-rate, set the parameter value as 3600.
Dashboard Options in Edit Mode
Additional options available on the Dashboards screen include:

Edit Properties: Takes you to the dashboard properties editor see Editing dashboard properties
Edit CSS: Loads the Live CSS Editor, which can be used to make ad hoc stylesheet changes in live editing environment (i.e., changes applied in real time). See Customizing Dashboard CSS for more details.
Save as: duplicate a dashboard, this dashboard will contain all of the same charts as the existing dashboard. This is useful to allow you to create a dashboard from an existing dashboard.
Download: download the dashboard as either a PDF or as an image (jpg). The files will contain only the first page of any tabs.
Share:
Copy permalink to clipboard: Copies a shareable dashboard link to your system's clipboard (see Sharing and Collaboration).
Share permalink by email: Launches your system's default e-mail client and composes a new message featuring your dashboard URL (see Sharing and Collaboration).
Set auto-refresh interval: Select to specify an automatic refresh rate for the dashboard. Options include seconds (10 or 30), minutes (1, 5, or 30), or hours (1, 6, 12, or 24). Note that this will be only applied to the current session
Setting a permanent auto-refresh
If you would like to set a permanent auto-refresh instead, you would need to modify the JSON metadata in the Dashboard Properties. For that, set a value (in seconds) to the "refresh_frequency" parameter (default value is 0). For example, to set a 1 hour refresh-rate, set the parameter value as 3600.
Edit Dashboard Properties
In Editing mode, select the ellipsis icon (3 dots) and choose Edit dashboard properties.

Name: The title of the dashboard.
URL Slug: Customize the end of the URL (slug) to a more memorable name.
Owners: Assign/remove edit access to the dashboard.
Colors Scheme: By specifying a color scheme in the dashboard properties, you can overwrite the individual chart color schemes, unifying the dashboard look and feel.
Certification
Certified By: Type in a name or group, a blue check mark will now appear next to the dashboard in the dashboard list.
Certification Details: adds a description that displays on hover over the blue checkmark certification icon.
Tags: to learn more about tags see Organizing Content: Tags
Advanced:
JSON Metadata: By expanding the Advanced header, the JSON Metadata panel appears. This area is for power users who may wish to alter specific dashboard parameters.
Chart Options
When in View mode (i.e., not editing), select the vertical ellipsis icon in a chart to display a list of chart-specific options:

Force refresh: Select to refresh the chart's data. The time duration since the last cache is also provided.
Enter fullscreen: View the chart in full screen mode (i.e., just the chart occupies the entire screen). Select minimize icon to return.
Edit chart: Launches the chart in the Explore page.
Cross-filtering scoping: opens the interface to configure which charts can be cross filtered. For more details on cross filtering see Cross-filtering
View query: Launches the View Query panel, which displays the SQL query used for the chart. Select the Copy icon to copy this SQL code to your clipboard.
View as Table: Shows the aggregated data being displayed by the chart in a table format.
Drill to Detail: see Drilling to Chart Details
Share:
Copy permalink to clipboard: Copies a shareable chart link to your system's clipboard (see Sharing and Collaboration).
Share permalink by email: Launches your system's default e-mail client and composes a new message featuring your chart URL (see Sharing and Collaboration).
Download: