Introduction
Superset includes the ability to customize your dashboard with a highly flexible CSS editor. You may want to change the background color or font of a dashboard, or you may want to do things like hiding particular elements, adjust margins/padding, add a splash of color, or make numerous other visual tweaks. This page acts as an overview of basic concepts, but there is an additional layer of information in the corresponding blog post.
Where to begin
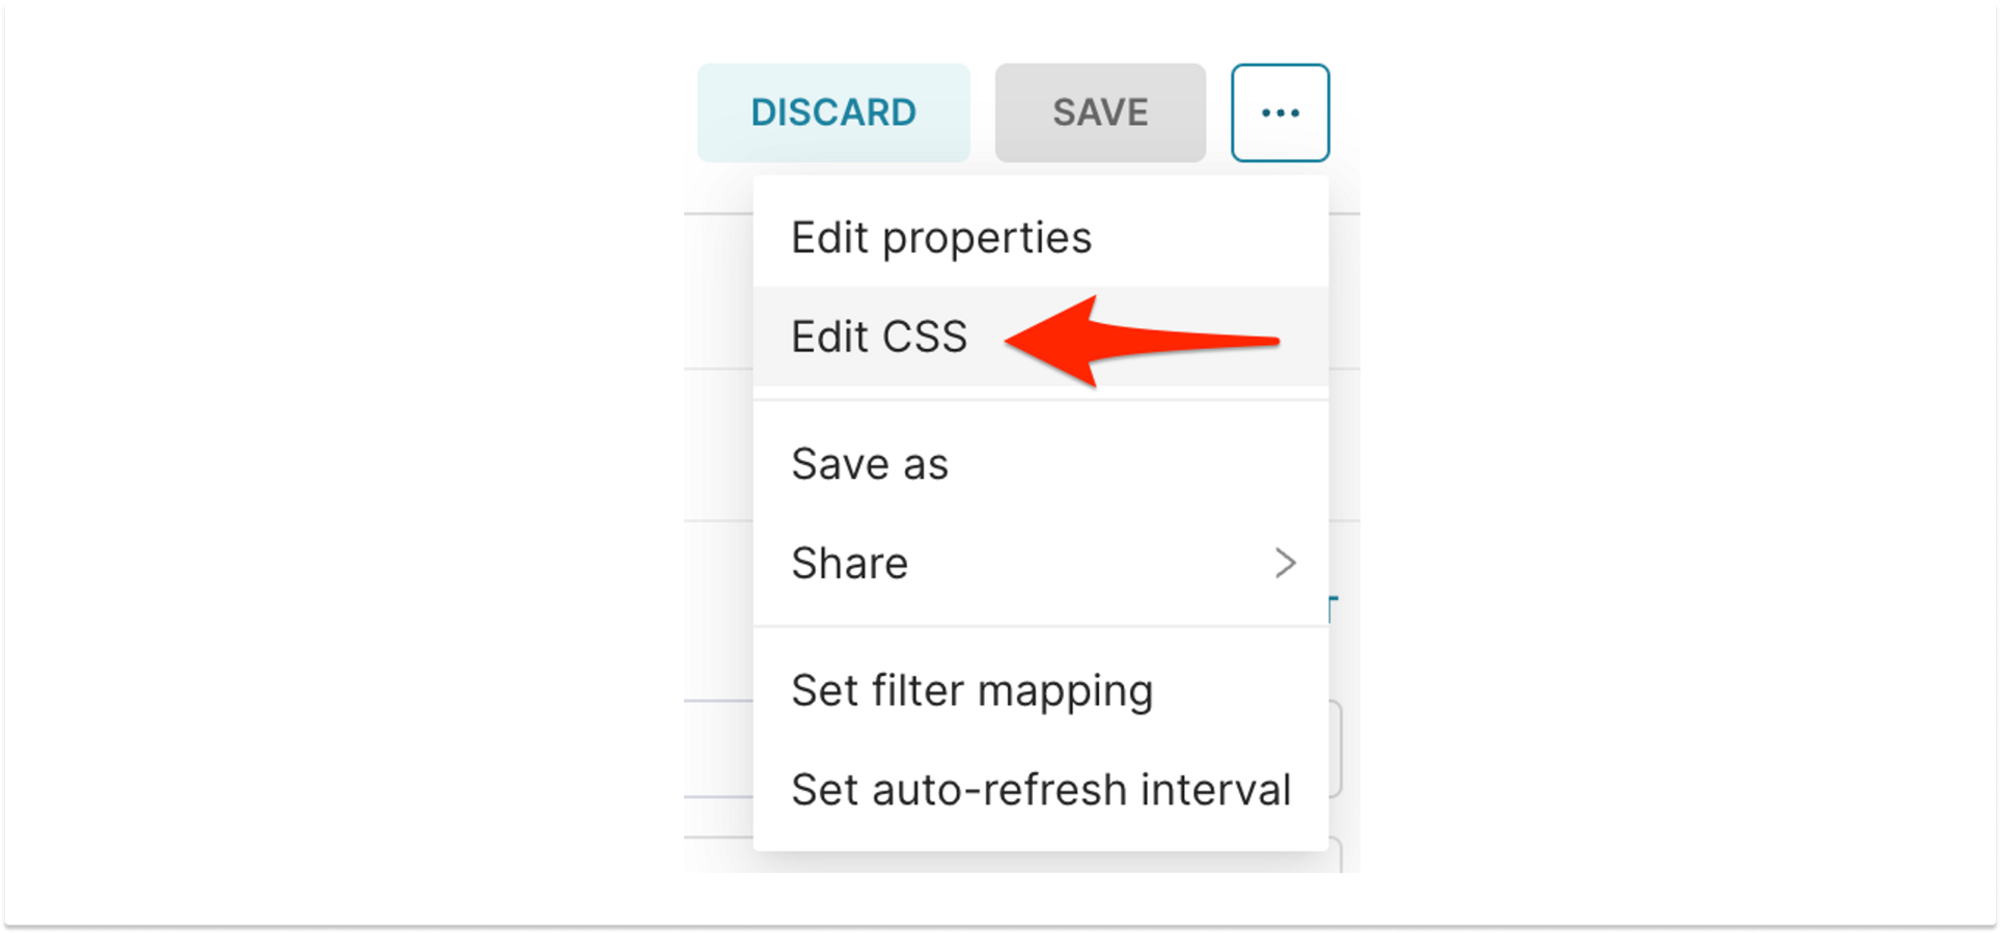
To customize a Dashboard's CSS theme, click "Edit Dashboard" and then select the "Edit CSS" menu item
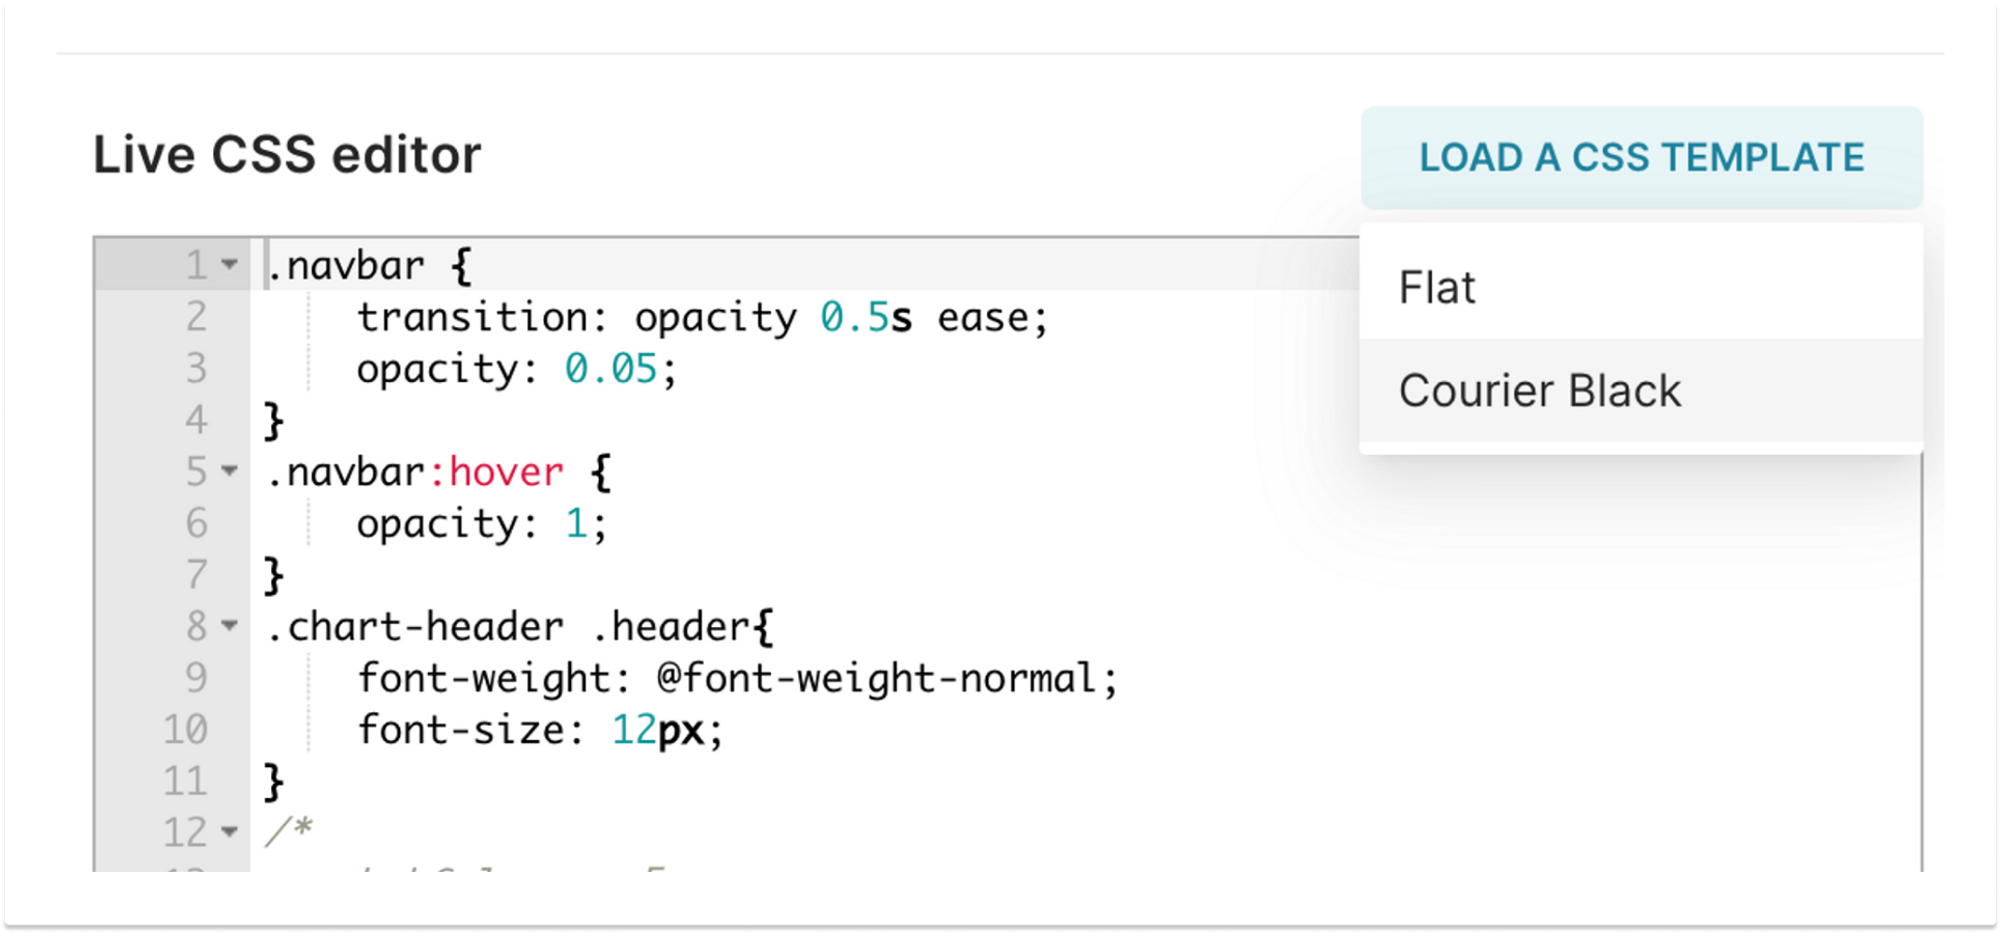
You'll then be presented with a full-fledged CSS editor, which also contains a menu in the top right to select from a couple example templates to give you an idea of how to start tweaking things.
Common techniques in customizing a dashboard layout
Selecting/styling individual charts
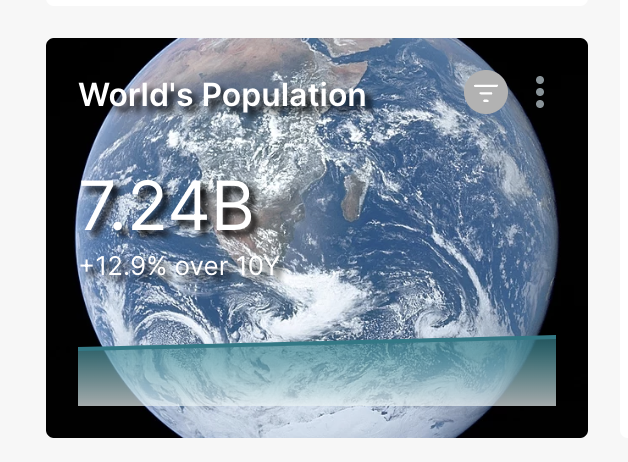
If you want to add custom styles to a particular chart in a dashboard, regardless of dashboard layout (i.e. adding a background image to a Big Number chart), you can add a CSS Selector that references the chart's specific chartID in two ways.
The first chart selector approach is that in each chart’s outer wrapper is a div with a class name in the format dashboard-chart-id-{X} where {x} is the unique identifier for the chart as seen here.
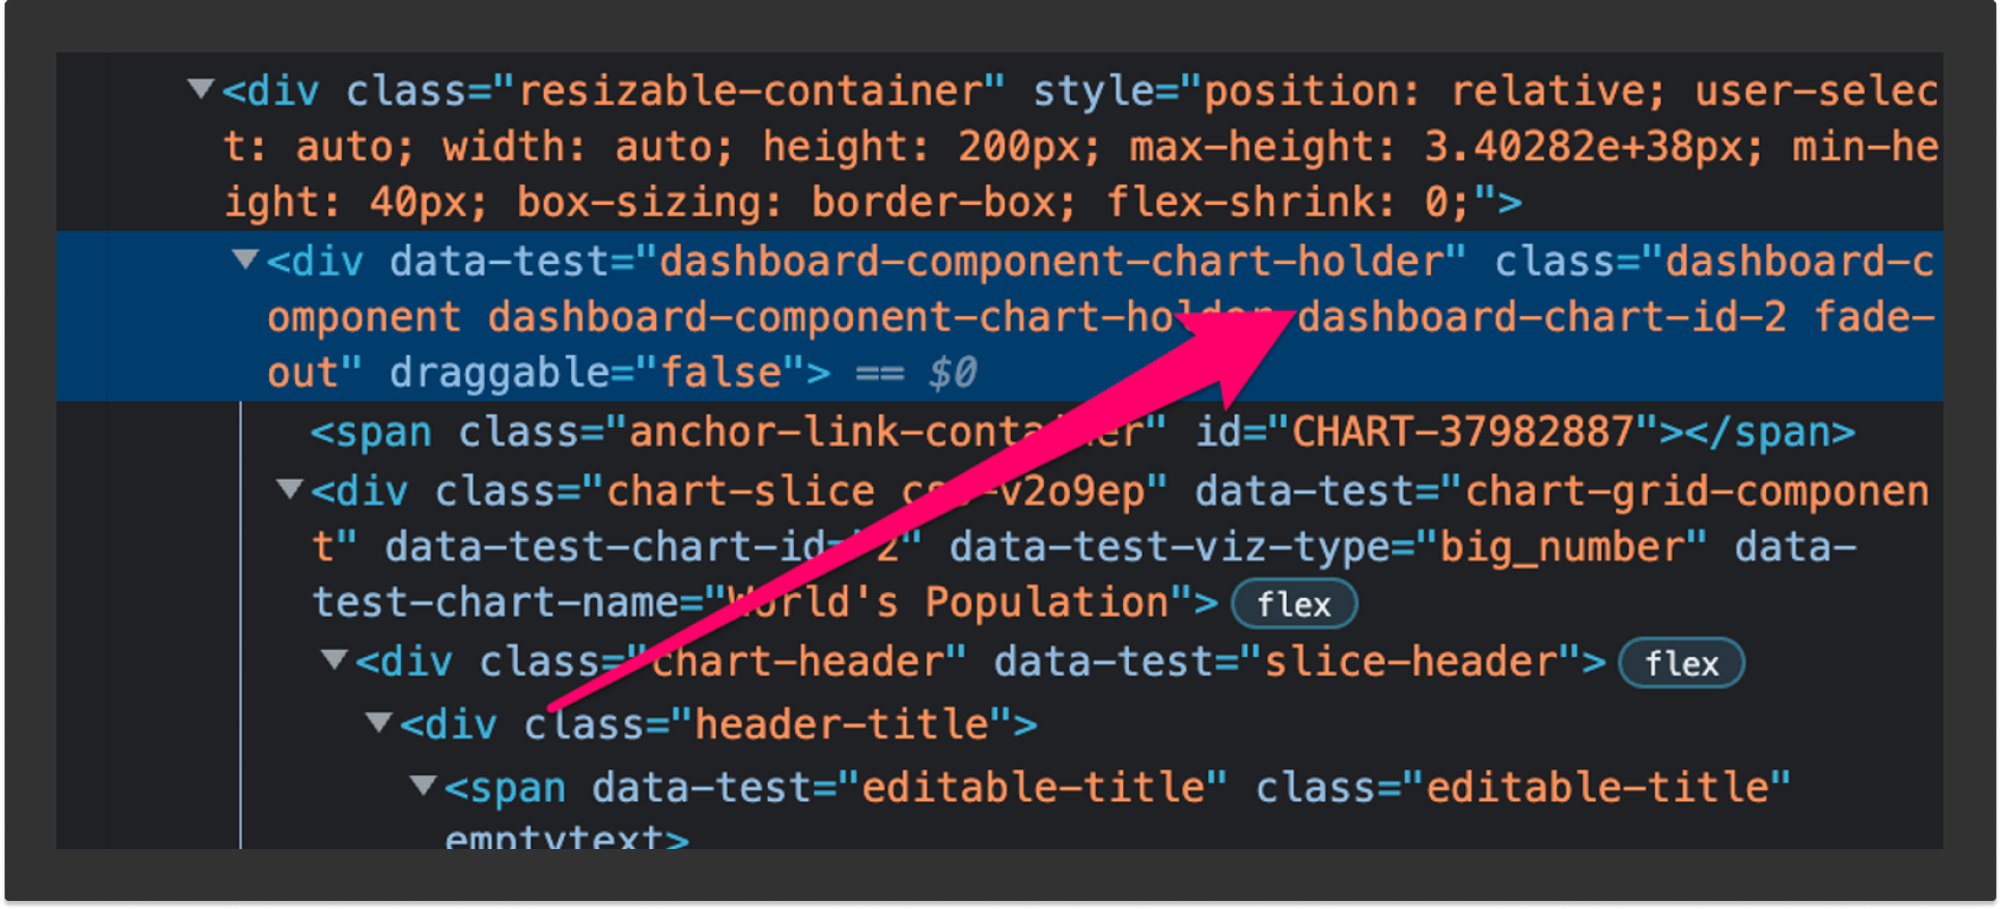
This allows you to more reliably target a particular chart and adjust the styling as you see fit, like so:
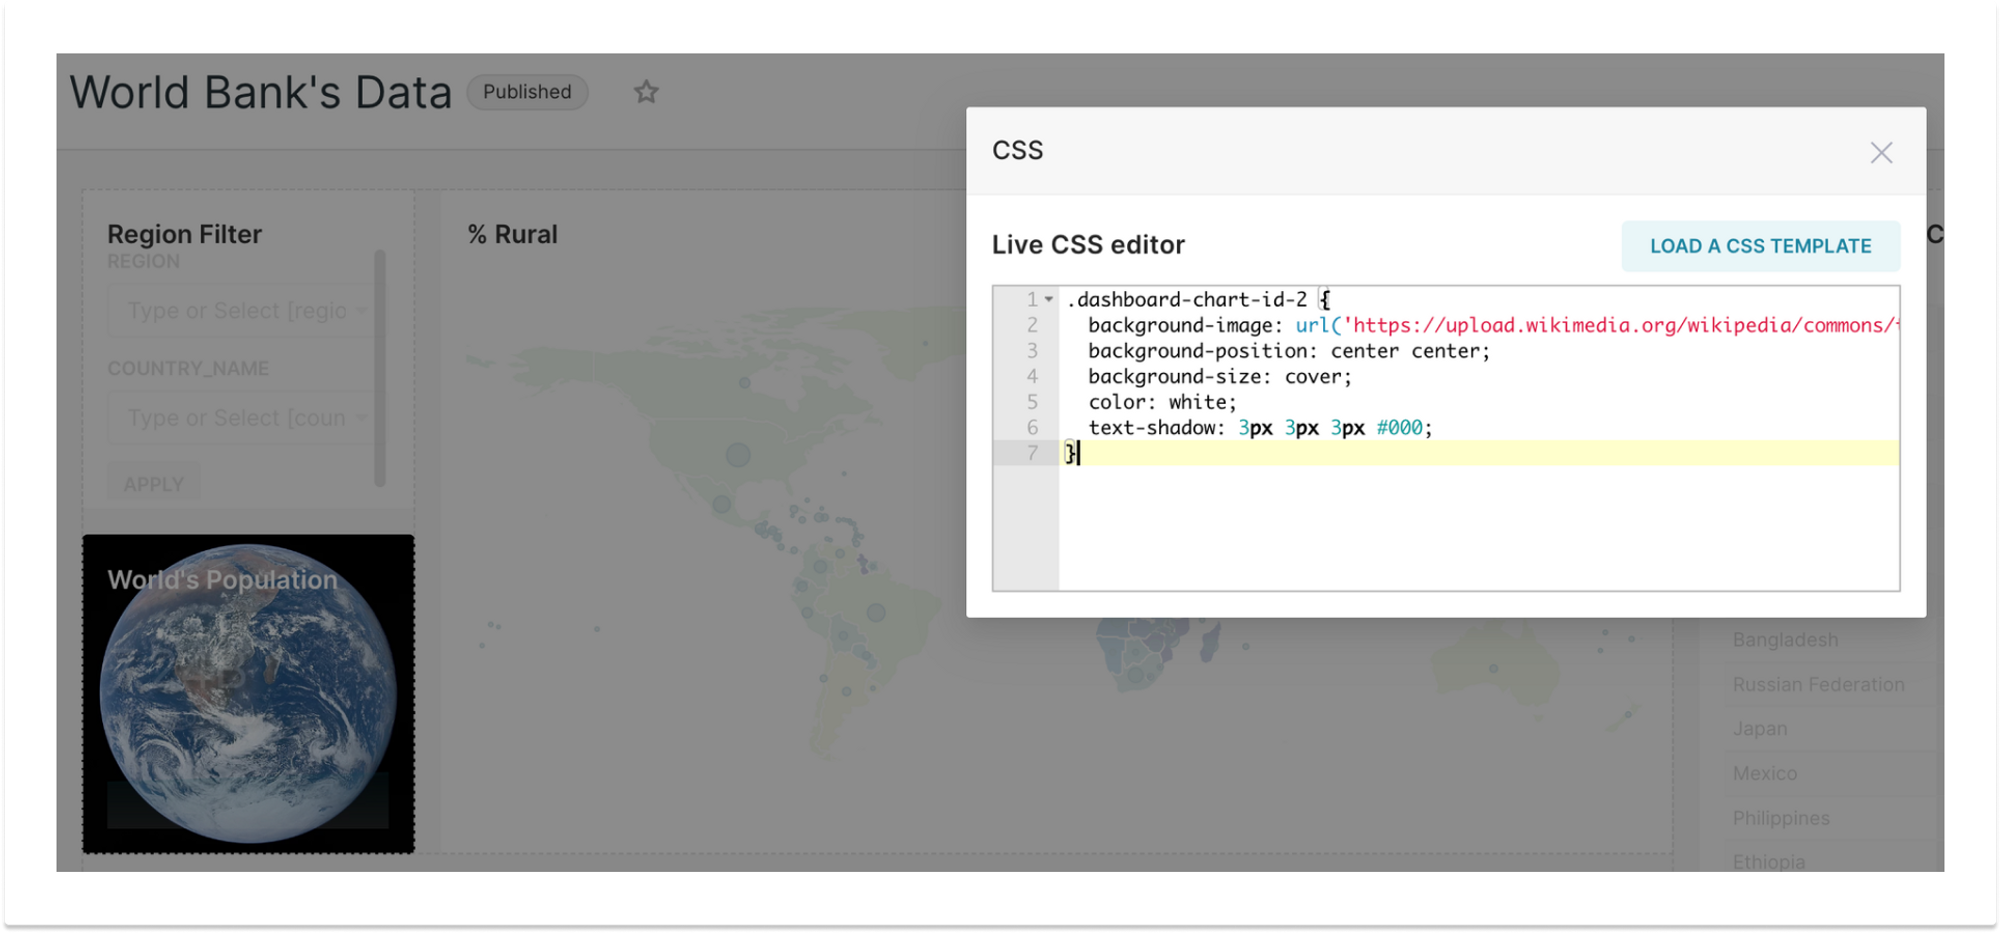
This opens the door to style most aspects of most chart types freely, but we'll go into some caveats and limitations below.
Selecting the nth chart in a certain area.
In certain cases, you may want to add styling to the nth chart in a row, or all charts in the nth row, regardless of what that chart may be. For example, you may have a Big Number chart or markdown component in the top-left of your dashboard, and don't care to reference it by ID as in the above example. In cases like this, you may want to use the CSS nth-of-type() selector. You can read up on that selector here for a full explanation of its options.
You'll most likely want to use the selector on dashboard rows, which can be accessed with the dragdroppable-row class, and the columns within those via the dragdroppable-column class. You may want to, for example, select the third chart in the first row of your dashboard, by utilizing a selector like this:
.dragdroppable-row:nth-of-type(1) .dragdroppable-column:nth-of-type(3){
    /* do your thing here */
}
SVG customization
Many of the charts in Superset (particularly legacy charts) use SVG elements to render their data visualizations. For some of these customizations (e.g. if you make the background of a chart black, and suddenly you need to turn the axes/labels white so you can see them again) you may need to style the SVG paths of a chart. This is a world unto its own, and you can get some initial tips about how this works here.
Using data-test attributes
Many times, you’ll find that an element in the DOM doesn’t have a handy class or id added to it. However, you might notice that there are data-test attributes scattered around with handy-looking names attached to them. These are used by our Cypress end to end test suite, and lucky you, they can be leveraged by CSS as well. For example, if you want to target the filters sidebar, you can use a selector like div[data-test=dashboard-filters-panel].
Important caveats/limitations to CSS
CSS is global in scope
Whatever CSS you write here affects the entire page that your dashboard lives in... this includes global navigation, and anything else in the entirety of the DOM. If you wish to limit the scope of your styling to the dashboard itself, you may want to limit your styles to a selector such as .dashboard-content > .grid-container which is the dashboard layout itself.
DOM selectors are not considered "stable"
The code of Superset changes often due to a number of feature additions, bugfixes, refactors, etc. While many parts of the page layout / DOM remain stable, any part of it may change at any time. There are no contractual guarantees that the selectors you use in your CSS will remain functional in the long run.
Templates are hard-coded
At this time, you cannot save templates for re-use on the fly. These are included as part of the Superset codebase as example starting points only.
Not everything is stylable
Many chart types, such as newer ECharts visualizations, and a handful of Legacy charts as well, do not render their artwork with SVG or HTML elements that can be styled, instead leveraging Canvas or WebGL layers.