Overview
When setting up Preset for your organization, it is important to consider how you can best enable your users to organize, find, or share assets such as dashboards, charts, and saved queries. Within Preset, you have the power to organize these assets using tags.
Who Can Use Tags?
Tags are available for all Preset teams. Depending on your workspace role, you have different levels of permissions.
| Workspace Role | Create Tags | Assign Tags | Find Tagged Contents |
|---|---|---|---|
| Workspace Admins | ✅ | ✅ | ✅ |
| Content Owners with a Creator role | ❌ | ✅ | ✅ |
| Non-Content Owners (Creators & Viewers) | ❌ | ❌ | ✅ |
Creating Tags
Only Workspace Admins can create tags for their workspaces.
-
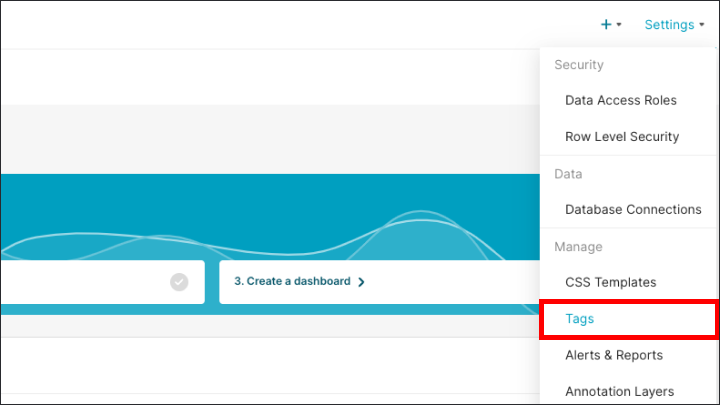
To create new tags or edit existing tags, go to Settings in the navigation bar, and click Tags.
-
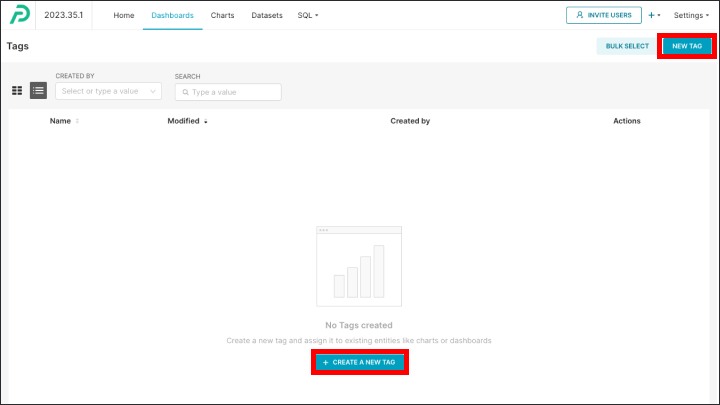
Click the New tag button in the top right-hand corner, or the +Create a new tag button in the center .
-
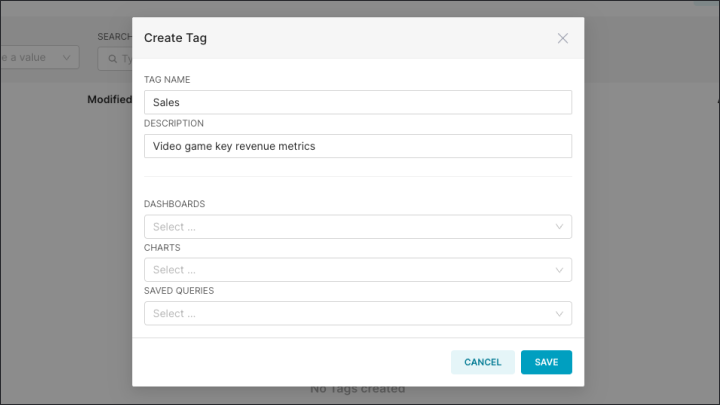
Fill out the "tag name" and "description".
-
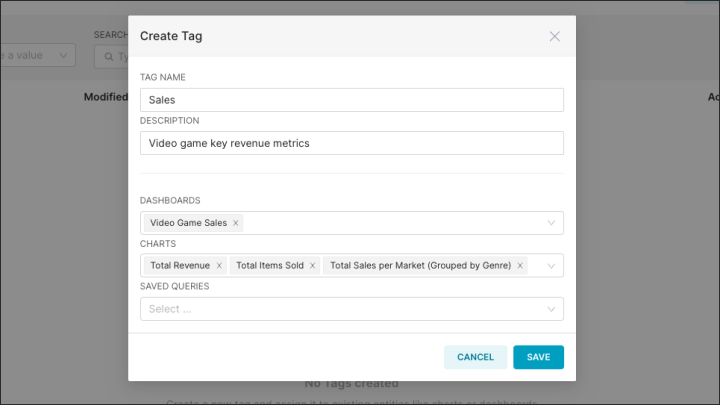
Optionally, assign the tag to dashboards, charts, and/or saved queries. Each tag can be used on multiple items across these categories. Click to Save.
-
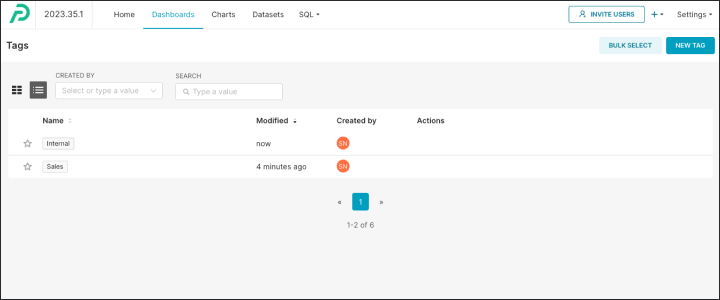
Once tags are created, they will appear on the "Tags" page (listview).
-
To edit existing tags, click the Edit (pencil icon) button in the "Actions" column on the "Tags" page.
The "Tags" page is not visibile in the primary navigation bar. Only Workspace Admins can access the "Tags" page by clicking on "Settings" in the navigation bar and selecting "Tags", regardless of which page you start from (e.g., Homepage, Dashboard page, Dataset page and so on).
All tags created in the workspace will appear on the single "Tags" page.
Assigning Tags
Asset owners (creators) and Workspace Admins can assign tags to dashboards, charts, and saved queries.
Dashboards
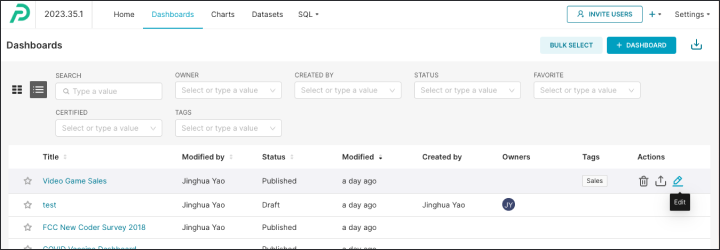
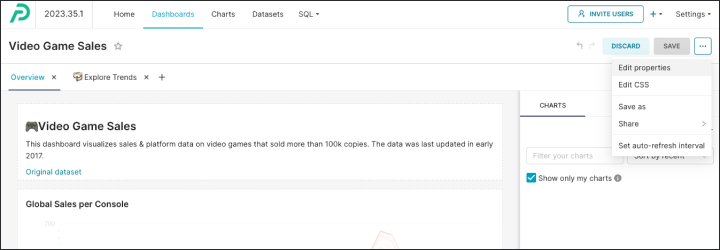
- To assign tags to dashboards, go to the "Dashboard Properties" modal. You can do this by clicking the Edit (pencil icon) button next to a dashboard name on the "Dashboard" page. Alternatively, if you're creating a new dashboard, click the "Edit properties" button in the "Dashboard Editor".
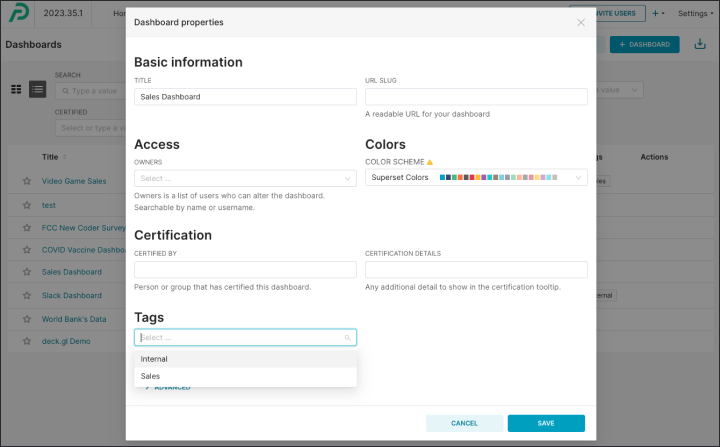
- In the modal, select the appropriate tags for the dashboard from the "Tags" dropdown menu, then click Save.
Charts
- To assign tags to charts, go to the "Chart Properties" modal. You can do so by clicking the Edit (pencil icon) button next to a chart name on the "Chart" page. Alternatively, if you're creating a new chart, click the "Edit chart properties" button in the "Chart Builder".
- In the modal, select the appropriate tags for the chart from the "Tags" dropdown menu, then click Save.
Saved Queries
- To assign tags to saved queries, go to the "Saved Queries Properties" modal. You can do so by clicking the Edit (pencil icon) button next to a query name on the "Saved queries" page under "SQL Lab".
- In the modal, select the appropriate tags for the query from the "Tags" dropdown menu, then click Save.
Bulk Assigning Assets
You can also assign a tag to multiple contents at the same time. To do so:
- From any of the "Dashboard", "Charts", or "Saved Queries" pages, click Bulk Select in the top right-hand corner.
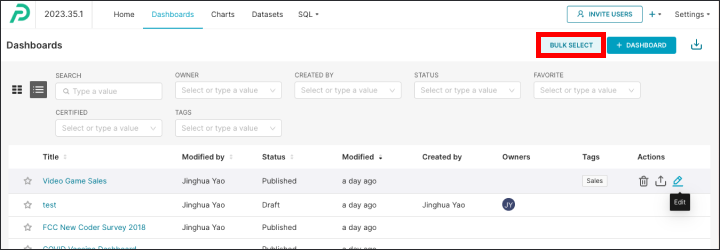
- Check off all assets you want to assign a tag to.
- Click the +Add tag button.
Find Tagged Content
You can search for dashboards, charts, and/or saved queries that you have access to using tags. To find contents using tags:
- Go to the "Dashboard", "Charts", or "Saved Queries" page.
- Under the "Tags" column, search for a tag you're looking for.
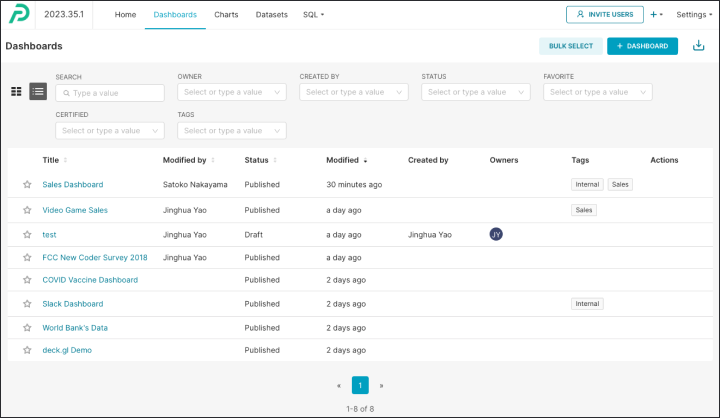
- Click the desired tag. This will open a page where contents of all types tagged with the same tag will appear.
Currently only Contributors and above can browse the tags directly by clicking on the Tags. Viewer users will be redirected to the Manage page when clicking on the Tags.
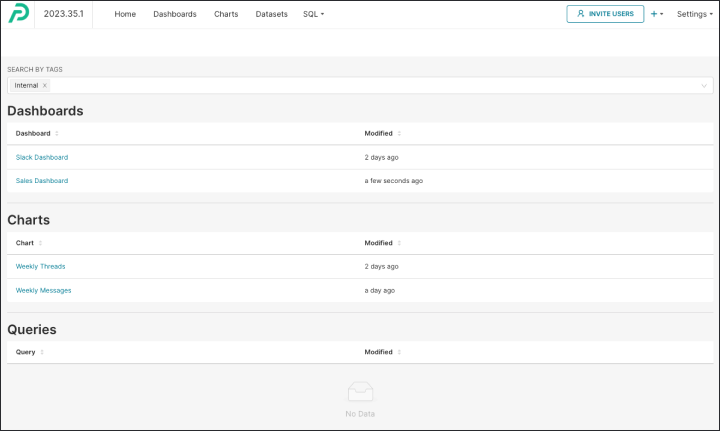
You can view the contents permitted according to your workspace and data access roles. If you lack the necessary permissions for tagged assets, they won't appear on the "Search by tags" page.
Instantly Access Tagged Content from Homepage
If you have a collection of charts, dashboards, and saved queries you frequently access, we recommend using tags to enable quick access from your Preset Homepage.
1) Browse by tag
- Log in to your Preset account and go to "Homepage". Scroll down to the “Browse by Tag” section located between the "Recently Viewed / Popular / Favorites / Examples" section and the "Search" section.
Currently only Contributors and above can see this section. It will be hidden for all Viewer users.
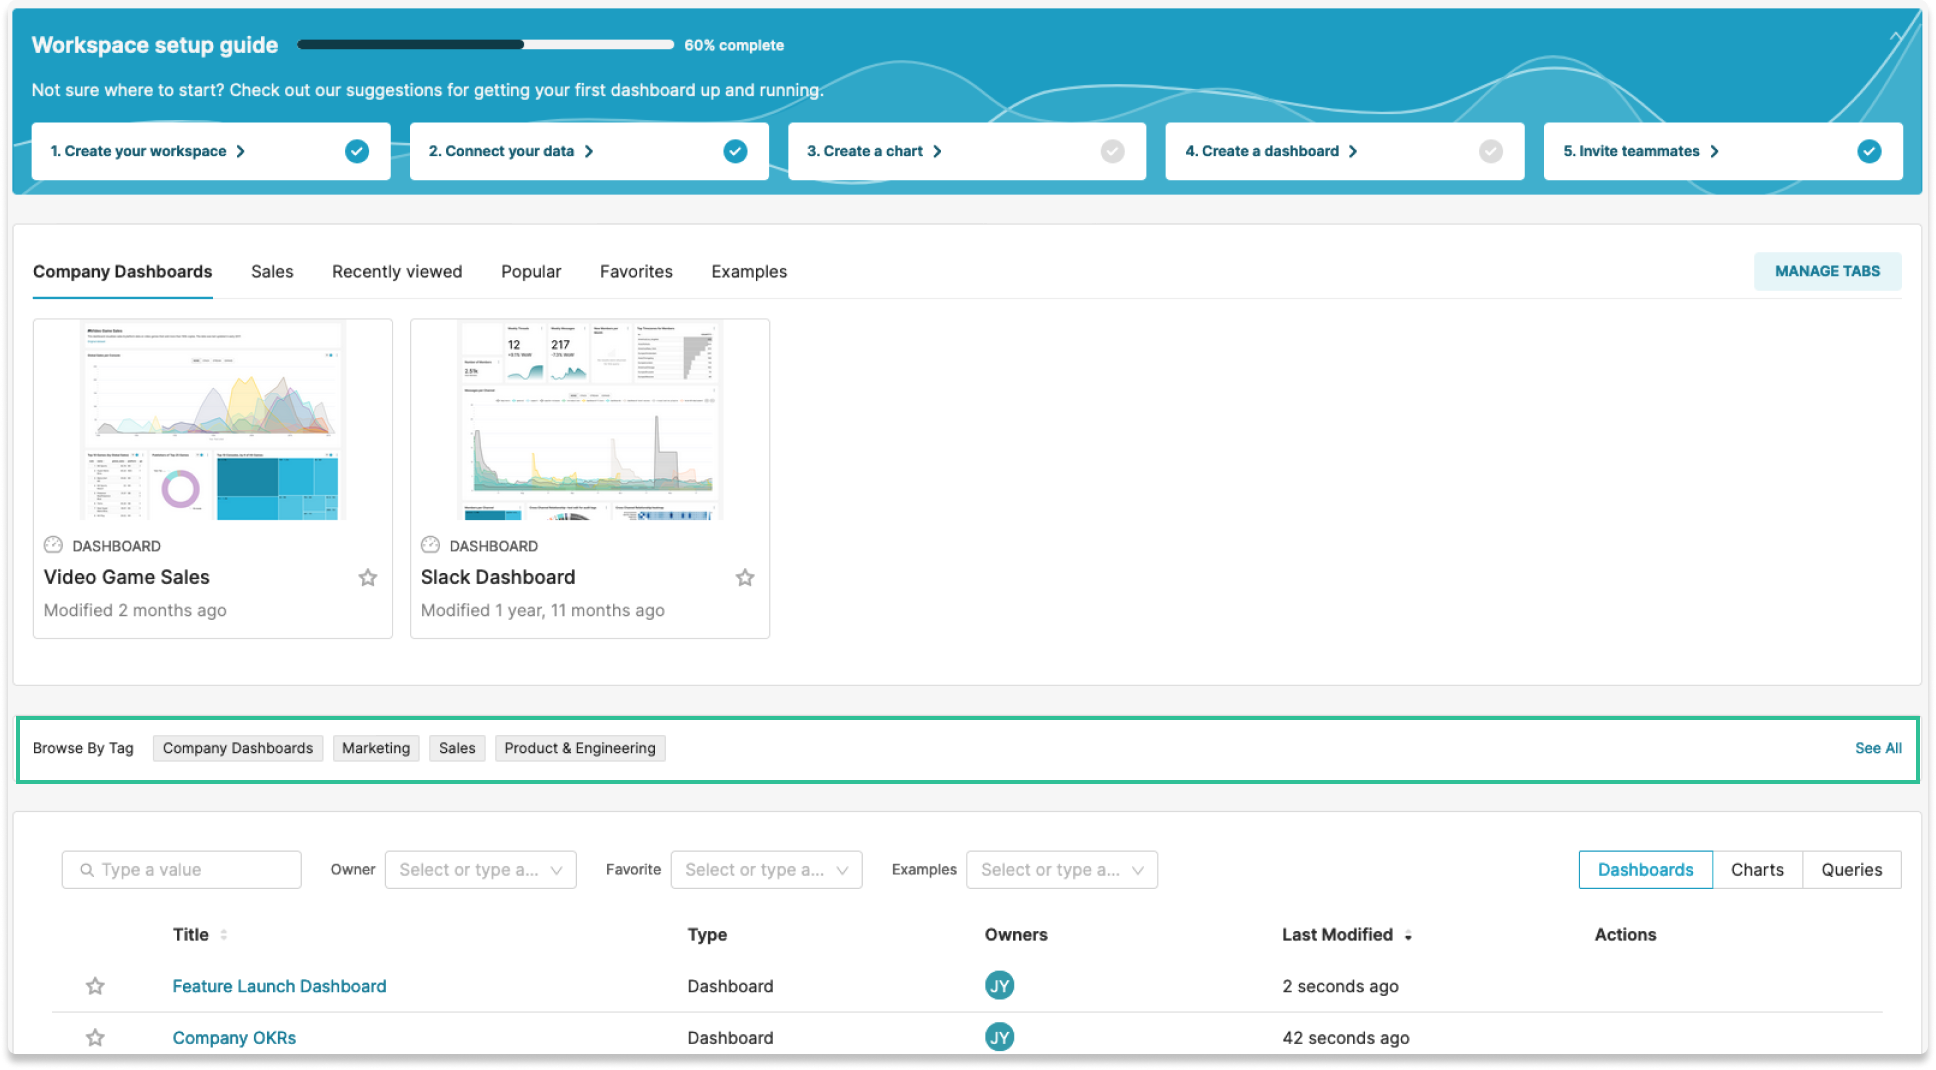
- Click on a tag. This will take you to the "Tags" page which has been filtered for the dashboards, charts, and queries that are tagged with the selected tag.
Tags in the "Browse by Tag" section include tags created by your organization, and not just the tags that you have pinned to the top section of the Homepage.
2) Pin tagged items to Homepage
You can also create a new tab in the "Recently Viewed / Popular / Favorites / Examples" section of the Homepage after a specific tag, and display the tagged content in a carousel.
- Click on the Manage Tabs button.

- Choose a tag you want to pin as a tab in your homepage.
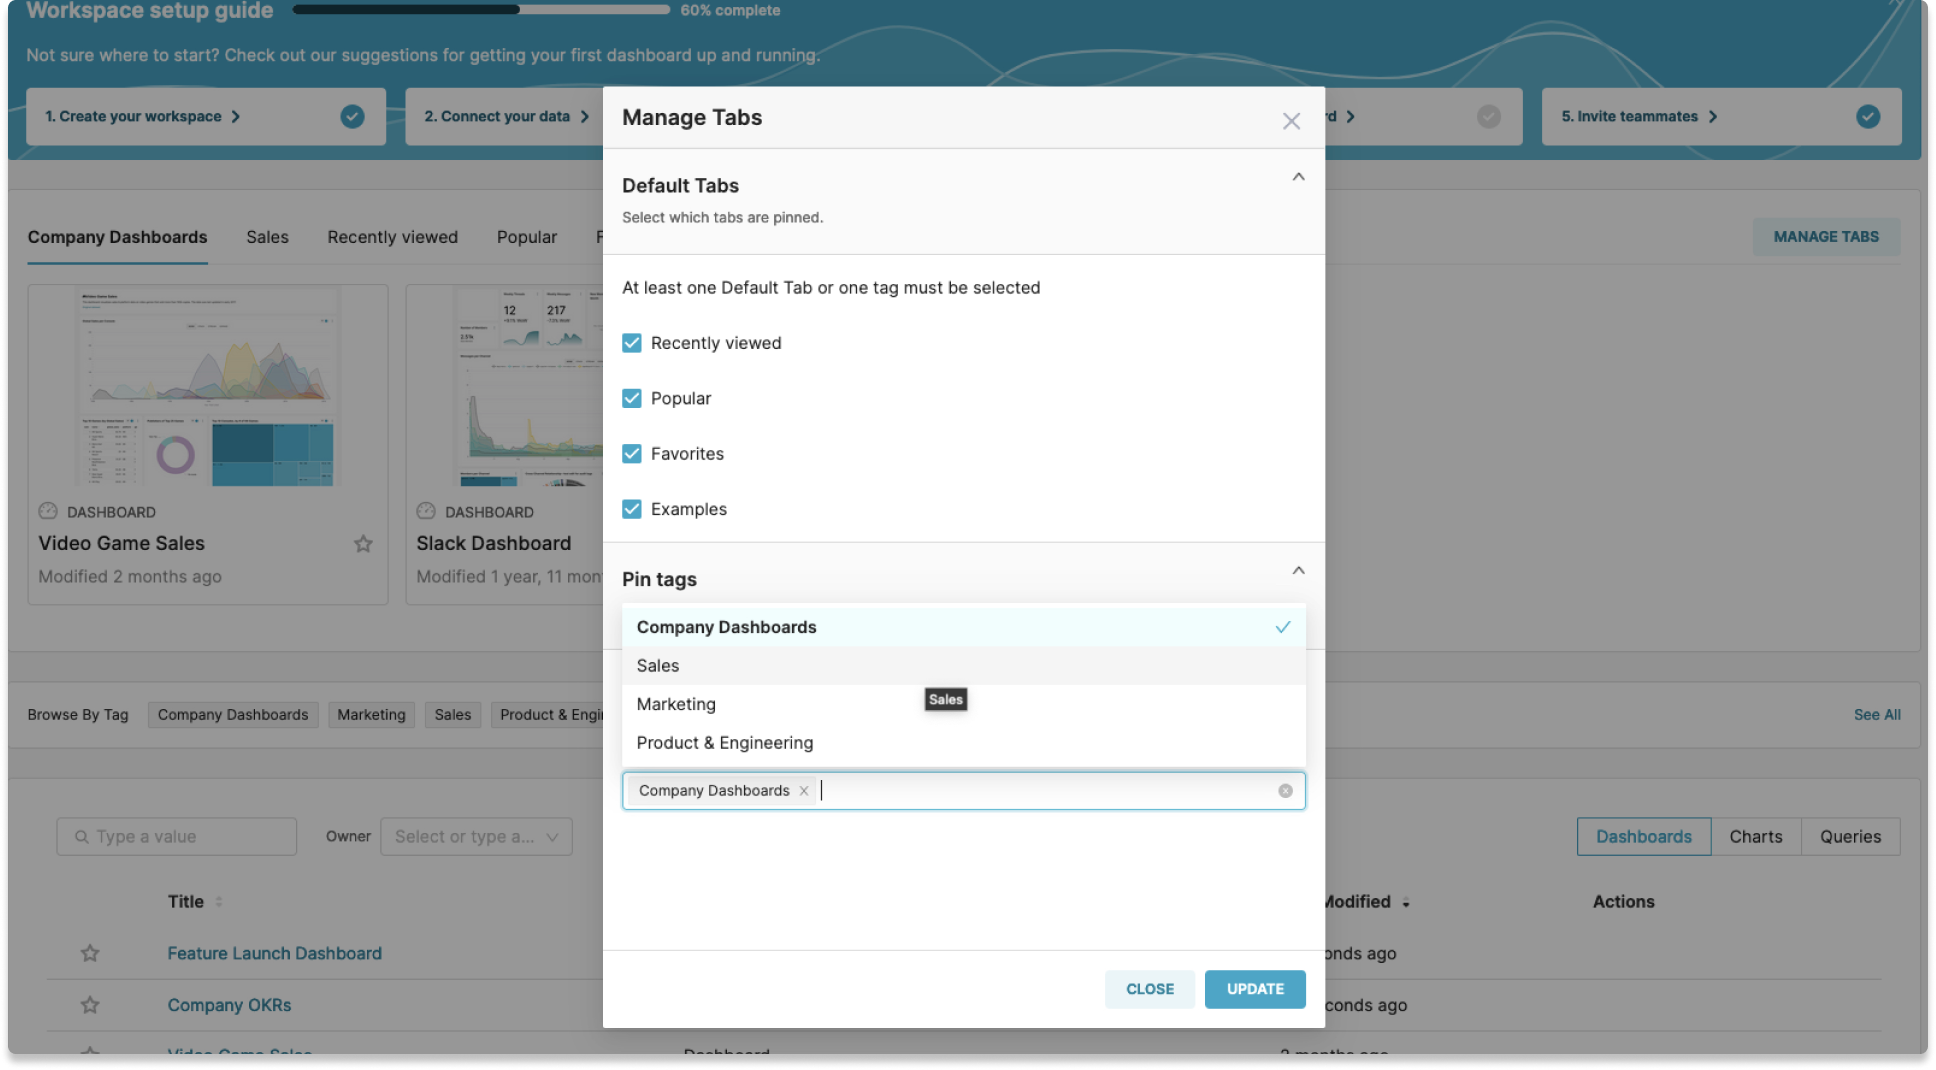
- Pinned tags will be displayed before the default tabs. When you're on the tab, you'll see dashboards, charts, and queries that are marked with this tag. Clicking on them will take you to the content.

Best Practices for Managing Tags
Since every team has different content organization needs, you have the flexibility to set up tags as you prefer.
Here are some guidelines for using tags:
- Consider the structure of your organization: what teams will be accessing what data. Create a tag for each team who will be using Preset (ex. Sales, Customer Success, Product, Leadership).
- Consider sub-divisions within your orgaizations: ex. Is your sales team divided into regions? Create tags which will compliment the high level structure you set up.
- Will you have users creating assets which are not certified by your data team? Create tags such as "Certified" or "Personal" to differentiate.
- Are you creating template charts / dashboards to be examples for your end users to build off of? Utilize a "Template" tag.
- Think about groups of charts that you might want users to see together - Which projects or product lines are related? Are there company-wide, summary, or general dashboards that are relevant to everyone?
| Use Case | Suggested Tag |
|---|---|
| Organization Structure | Company-Wide, Sales, Product, Engineering, DevOps, Customer Success, Executive |
| Sub-divisions | By region (e.g., Americas, APAC) By variations (e.g., a/b testing) |
| Certification | Official, Certified, Personal |
| Template dashboards for non-technical users | Template, Custom |
| Related products | Product line A, B, C |
| Related projects | Project X, Y, Z |