Reach out to a Workspace Admin in case this feature is not available to you.
Note: This feature is not currently available for embedded viewers.
In Preset, you access the chart relevant data and get additional information about a specific metric or a set of metrics by using the Drill to Detail feature on a dashboard view.
There are three ways to drill down to details of a chart:
- Drill to detail from drop-down to access all chart relevant data
- Drill to detail on a chart to access all chart relevant data
- Drill to detail by on a chart to access filtered version of chart relevant data
All charts in Preset support the drill to detail functionality as long as the chart groups data by a dimension value.
Drill to Detail from Drop Down
When you want to display all the data that makes up a chart, you can Drill to Detail from a chart’s drop down menu.
- Right click on the vertical ellipsis (⋮) menu of a chart in the dashboard.
- Click Drill to detail to view the full table.
Drill to Detail on a Chart
You can also directly interact with the chart to display all the relevant data.
- Right click on any part of a chart.
- Click Drill to detail to view the full table.
Drill to Detail By on a Chart
When you want to explore the underlying data of a specific value or a set of values on the chart - i.e., all columns in the dataset for rows filtered to the selected values, you can use the Drill to Detail By functionality.
Drill to Detail By is an interactive way to go from a high-level dimension such as countries, to a lower one such as the United States.
- Right click the dimension values on the chart.
- Click Drill to detail by, then either select a single dimension, or Drill to detail by all to view the filtered table.
Tips
- As you filter the dashboard, Drill to Detail will reflect the applied filters while displaying the underlying data in a tabular format.
- You can scroll down to 50 rows per page on a Drill to Detail table.
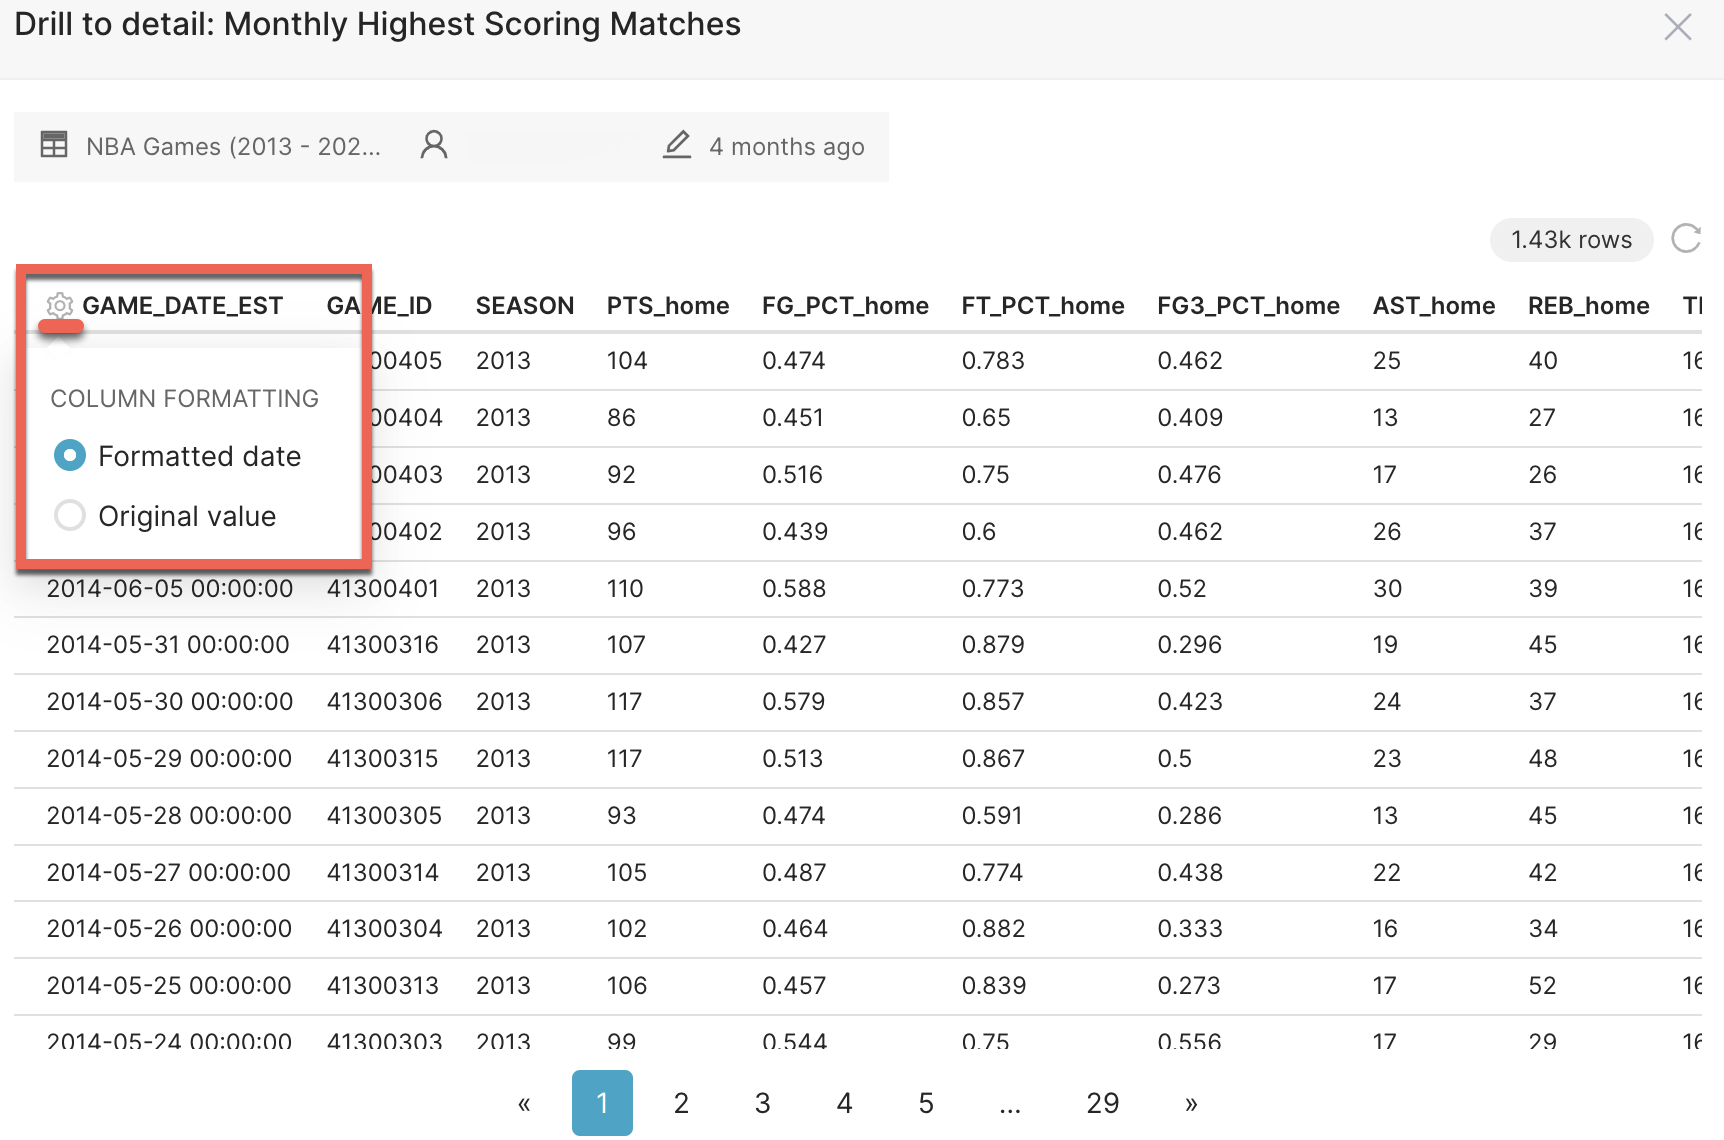
- When applicable, the Drill to Detail table shows the formatted data by default. You can change the column formatting to the original value by clicking the gear icon.