Overview
In this article, we will introduce cross-filtering. Cross-filtering enables you to apply a data element from a chart (e.g., a table row, a slice from a pie chart) and then apply it as a filter across all eligible charts in the dashboard.
Eligible Charts
In order to use cross-filtering, you need to use an eligible chart:
Area Chart
Bar Chart
Generic Chart
Graph Chart
Line Chart
Mixed Chart
Pivot Table Chart
Scatter Plot
Smooth Line Chart
Stepped Line Chart
Funnel Chart
Gauge Chart
Pie Chart
Sunburst Chart
Treemap Chart
Radar Chart
All Table Type Charts
All deck.gl Type Charts
Applying Cross-Filters
Cross-filters can be used in any dashboard with eligible charts.
To illustrate the usage of cross-filtering, we will do a walkthrough showing three charts: 1 table chart and 2 pie charts. The data pool is comprised of software developers, with the pie charts asking, "Are you an ethnic minority?" and "What is your gender?" and the table showing the top 15 languages spoken at home.
.png)
In the "Are you an ethnic minority?" pie chart, let's hover the cursor over the Yes, an ethnic minority pie slice and select it.
.png)
After doing this, the selected filter—Yes, an ethnic minority—will be applied to the other two charts.
You'll notice in the graphic below that the "Gender" pie chart and the "Top 15 Languages" table have both been updated to reflect the applied filter. You can also see that a filter-applied icon is shown on those charts:
.png)
Now, let's add an additional cross filter by selecting Female in the "Gender" pie chart:
.png)
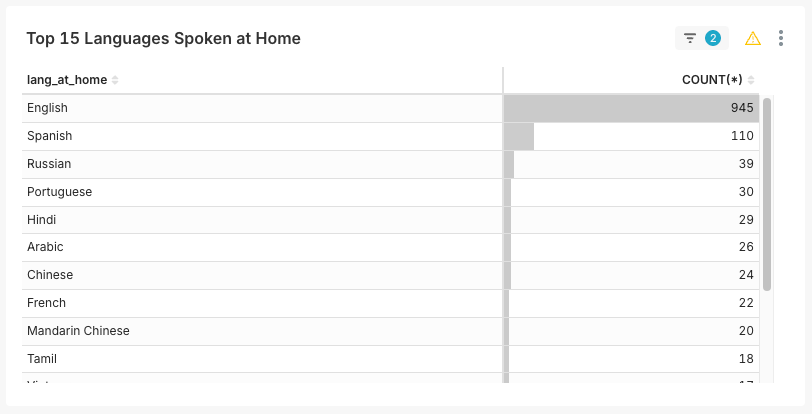
...and you can see that both filters—one from each pie chart—are being applied to the table. The table now shows the top 15 languages spoken at home by female ethnic minorities.
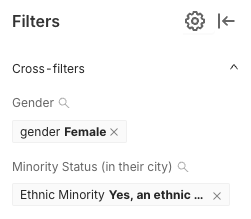
This is demonstrated by the small number "2" icon, which conveys the number of filters currently being applied to the chart:
You can check which cross-filters are active in the dashboard filter bar.
Each chart can only emit one cross-filter.
If you wish to apply a filter for multiple values, use the dashboard filter bar.
Disabling Cross-Filters
In some situations, you may want to prevent dashboard consumers from using cross-filtering.
To disable cross-filtering, click on the Gear icon in the dashboard filter bar and uncheck the "Enable cross-filtering" box.

Related Topics
Dashboard Filtering
Filter Types
Parent-child Filter
Pre-filter Data
Sort Filter Values
Single Value Range
Filter Tooltip
Managing Values
Scoping a Filter
Cross-filtering
Managing Filters