ECharts Options
ECharts Options is available on Preset version 6.1 and later.
Overview
Advanced users can fine-tune an ECharts-based chart by entering ECharts options directly. Use this when a setting you need isn't available in the chart controls, such as a custom title position or tooltip behavior.
Supported charts
Area, Bar, Line, Smooth Line, and Mixed charts.
Add custom options
- Open the chart in Chart Builder and go to the Customize tab.
- Scroll to ECharts Options (JS object literals).
- Enter a JavaScript object, for example:
{
  title: { text: "Total Revenue Over Time" },
  series: { itemStyle: { color: '#FF5733' } },
}
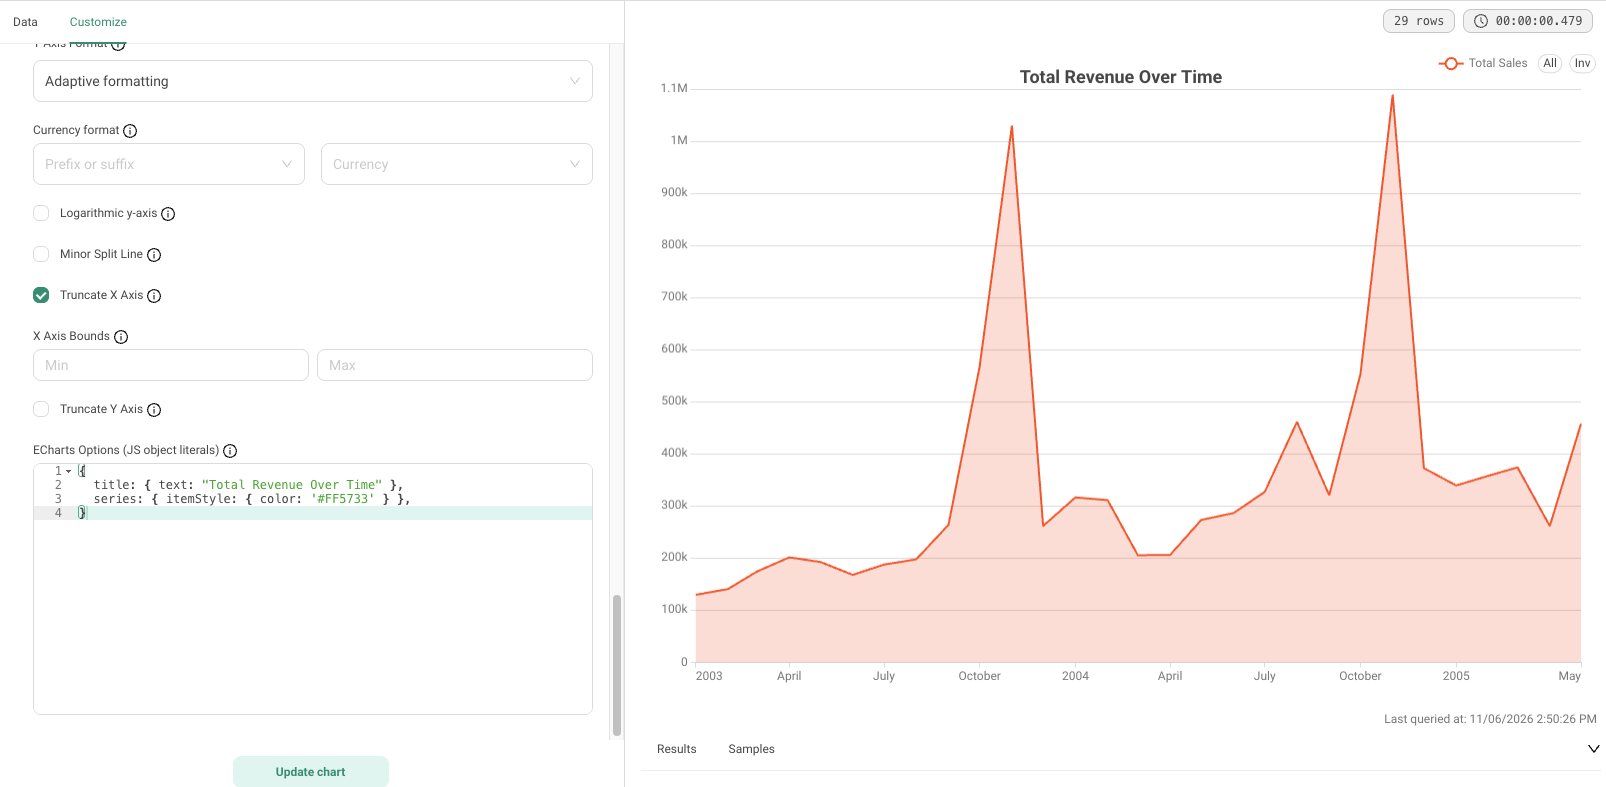
Changes apply as you type. Invalid input shows an error with the line and column number.
For everything available, see the ECharts options reference.
How options are combined with your settings
- Your options take precedence over the matching chart controls.
- Nested objects are merged — you only need to specify what you want to change.
- Arrays are replaced entirely, not merged.
- A
seriesobject applies to every series in the chart.
What's allowed
Only plain values are accepted: objects, arrays, strings, numbers, and booleans.
Functions, callbacks, and variables are not supported. For example, formatter: function(...) {} is rejected. Use string templates instead, such as formatter: "{b}: {c}".
Troubleshooting
| Issue | What to check |
|---|---|
| Syntax error | Check commas and quotes at the line shown |
| Validation error | An option has an unexpected type — check the value format in the ECharts reference |