Custom formatting gives you greater control over how numeric data is displayed in a Preset chart. With custom formatting, you can apply the D3 python library formatting options to numeric data shown in visualizations.
Each type of visualization will have different customization options.
You can change the format of what is displayed when you see the below options:
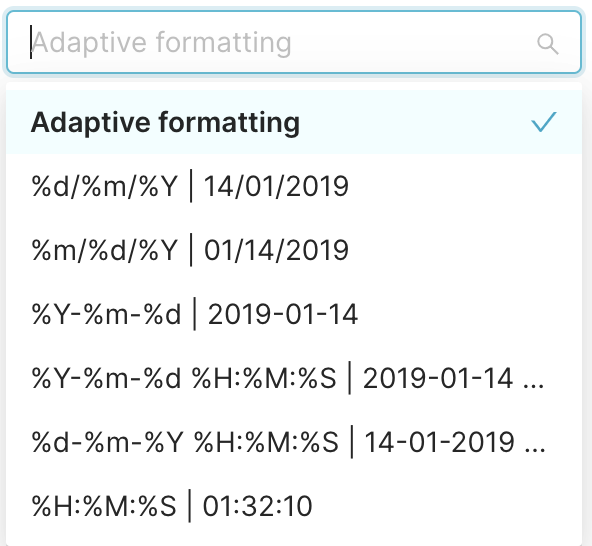
By default, Preset will give a default format using Adaptive Formatting, but you can change the format either by clicking on another available option or typing the corresponding D3 formatting option
Date Formats
| Format | Description | Example | |
|---|---|---|---|
| %a | Weekday, short version | Wed | |
| %A | Weekday, full version | Wednesday | |
| %w | Weekday as a number 0-6, 0 is Sunday | 3 | |
| %d | Day of month 01-31 | 31 | |
| %b | Month name, short version | Dec | |
| %B | Month name, full version | December | |
| %m | Month as a number 01-12 | 12 | |
| %y | Year, short version, without century | 18 | |
| %Y | Year, full version | 2018 | |
| %H | Hour 00-23 | 17 | |
| %I | Hour 00-12 | 05 | |
| %p | AM/PM | PM | |
| %M | Minute 00-59 | 41 | |
| %S | Second 00-59 | 08 | |
| %f | Microsecond 000000-999999 | 548513 | |
| %z | UTC offset | +0100 | |
| %Z | Timezone | CST | |
| %j | Day number of year 001-366 | 365 | |
| %U | Week number of year, Sunday as the first day of week, 00-53 | 52 | |
| %W | Week number of year, Monday as the first day of week, 00-53 | 52 | |
| %c | Local version of date and time | Mon Dec 31 17:41:00 2018 | |
| %x | Local version of date | 12/31/18 | |
| %X | Local version of time | 17:41:00 | |
| %% | A % character | % |
Other Formats
For other formats such as numbers or currency, please refer to the D3 Library