A tree map uses scaled rectangles to visualize the same metric across multiple different groups. You can add further stratify your tree map and add hierarchy using a dimensional column. Here are some examples:
Reference Content
The following articles may be useful resources as you build your chart:
- Creating a Chart: A walkthrough of the overall process of chart selection and creation.
- Using Preset Chart Builder: How to work with the Chart Builder page, the primary interface used when creating a chart.
Creating a Basic Treemap
Preset currently has a few options for treemaps in the visualization picker:
- Treemap v2
- Treemap
We strongly recommend using the Treemap v2 visualization type, as it's newer and supports more features.
To create a Treemap, you need to define:
- the Metrics you want visualized as rectangles
- the Dimension(s) you want to use for partitioning
Below is a simple Treemap:
 Here's an explanation of the selections we made in the chart builder interface to generate this chart.
 | Chart Builder options
|
 | Generated Query |
Creating a Hierarchical Treemap
You can add layers of hierarchy into your treemap by choosing multiple dimensional columns.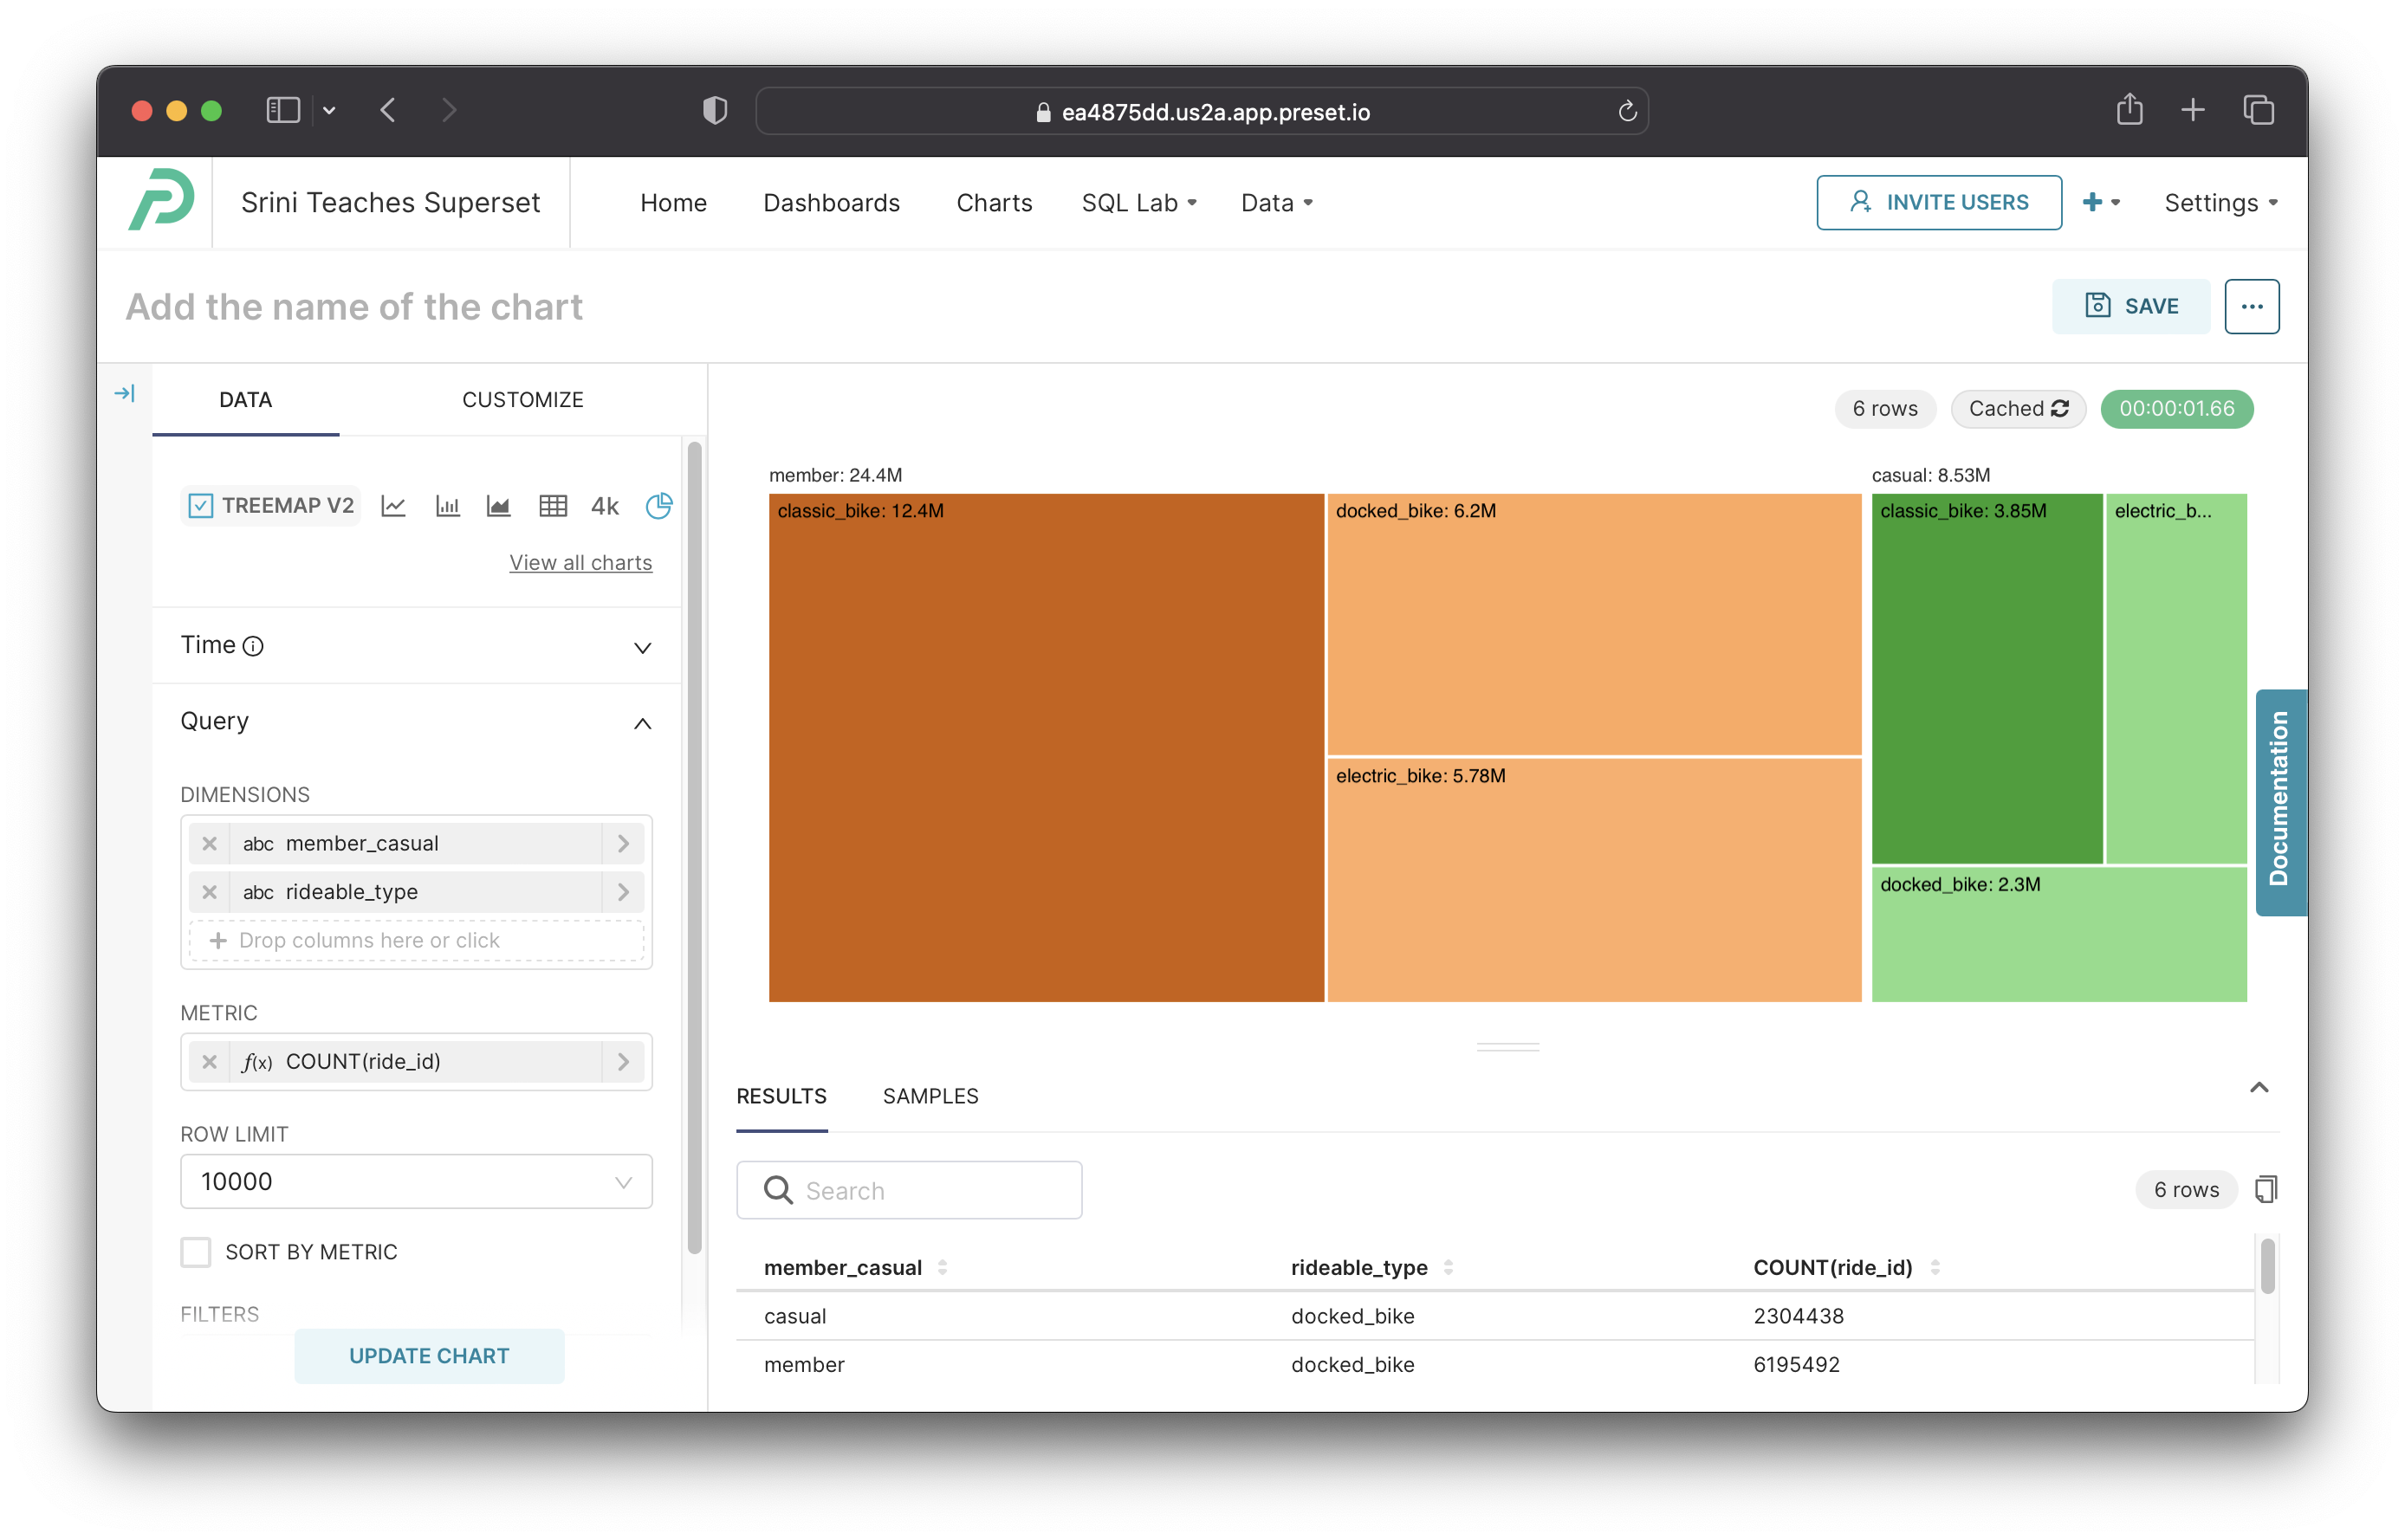
Here's a breakdown of the selections we made in Chart Builder to generate the chart above.
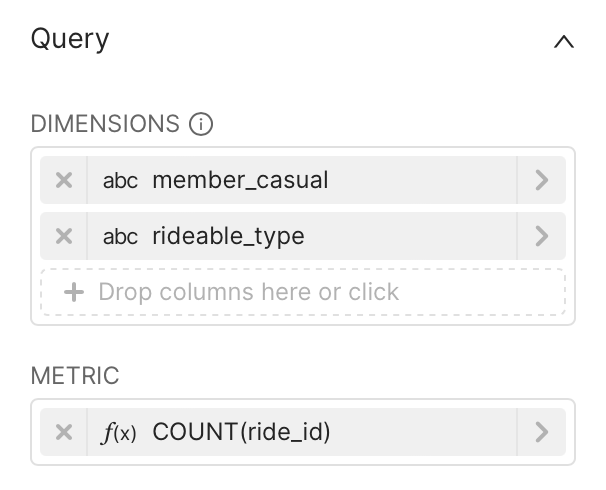 | Chart Builder options
|
.png) | Generated Query |
Customizing your Treemap
Under the Customize tab, you can find a number of options for customizing your tree chart further. Here are some of the options:
- Color Scheme: choose the color palette you want used in your chart
- Labels
- Show Labels: checkbox that shows the metric values as labels if ticked
- Show Upper Labels: checkbox that shows labels of parent squares in a hierarchical treemap
- Number Format: how you want the numbers formatted for display
- Date Format: how you want the date values formatted for display