👤 This documentation is intended for Limited Creators, Secondary Creators, Primary Creators, and Workspace Admins. Check with your Team Admin for additional access.
Overview
Preset's SQL Lab is the workspace for users to manage all aspects of SQL usage in their Preset environment.
Key features include:
- Write customer SQL queries on any database you've connected;
- Browse database metadata: tables, columns, indexes, and partitions;
- A multi-tab environment to work on multiple queries at a time;
- Support for long-running queries;
- Uses the Celery distributed queue to dispatch query handling to workers; and,
- Supports defining a “results backend” to persist query results.
- A search engine to find queries executed in the past; and,
- Supports templating using the Jinja templating language which allows for using macros in your SQL code.
The SQL building and customization component is SQL Editor.
Browsing to the SQL Editor
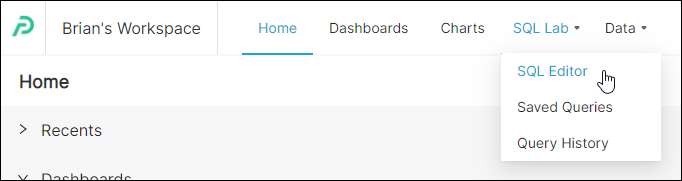
In the Toolbar, select SQL Lab and, in the drop-down menu, select SQL Editor.
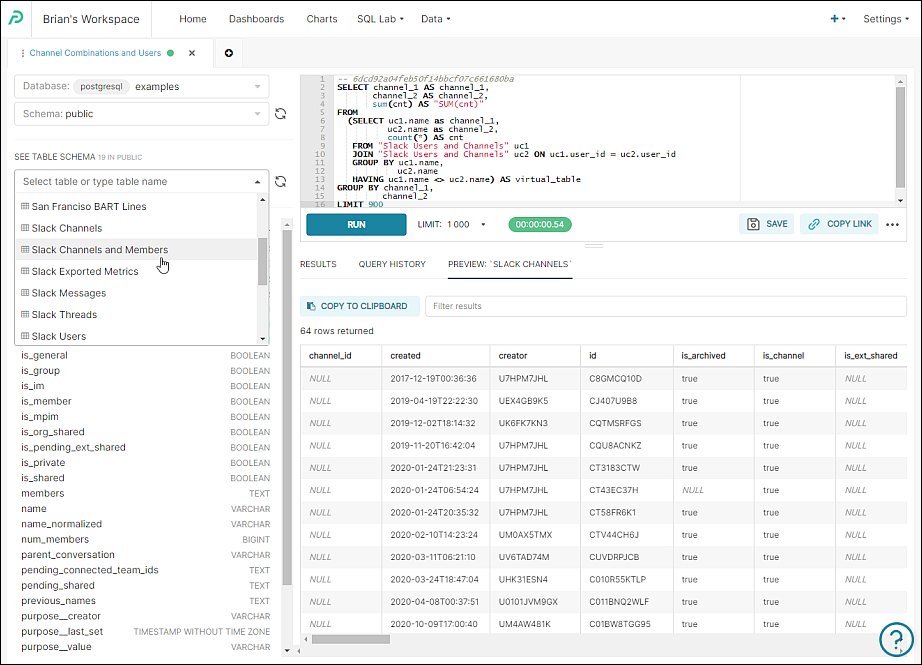
Schema Navigator
Browse to and select different schema within the datasource, provided that Expose in SQL Lab is enabled in the database.
Expose in SQL Lab
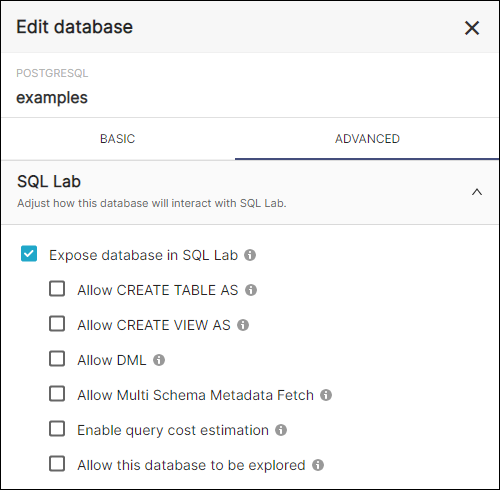
To ensure that this setting is enabled, browse to your database and select the Edit pencil icon. Then select Advanced and expand the SQL Lab section.
The Expose database in SQL Lab field should be selected.
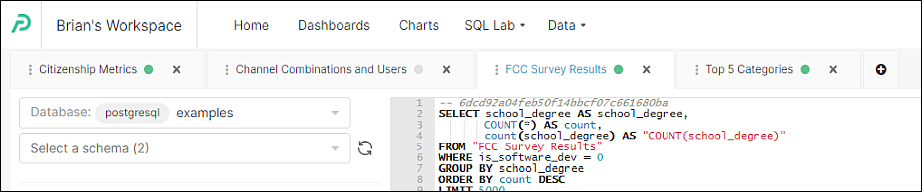
Multi-tab Queries
Multiple tabs for each query enable you to easily switch between different queries within one interface.
SQL Editor Panel and Manager Bar
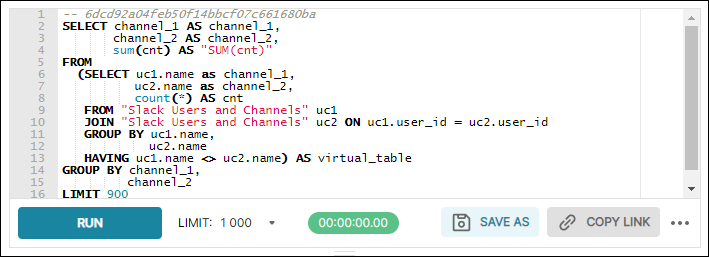
Editor Panel
The SQL Editor panel allows different data source semantics / comments and runs one query at a time.
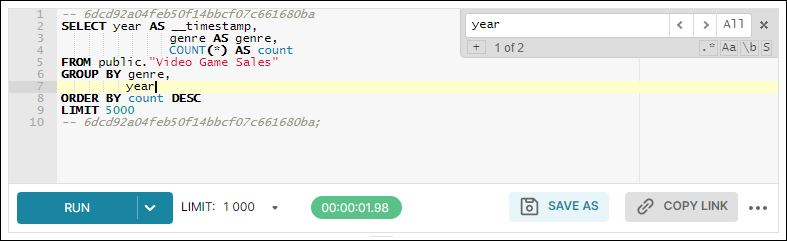
Search Function
To search for content within the Editor panel, use CTRL-F to launch the search function and enter a keyword. To replace a term, select the plus icon and enter a word after Replace with.
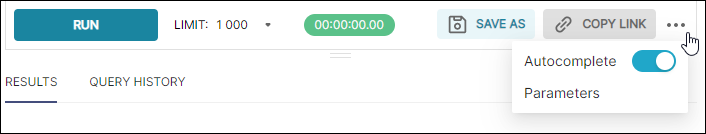
Manager Bar
Enables you to manage your query work with common tools, such as run, save, share, and an auto-completion toggle. The Parameters option enables you to use the Jinja templating syntax to assign a set of parameters as JSON.
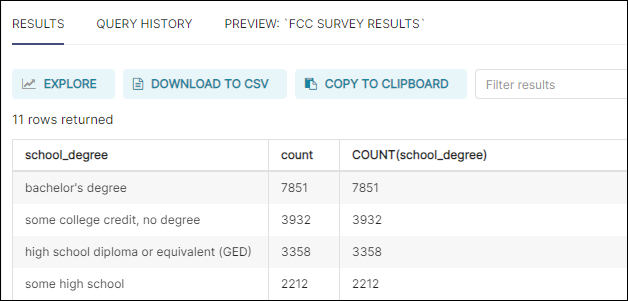
Results Tab
View the results of your queries here. Tools include:
- Chart Builder: Open the table view chart with the run query.
- Download to CSV: Save data in a CSV file.
- Copy to Clipboard: Copy data to your systen's clipboard.
Considerations when Running Queries
Some items to keep in mind when running queries in the SQL Editor:
- Even if the SQL Editor has several queries, only one query result will be showed (the last one);
- A query could timeout if it did not return values from the database (the default waiting time is 6 hours) or if the web server request timed out;
- Queries limit the number of rows that are retrieved from the database. This is because:
- It is an unnecessary overhead to bring in a lot of data from the database;
- Limiting the number of rows prevents long-running queries in the database; and,
- To avoid the accidental selection of Select * From with a table comprised of millions of rows, which could halt the database.
Failed Queries
There are a number of query errors that can occur due to a misalignment between your query and the database.
Some examples include:
- Bad Reference: A query can fail because it is referencing a column and/or table that no longer exists in the datasource. You can either modify the query accordingly or remove the column from the query.
- Unsubmitted Query: A query will not even be submitted to the database if it is missing required parameters. You should define all the parameters referenced in the query in a valid JSON document.
Using Chart Builder
The Chart Builder tool enables you to save your query as a virtual dataset and then continue exploring in the chart Chart Builder page. Alternatively, you can overwrite an existing dataset.
To use this tool, from the SQL Editor, run a query and view in the Results tab.
In the Results tab, select Chart Builder.

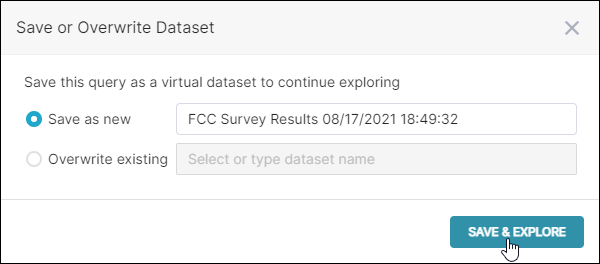
The Save or Overwrite Dataset window appears.
In the Save as new field, enter a new name for the virtual dataset, if needed, and then select Save & Chart Builder.
The chart Chart Builder page appears featuring the newly-saved virtual dataset.

If you wish to overvwrite an existing dataset, then select the Overwrite existing field, select the drop-down to view and select a dataset or enter a name to search. When chosen, then select Save & Chart Builder.
Viewing SQL from Chart Builder Page
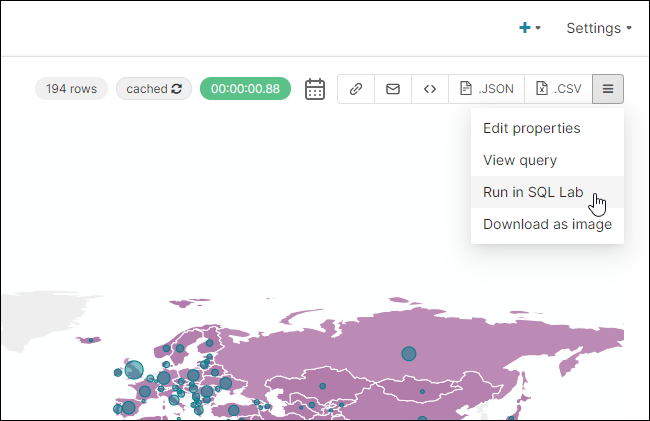
You may also wish to view the underlying SQL code of a current chart in the SQL Editor.
To do this, from the chart's Chart Builder page, select the triple bar icon and, in the sub-menu, select Run in SQL Lab.
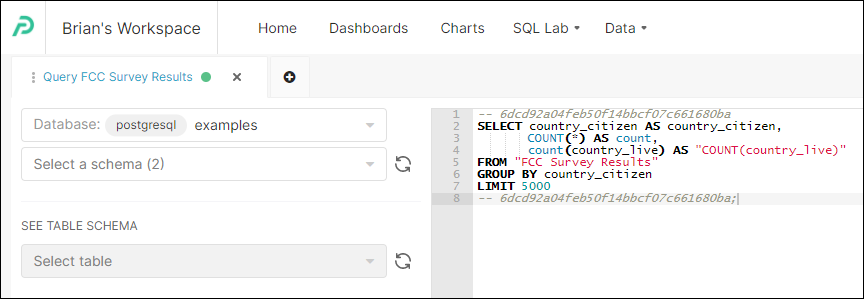
The underlying SQL code of the chart will now appear in the SQL Editor. From here, you can further refine or change the SQL code. If you wish to transfer it back to the chart Chart Builder page, just select Chart Builder as described above.
Create Table As (CTAS)
Enable CTAS
The Create Table As (CTAS) feature enables you to create a new table based on a SQL query.
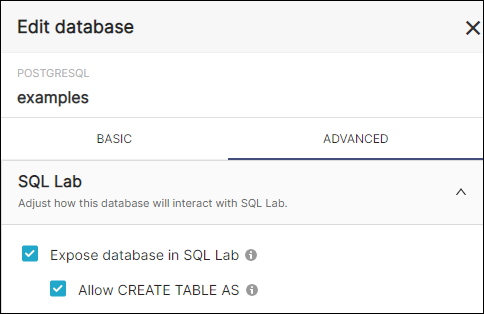
In order to use this feature, it must be enabled:
- Edit a database.
- Select the Advanced tab.
- In the SQL Lab section, select the Allow CREATE TABLE AS field.
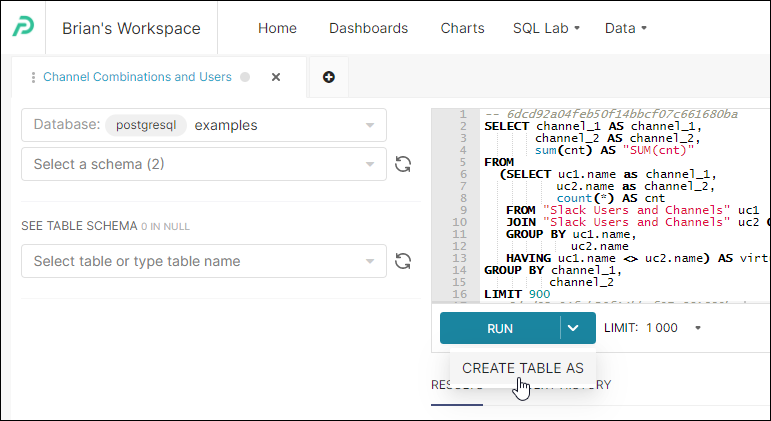
Using CTAS
The CTAS button is used to materialize a query to a singular table in order to avoid complex joins or aggregations that can affect performance.
Query History Tab
The Query History tab, as the name implies, shows a history of all previously run queries and conveys basic information, such as success/failure, start time, duration, progress (if still running), and so on.
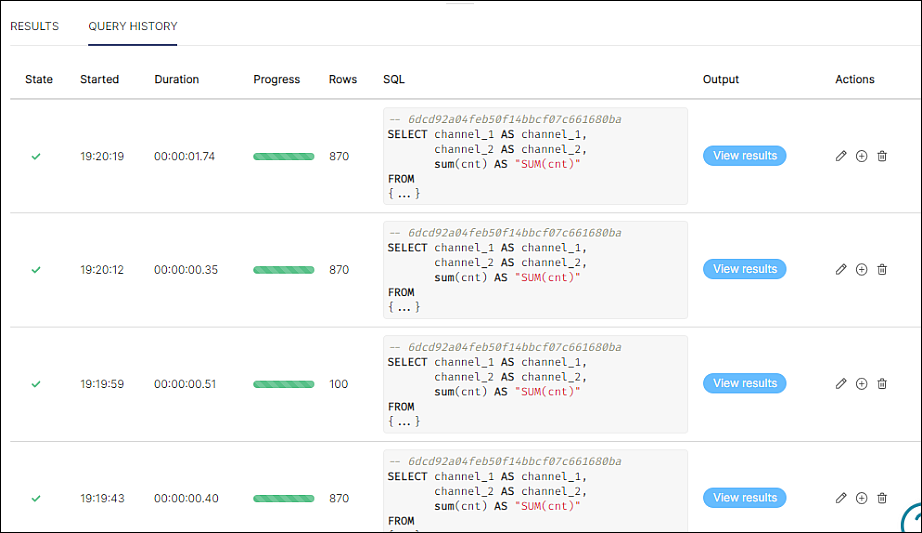
Of particular note is the Actions column, which enables you to do the following:
- Edit (pencil icon): Overwrite text in the editor with a query on the selected table.
- New Tab (plus icon): Runs the query in a new tab.
- Trash Bin: Removes the query from the history log.