Overview
Why performance matters
After you’ve built some business critical dashboards, your stakeholders need to view trends and data points instantaneously for fast decision making. As such, surfacing a dashboard or webpage stuck in a loading state is often a disappointing experience.
Loading a dashboard quickly requires a chain of successful operations, from how the user is accessing Preset to how fast the database engine processes each chart. In this article, we will walk through the following best practices—in order from most impactful to least—so that you can maximize your organization’s decision-making efficiency.
Identifying Bottlenecks
Since every performance improvement case is different, it's beneficial to narrow down the bottlenecks, magnifying them, then repeat until satisfactory performance is achieved. At a high level, it’s important to discover the big areas that could be slowing things down based on common symptoms and how to diagnose which one to focus on first.
Symptom 1: Chart stuck in loading spinners
Often what’s holding up a dashboard is the underlying analytics database engine. This usually shows as long-loading “spinners.”
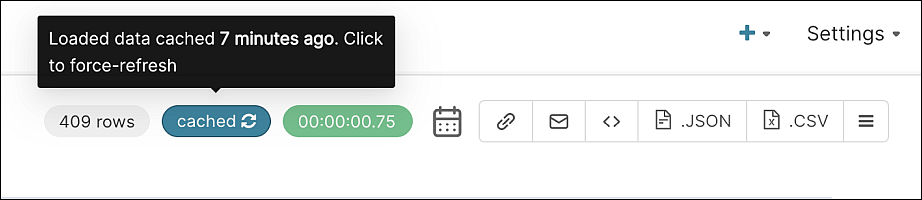
At Preset, we load a cached result if one is available, so if the same chart is loaded multiple times, then subsequent loads may be a lot faster. It's important to know if your charts are loading data from the cache or from your database. In order to determine this, you can check the following:
On the Chart Builder Page, you can find this information at the top right:
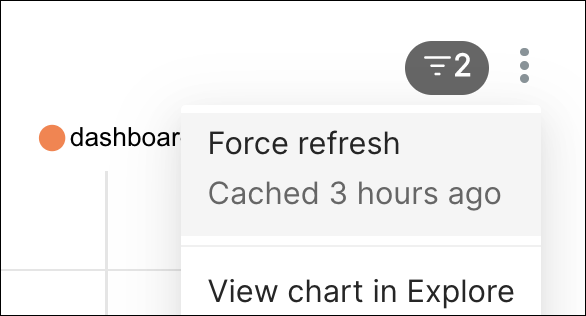
In your Dashboard, you can check the chart settings:
Useful Knowledge
A bottleneck in the underlying analytics database engine will show up as a slow initial load (or forced refresh) of a chart or dashboard, but will load faster in subsequent browser refreshes.
Symptom 2: Chart data points render slowly or browser crashes
Although Preset limits the rows returned when it comes to large result sets, there are still instances when the dataset returns too much content. This could result in the network being overwhelmed and/or your browser crashing.
A couple of ways to identify this behavior include:
- Charts that have long load time and/or lock up your browser before rendering the the visualization; and,
- Your browser’s developer tools network tab indicates a payload that is large in size.
To identify performance hindering charts, look for outliers that have
- Large amount of data/load returned from the requests to load everything
- Large amount of dimensions on the same chart that need to be rendered
It’s important to understand that many bottlenecks add up and compound, such as:
...between the database server itself dealing with a large “server-side cursor”;
...network bandwidth between the database server and Preset’s infrastructure; and,
...the traffic from Preset's infrastructure to the user's browser.
Useful Knowledge
By examining the rows, columns, and content, you can summarize the data further in order to include only what is necessary.
Symptom 3: Browser locks up
Browser lock ups are horrible and challenging to troubleshoot since you are unable to apply a resolution.
Lock up before the page / dashboard skeleton has loaded
If there’s a struggle to just load a page prior to a chart spinner appearing, then it’s likely that you have an unhealthy machine. Maybe your computer/browser is struggling with memory (swapping) or your network bandwidth is counted in kilobits, not megabits. You can confirm this by verifying whether or not other websites are showing similar symptoms.
Lock up after the page / dashboard skeleton has loaded
This symptom is often related to large result sets, but some visualizations may be more sensitive to large result sets than others. The recommendation here is to summarize your query output for visualization so that only what's absolutely necessary is visualized.
Best Practices to Optimize Performance
We recommend the following best practices (from greatest to least impact):
- Optimize your Database for Querying
- Enhance your Dashboard for Viewing
- Improve Access to your Dashboard
Let's have a closer look at each one...
Optimize your database for querying
At Preset, the Dataset is the core component to working with data — in order to create a chart, you first have to select a pre-existing dataset. Preset enables users to create two different dataset types: Physical and Virtual Datasets.
- A Physical Dataset is directly related with a database table. For example, the resulting SQL query of an un-aggregated Table Chart to list all order numbers from the
"Vehicle Sales"table would be:
SELECT order_number AS order_number
FROM public."Vehicle Sales"
LIMIT 1000- A Virtual Dataset is created from a SQL query (which might include columns that aren't used by this particular Chart, or even combine multiple tables). For example, the resulting SQL query of an un-aggregated Table Chart to list all order numbers from the
"Vehicle Sales"table using a Virtual Dataset could be:
SELECT order_number AS order_number
FROM (select * from "Vehicle Sales") AS virtual_table
LIMIT 1000
Preset charts are powered by queries that run on your database engine, and the primary way to improve the wait time of a dashboard is to reduce the time it takes for your database to process a chart’s query.
It’s important to note that every database differs quite a bit in terms of the switches and levers that they expose for optimization purposes. Some database expose things like partitions, indices of a variety of shape, materialized views, different storage tiers, and that’s without speaking about the database specific technologies. If your database can process large arbitrary dataset quickly regardless of tuning, then you don’t have to do much tuning and can expect decent response time on arbitrary workloads.
Nevertheless, creating pre-calculated and/or aggregated data views that align closely with your end user's visualization goals can reduce the run time of a query.
Recommendations
| Concept | Why it’s important | How to implement |
|---|---|---|
| Summarized Materialized View/Table | Pre-calculated values reduce subsequent operations on the dataset | Utilizing a variety of tools such as Airflow or dbt, commonly-used joins and aggregations can be defined as materialized views or tables that can then be used in Preset as a Physical Dataset. |
| Partitioning | Eliminating data that is less relevant to the end user can reduce the time that the database spends scanning and computing | Break large datasets into partitions (such as by department or timeframe) based on access needs. Historical data can be aggregated while recent data can offer granular changes. Note that partitions are only useful where predicates (filters) are applied to the partition columns. This allows the database to perform “partition pruning” and limit scanning based on the predicate. |
| Indexing | Indexing minimizes scans required when a query is processed | Columns that are frequently used for filtering, such as time or a particular category, should be used for indexing the dataset. |
| Filtering | Filtering bounds data scans to reduce the data compute | Add filters to your query or apply a WHERE clause when creating your dataset to reduce irrelevant data for the end user. |
When in doubt, running an explain on your query can help you understand which operation is taking the longest time.
Enhance your dashboard for viewing
After you’ve optimized how queries are run on your database, you can further optimize how the dashboard is built and managed.
Too many charts
Web browsers have built-in limitations to how many concurrent requests can be processed, which means that loading a dashboard with a double or triple digit number of charts may be less than optimal.
Thus, no matter which business intelligence tool you’re using, it is best practice to minimize the number of charts on a dashboard and the total time it takes to process all queries underlying those charts.
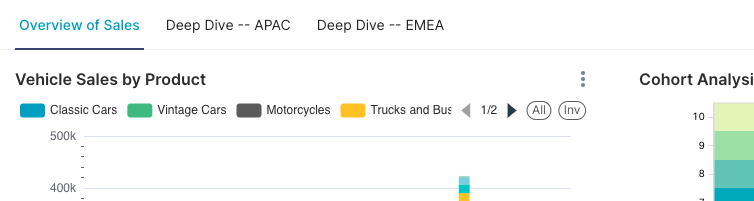
Upon page load, Preset renders only the first tab's charts for the user. It isn't until the user clicks on another tab do the charts of the second tab get rendered.
In order to reduce the creation of "Frankenstein" dashboards that are overflowing with irrelevant charts, we recommend:
- Proactively determine the key questions that will be answered on a dashboard
- Organize dashboards into themes.
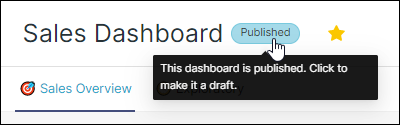
Preset’s “Published” dashboard toggle can further help differentiate dashboards that are production ready vs. ones that are creative sandboxes.
If you are facing issues during the initial dashboard loading, the bottleneck might be a chart on your first tab. Look for opportunities to split the load of a tab by migrating some of the charts to a new tab.
Data size
The last piece that impacts dashboard render time is the size of the data downloaded by your browser. More megabits from a larger result set or complex visualization can lengthen the render time of charts by your browser.
Recommendations
| Concept | Why it’s important | How to implement |
|---|---|---|
| Aggregation | Reducing the number of data points plotted lightens the render load of a chart | Use aggregations like Count(), Sum(), Avg(), etc. on time series data or try grouping your data by category to condense the information that is presented. |
| Filtering | Filtering to what’s absolutely necessary to limit how much data a chart is required to load | Add a filter at the chart or dashboard level that focuses the data output based on a time range or a category. Enabling default filters can also limit information presented on initial dashboard load. |
| Dashboard Tabs | Minimizing the number of charts on a dashboard can reduce the total time it takes to process all queries underlying those charts | Edit your dashboard and add tabbing to bucket charts and the information displayed. |
| Server Pagination | Instead of rendering all the rows of a table, only render the first viewable page | For tables specifically, check the “Server Pagination” below the Sort By field so that the table only renders the first page of results. |
Improve access to your dashboard
Internet connection speed
Even if you’ve optimized your database and your dashboard, we all know that a poor internet connection can make any web page load at a snail’s pace. However, other bottlenecks may not be as obvious.
System memory
Beyond the internet connection, your computer’s ability to manage the rendering of a dashboard can be dependent on the RAM and other add-ons that your browser is managing. If RAM is low, your computer may take longer to perform the same task of loading your charts, regardless of the internet connection speed.
Browser add-ons and management
Browser add-ons may also consume processing power. When in doubt of the effects of add-ons on your browsing experience, try loading up a Preset dashboard in an incognito browser where no add-ons are in effect.
You might want to consider keeping some key dashboards open by default on your browser. A web page refresh purges your browser cache, which means keeping the critical Preset browser tab open will help you see faster data refresh speeds.
Network traffic
Finally, infrastructure architecture may have a small impact on your experience. When you load up a Preset dashboard and force refresh all charts, your request is being sent from your IP to your workspace’s deployment location, which then sends queries to your data warehouse location.
The data then makes a reverse trip back to your computer to show you the updated information. To reduce the latency across this chain, you can relocate your Preset workspace deployment or your data warehouse to reduce network traffic bottlenecks.
Summary
In summary, optimizing the Preset performance for your stakeholders can be a multifaceted set of operations.
The list of procedures ordered by most to least effective are:
- Optimize your Database for Querying
- Enhance your Dashboard for Viewing
- Improve Access to your Dashboard
By proactively structuring queries, planning out dashboards based on user needs, and keeping all server operations in close proximity, you can successfully maximize your organization’s decision making efficiency. We encourage you to continue to identify performance bottlenecks proactively and take a scientific approach to iterating and resolving those bottlenecks.