Overview
In this article we will discuss how to connect Preset to a publicly-shared Google Sheet. This means an unrestricted Google Sheet with the permission setting of Anyone with the link.
To learn how to connect Preset to a privately-shared restricted Google Sheet, please see Google Sheets (Private) Connection.
Note
The Google Sheets Connector is built on top of SQLite and there is support for all SQLite commands.
Step 1: Create a Database
To start, we need to connect a database to Preset.
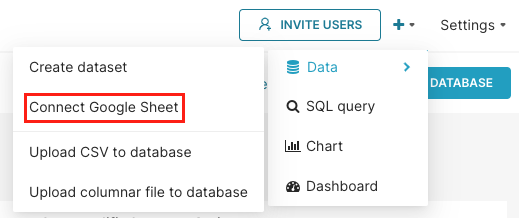
In the Toolbar, hover your cursor over the plus + icon, then Data, and then select Connect Google Sheet.
The Connect a database window appears.
In the Display Name field, enter a meaningful name for the new connection to your public Google Sheet. In this example, we simply used the default Google Sheets.
Under the How do you want to enter service account credentials? section, you can ignore this as it is only applicable if you are connecting a private Google Sheet.
.png)
Step 2: Copy the Google Sheet Link
Confirm Sheet Permissions
For this walkthrough, we are going to use a Google Sheet that contains data about Netflix titles. You can view the sample Netflix GSheet here  .
.
Before continuing, make sure that the Google sheet has its permission set for anyone with a link.
Public Google Sheets Privacy
Users will only be able to access a public google sheet if you provide them with the exact sharable URL. Public google sheets won't appear on search engine results, etc.
Copy the Link
Step 3: Connect Google Sheet as Table
Our next step is to connect the Google Sheet as a table to the database.
In the Google Sheet name field, enter a name for a table — in this example, we called our table "Netflix Data".
In the URL field, paste the Google Sheet URL from your clipboard (copied in Step 2 above).
To create additional tables, then select + Add Sheet and repeat the process.
When done, select Connect.
.png)
Step 3 of 3 will appear. At this stage, you can optionally configure Advanced options, if needed. To learn more, please see Advanced Connection Settings.
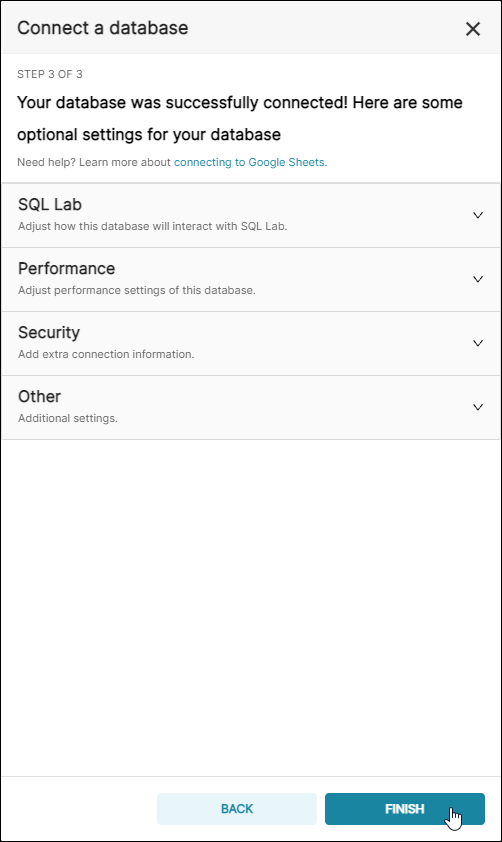
To finalize the connection, select Finish. Great job!
Step 4: Add a Dataset to Preset
Our final step is to add the table/dataset to Preset. This enables you to create new charts using the dataset.
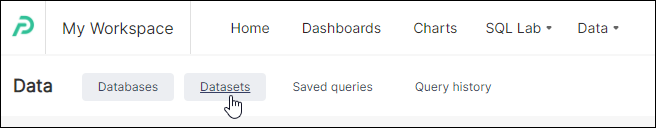
Start by navigating to Datasets. From the Data screen, simply select the Datasets tab.
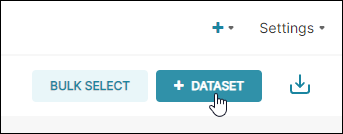
Then select + Dataset.
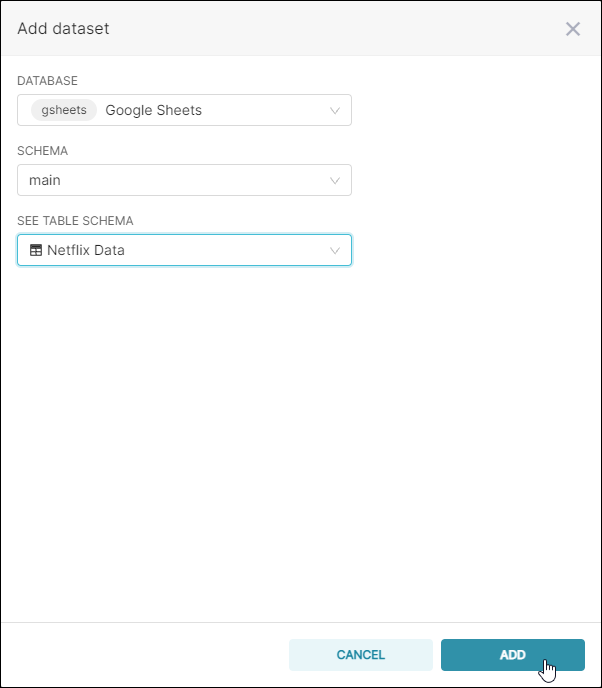
The Add dataset panel appears.
In the Database field, select the database name that you defined earlier in the Display Name field.
In the Schema field, select a schema (if applicable).
In the See Table Schema field, select a table that you created in Step 3 above.
Select Add.
Great, you are now ready to start creating charts using your Google Sheet data!
Step 5: Create a Chart from the Google Sheet Dataset
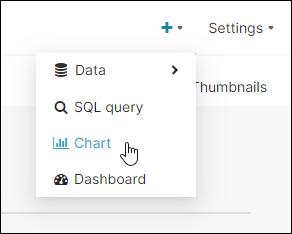
To create a chart using your newly connected Google Sheet dataset, select the plus + icon and then choose Chart.
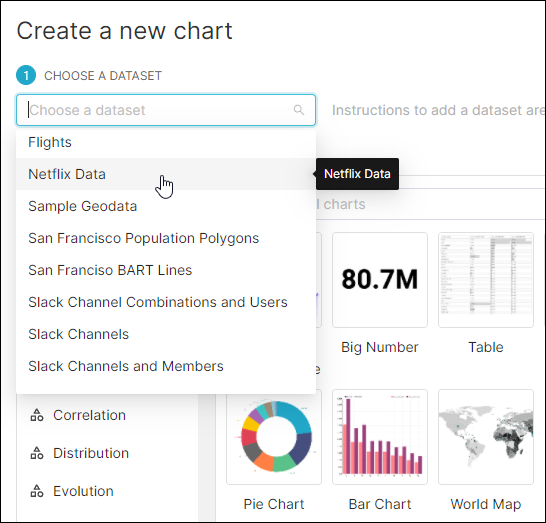
The Create a new chart screen appears.
In the Choose a Dataset field, select the name of the dataset you added in Step 4 above (in this example, "Netflix Data").
Now you can start the process of creating a new chart in Preset!
Please see Creating a Chart to learn more about the chart selection process. We also recommend reading Advanced Configuration and The Preset Explore Interface to learn about the chart configuration process.
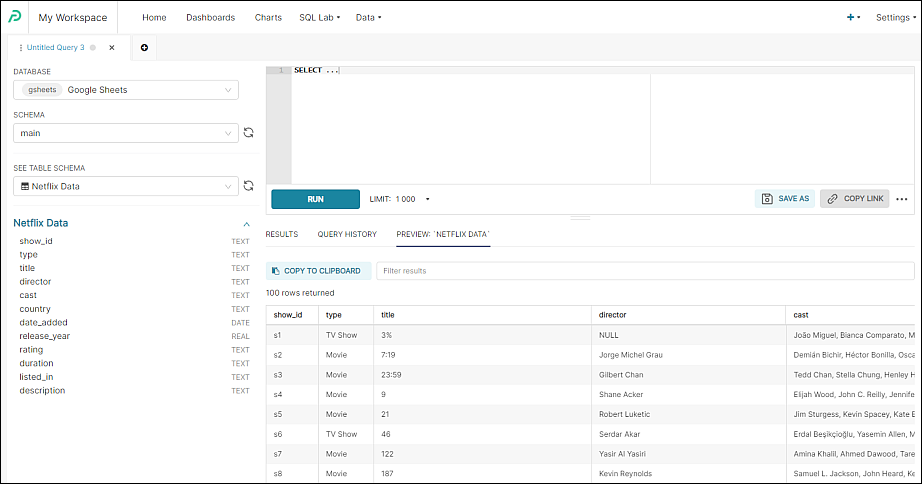
Step 6: Explore in SQL Editor
Google Sheet data can also be queried directly in the SQL Editor.
Here's how to do it:
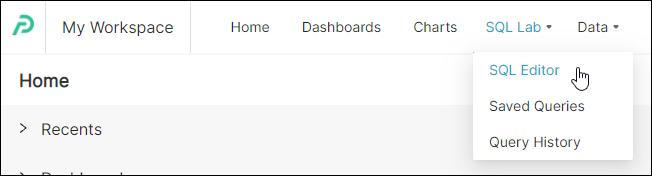
Navigate to the SQL Editor by hovering your cursor over SQL Lab in the Toolbar, and then selecting SQL Editor.
In the Database field, select your Google Sheets database connection.
The Schema field will automatically populate — select the best option.
In the See Table Schema field, select the appropriate table (e.g., Netflix Data).
The interface will refresh and the table's columns and metrics will appear. In addition, the the Preview: <table name> tab will populate with actual data.