Filter Types
- 08 Nov 2023
- 4 Minutes to read
- Print
- DarkLight
Filter Types
- Updated on 08 Nov 2023
- 4 Minutes to read
- Print
- DarkLight
Article summary
Did you find this summary helpful?
Thank you for your feedback!
Overview
In this article, we will explore the four different types of filters that can be applied to charts within a dashboard.
Filter Types
In the Add and edit filters window below, you'll notice two tabs: Settings and Scoping. For now we will focus on the Settings tab (selected by default).
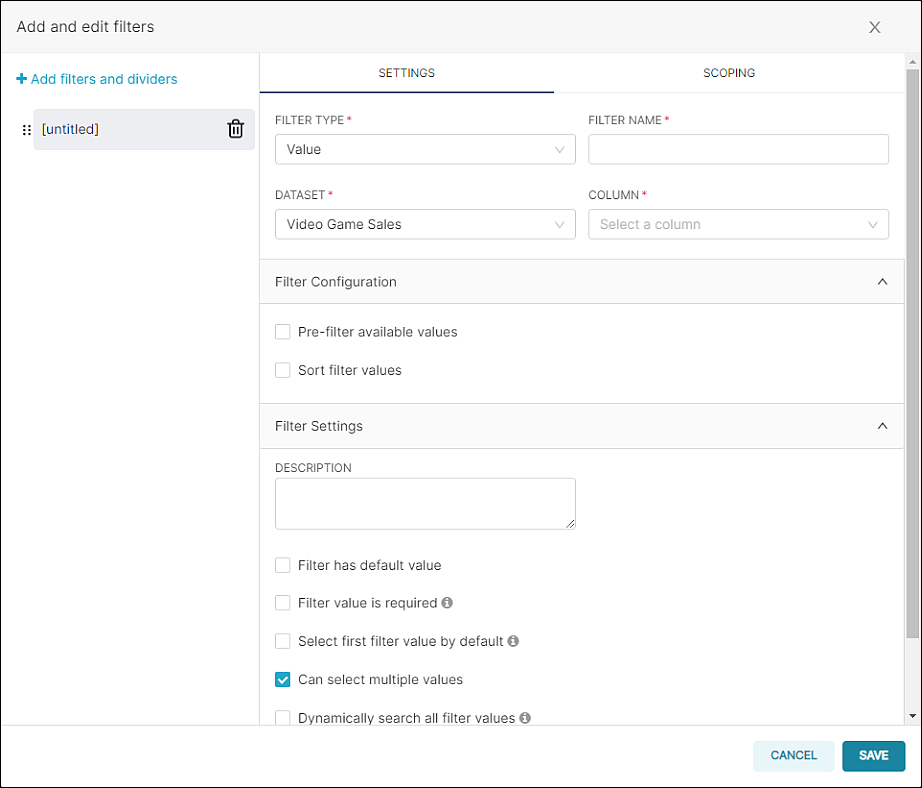
The first section is comprised of four required fields:
- Filter Type: Select a filter type; options include Value, Numerical range, Time range, Time column, and Time grain (see invididual descriptions below).
- Dataset: Select the dataset that should be used for the charts within the dashboard. By default, all datasets associated with the dashboard's charts will be available for selection. This field appears when either the Value, Numerical range, Time column, or Time grain filter types are selected.
- Filter Name: Enter a short descriptive name for the new filter. This is typically correlated to the selection made in the subsequent Column field.
- Column: Select a column that the filter should be applied to. This field appears when either the Value or Numerical range field types are selected.
Let's focus on the four available filter types from the Filter Type field.
Value Filter Type
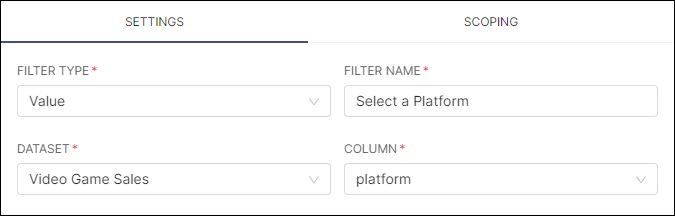
This filter type creates a drop-down menu populated by all available values associated with the selected column (Column field).
For example: If you select a Value filter type and then—in the Column field—you select Platform, then a drop-down filter menu appears on the dashboard that enables you to filter by platform. When applied, all charts within the dashboard will only display data as it relates to the selected "Platform" filter.
Here's what the configuration might look like:
...and the drop-down filter, titled "Select a Platform" from the Filter Name field, looks as follows:
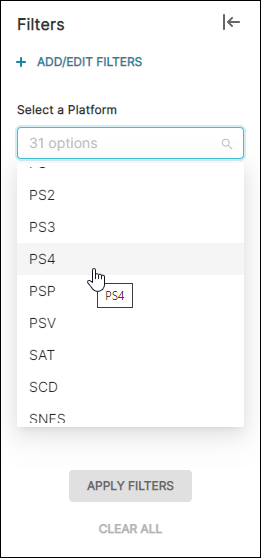
In the above example, we opted to filter by the PS4 platform.
To apply the filter, choose a value and then select Apply Filters. The charts within the dashboard will refresh and display the filtered data.
Numerical Range Filter Type
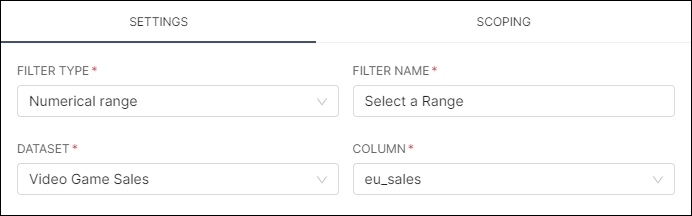
This filter type creates a range slider that enables you to specify a starting & ending point based on numerical values available from data in the selected column.
For example: If you select a Numerical range filter type and then—in the Column field—you select EU sales, then a range slider filter appears that enables you to select a starting & ending range. When applied, all charts within the dashboard will only display data as it relates to the selected sales range filter.
Here's what the configuration might look like:
...and the range slider filter, titled "Select a Range" from the Filter Name field, appears as follows:
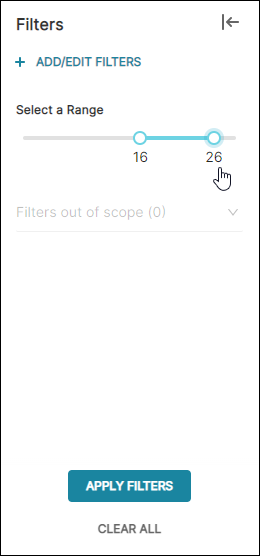
In the above example, we opted to specify a range from 16 to 26.
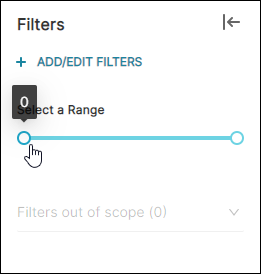
Note that you can view the minimum slider setting by hovering your cursor over the leftmost anchor point ("0" here):
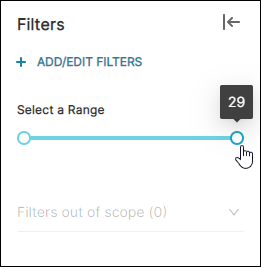
...and you can view the maximum slider setting by hovering your cursor over the rightmost anchor point ("29" here):
To apply the filter, define a numerical range and then select Apply Filters. The charts within the dashboard will refresh and display the filtered data.
Time Range Filter Type
This filter type creates a button filter that, when selected, launches Preset's Edit Time Range functionality. This is identical to the Time Range field used when creating a new chart.
For more information about how to edit a Time Range, please see Time Configurations.
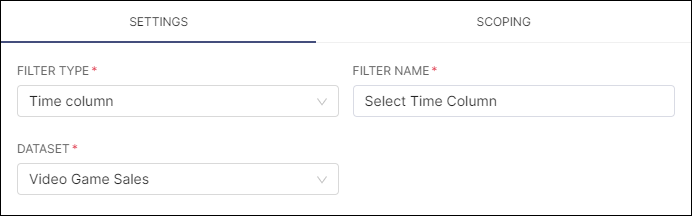
Here's what the configuration might look like:
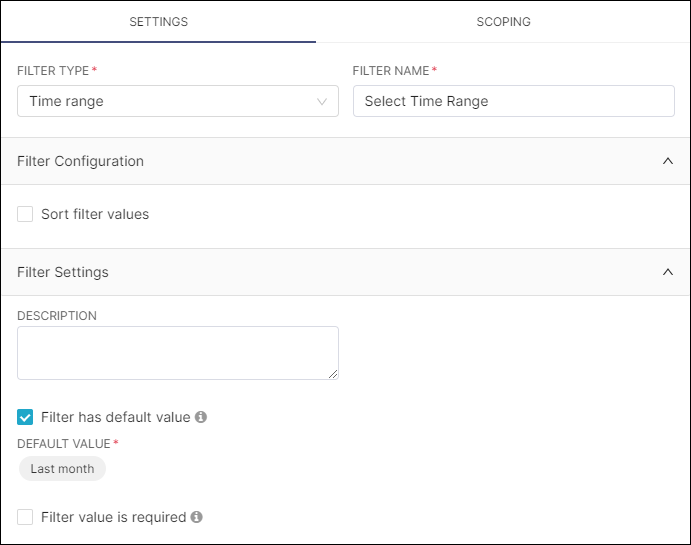
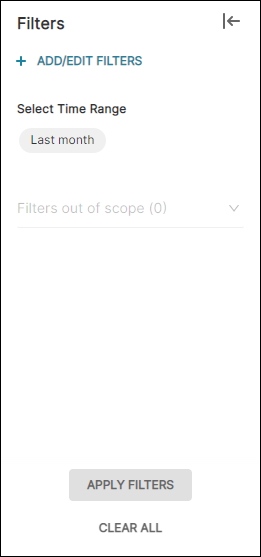
In this example, we specified a default value of "Last month" and defined a filter name of "Select Time Range".
This configuration would appear as follows:
To apply the filter, select and configure a time range, then select Apply Filters. The charts within the dashboard will refresh and display the filtered data.
Time Column Filter Type
This filter type creates a drop-down menu that enables you to select a new dashboard-level time column that will overwrite any existing time columns defined at the chart level.
When to use this filter type?
The Time Column filter type is best used when there are multiple time columns within the selected dataset. In many cases, there will be only one time column in a dataset (which is selected by default), negating the need for this filter type.
Here's what the configuration might look like:
...and the drop-down filter, titled "Select Time Column" from the Filter Name field, appears as follows:
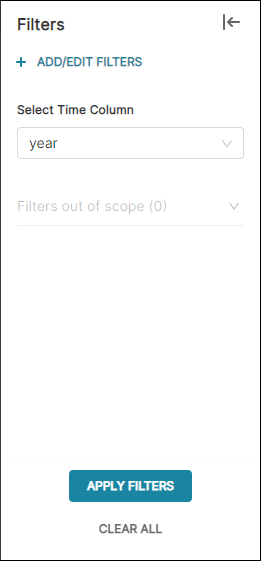
To apply the dashboard-level time column, select a time column options and then select Apply Filters. The charts within the dashboard will refresh and display the filtered data.
Time Grain Filter Type
This filter type creates a drop-down that enables you to select a time granularity. When applied, all timestamps are grouped based on the selected time grain.
Here's what the configuration might look like:
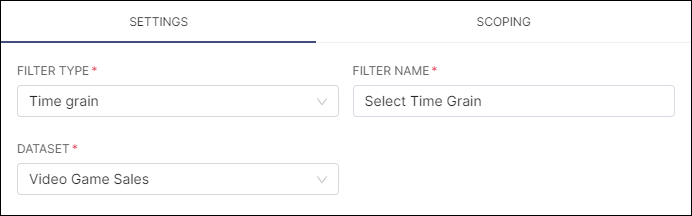
...and the drop-down filter, titled "Select Time Grain" from the Filter Name field, appears as follows:
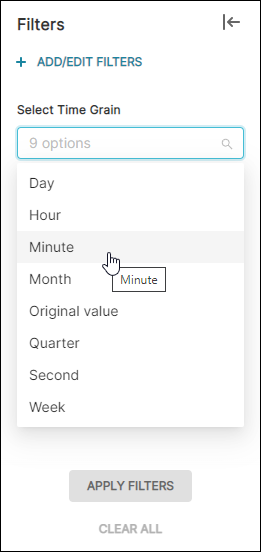
In the above example, we opted to specify a time grain of Minute.
To apply the dashboard-level time grain grouping, choose a time grain and then select Apply Filters. The charts within the dashboard will refresh and display the grouped data.
Related Topics
Dashboard Filtering
Filter Types
Parent-child Filter
Pre-filter Data
Sort Filter Values
Single Value Range
Filter Tooltip
Managing Values
Scoping a Filter
Cross-filtering
Managing Filters
Was this article helpful?