Introduction
In simple terms, a dashboard is a visual representation of multiple sets of data. In the world of Preset and Superset, a dashboard is a collection of charts. Dashboards have the unique capability to tell a story by combining different types of charts to form a narrative.
When used correctly, a dashboard can empower teams to present powerful data-based presentations as well as enable organizations to monitor information based on dynamic data.
Types of Dashboards
There are two types of dashboards:
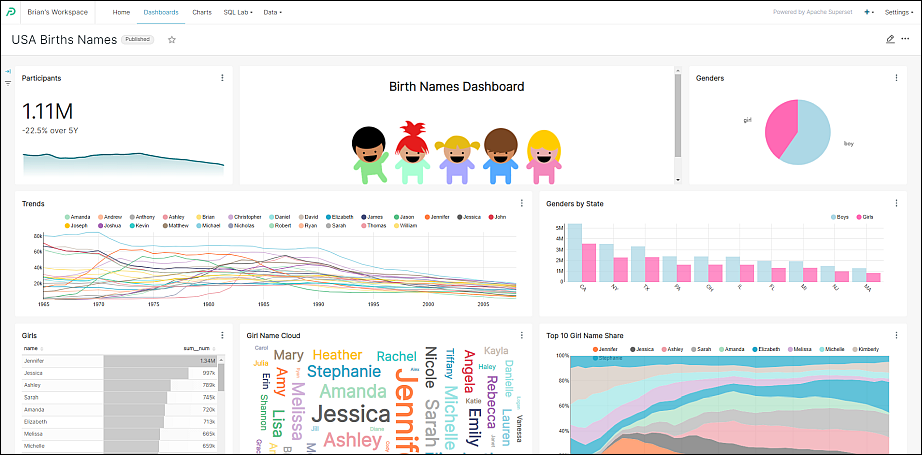
Narrative Dashboard: This type of dashboard is ideal for engaging, persuasive, and explanatory content. These dashboard types usually do not use KPIs or measurements but, rather, text or content-based data to provide information.
The following dashboard, which shows popular birth names in the U.S., uses primarily historical data and is an example of a narrative dashboard.
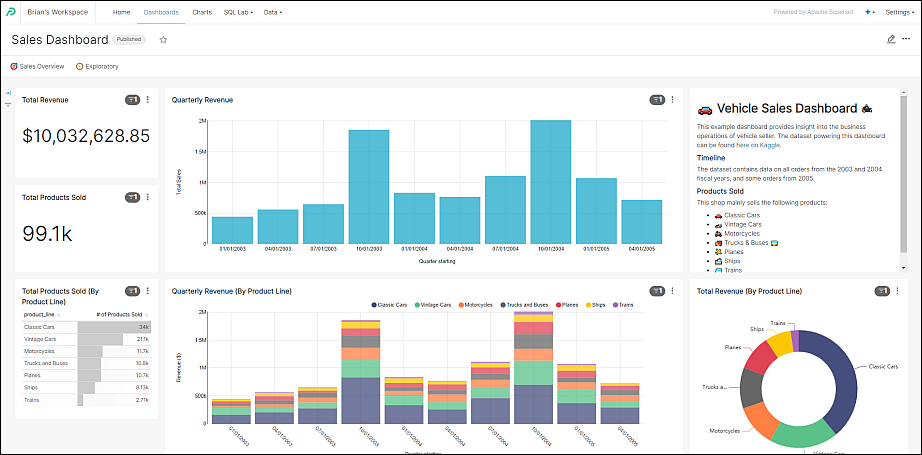
Metrics Dashboard: This type of dashboard is ideal for monitoring, performance analysis, browsing items, and canned analysis displays. It uses metrics, KPIs, and measurements that can all be filtered, enabling users to present different facets of information based on need.
The following dashboard shows vehicle sales data and uses metric-driven charts, such as bar charts, a table, and a pie chart, to convey quantitative data.
Dashboard Terminologies
- Data: Supported by facts.
- Analytics: Computation of data points for discovery.
- Performance: Monitoring of trends or relationships.
- KPI: Key progress indicators.
- Metrics: Numeric aggregations and associations.
Use Case Scenarios
| Dashboard | Goal |
|---|---|
| Monitoring | • Display of actual data to discover abnormalities. • Reactive decision-making. • Frequent review of updated data. • Focus on business users that understand the data. |
| Performance | • Show progress towards defined goals. • Proactive decision-making. • Review at intervals. |
| Item Browsing | • Show item-specific data. • Go to level details. • Used to support Monitoring and Canned Analysis dashboards. |
| Canned Analysis | • Complex analytics conveyed in a visual format to consumers. • Purpose is to convey meaningful insights. |
| Static Display | • Used to persuade a target audience to adopt a point of view. • Enables an audience to see a deeper level of detail. • Generate awareness of data. |