
June 25, 2025
New Features
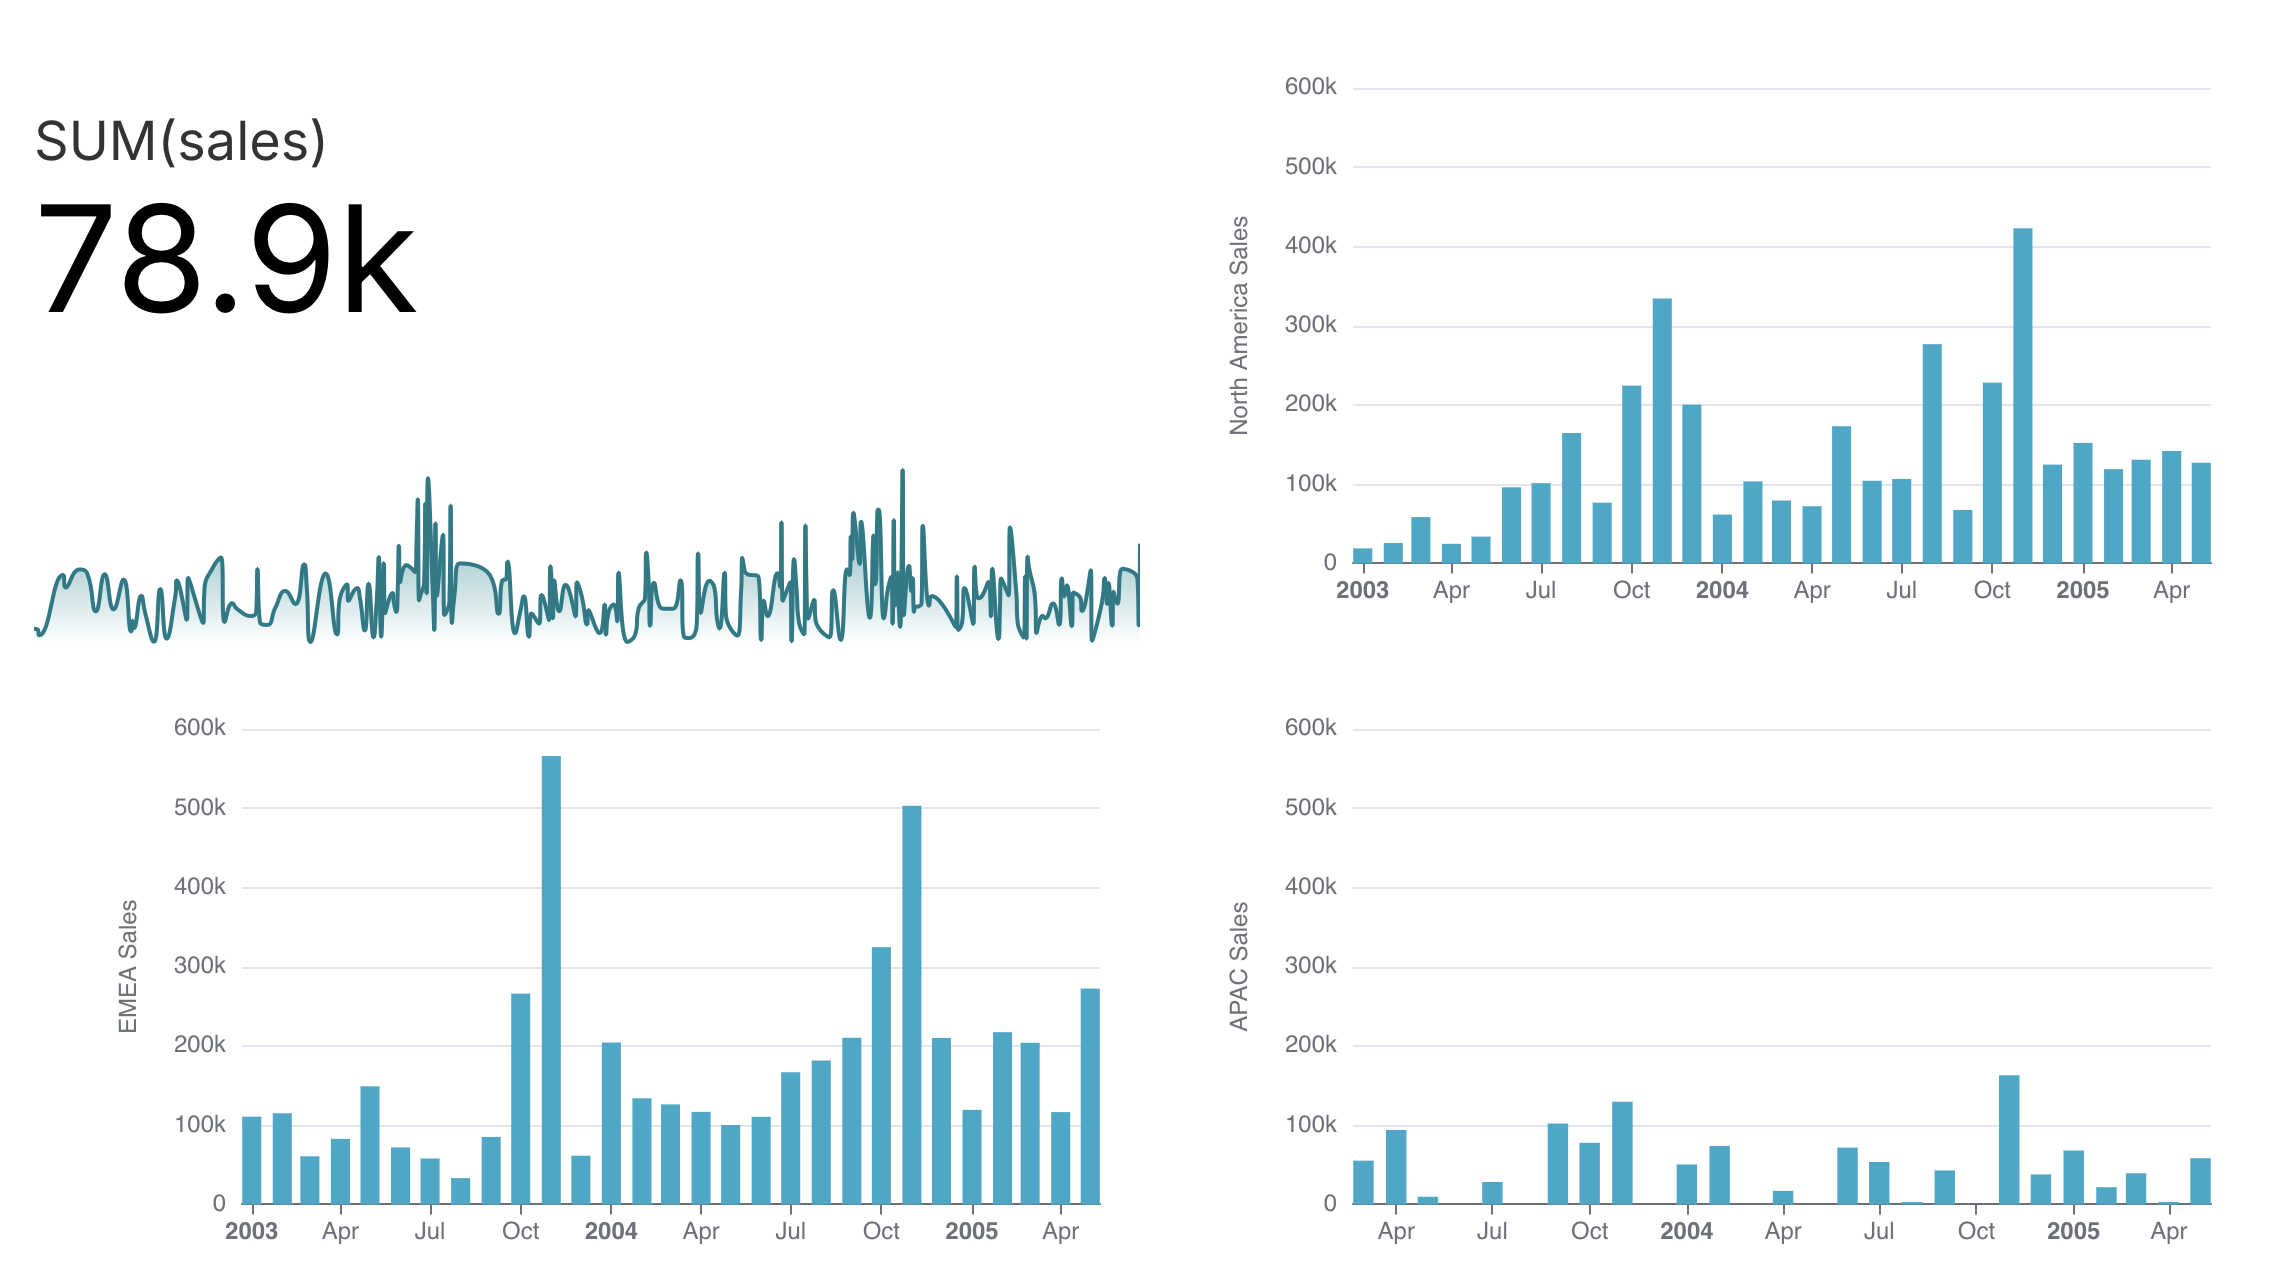
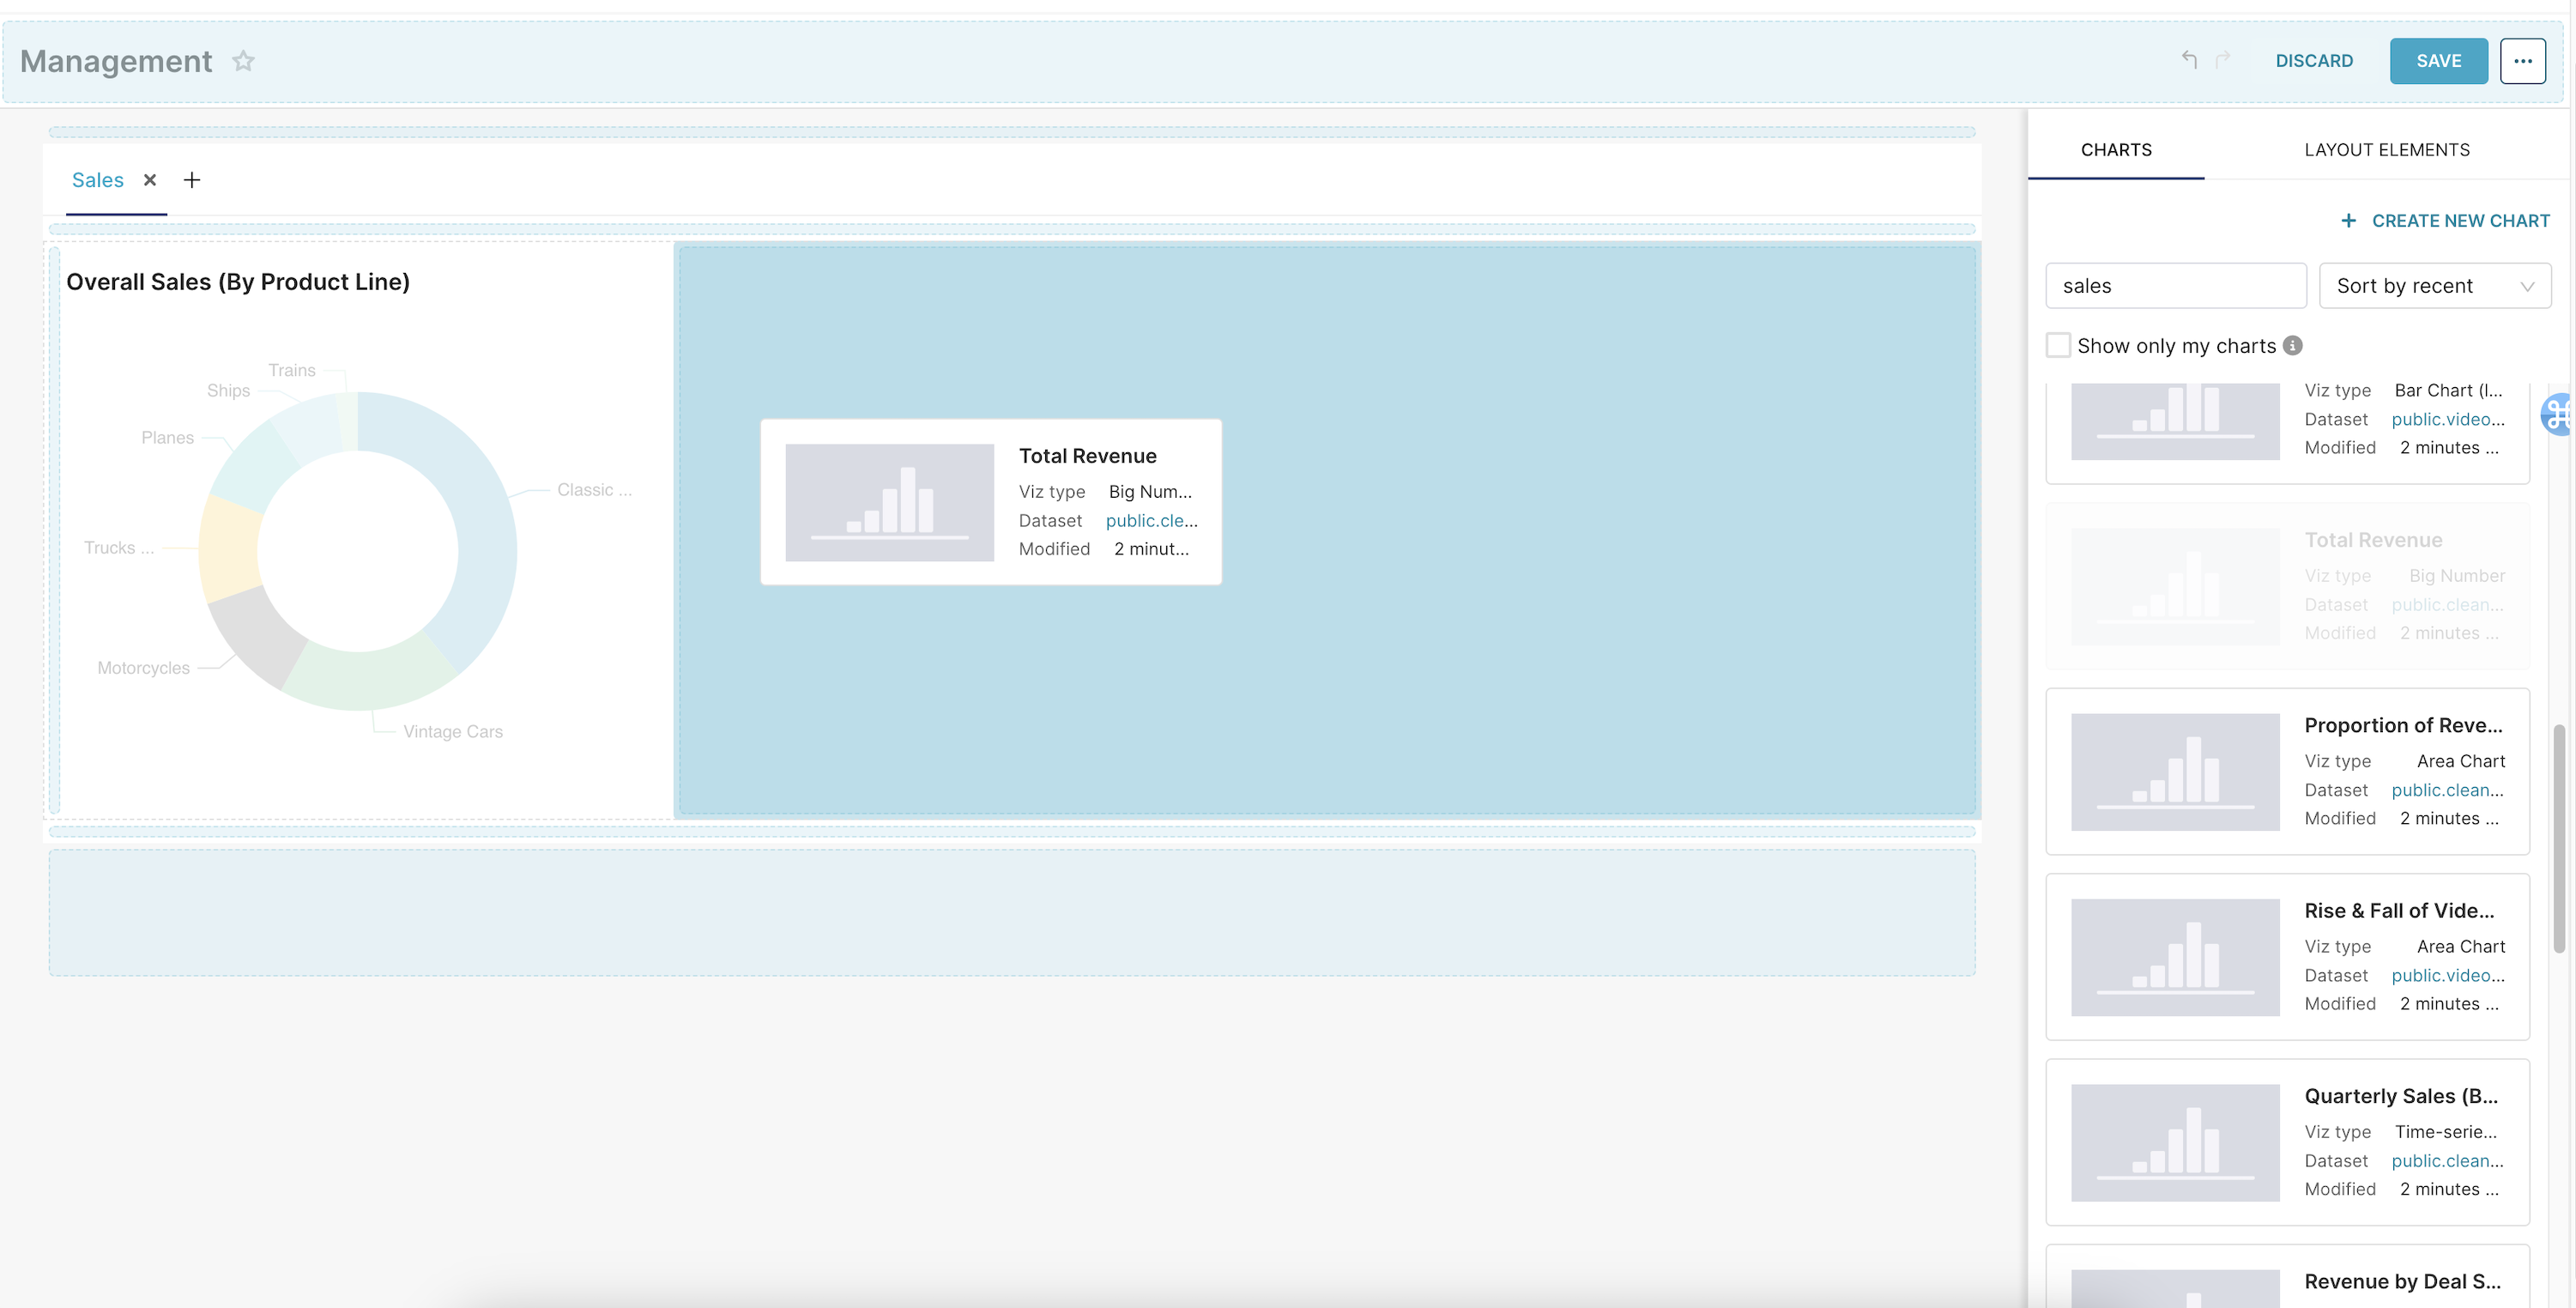
- (Charts) New Multiple Charts Layout chart type allows you to add up to 4 existing charts into a single chart
- (Dashboards) Added a "previous calendar quarter" option in time filters
- (Charts) New "Format SQL" and "View in SQL Lab" buttons added to View query modals to more easily understand the SQL that powers your charts
- (Charts) Added Percentage metric calculation field in Table charts with options "Row limit" and "All records"
- (Charts) Added control for X-axis label intervals, allowing you to display some data points ("auto") or all ticks, which is useful for categorical charts
- (Datasets) Added support for keyboard shortcut to the dataset SQL editor field
- (Datasets) Added "Run in SQL Lab" button for virtual datasets
- (Datasets) Added a new
macro {{ current_user_rls_rules()}} to return a list of all RLS rules applied for the user in the current dataset
- (Permissions) Added a new Visualization Contributor workspace role who can create charts and datasets, but does not have access to SQL Lab or dataset creation. Please reach out to support@preset.io if you're interested in using this workspace role.
- (Workspaces) Added the option to create a new workspace without including example dashboards, charts, datasets, and database
Enhancements and Fixes
- (Dashboards) Fixed an issue where the "Apply" button in native filters wasn't always available after using the "Clear All" option
- (Dashboards) Fixed an issue where the date picker could sometimes appear behind other modals
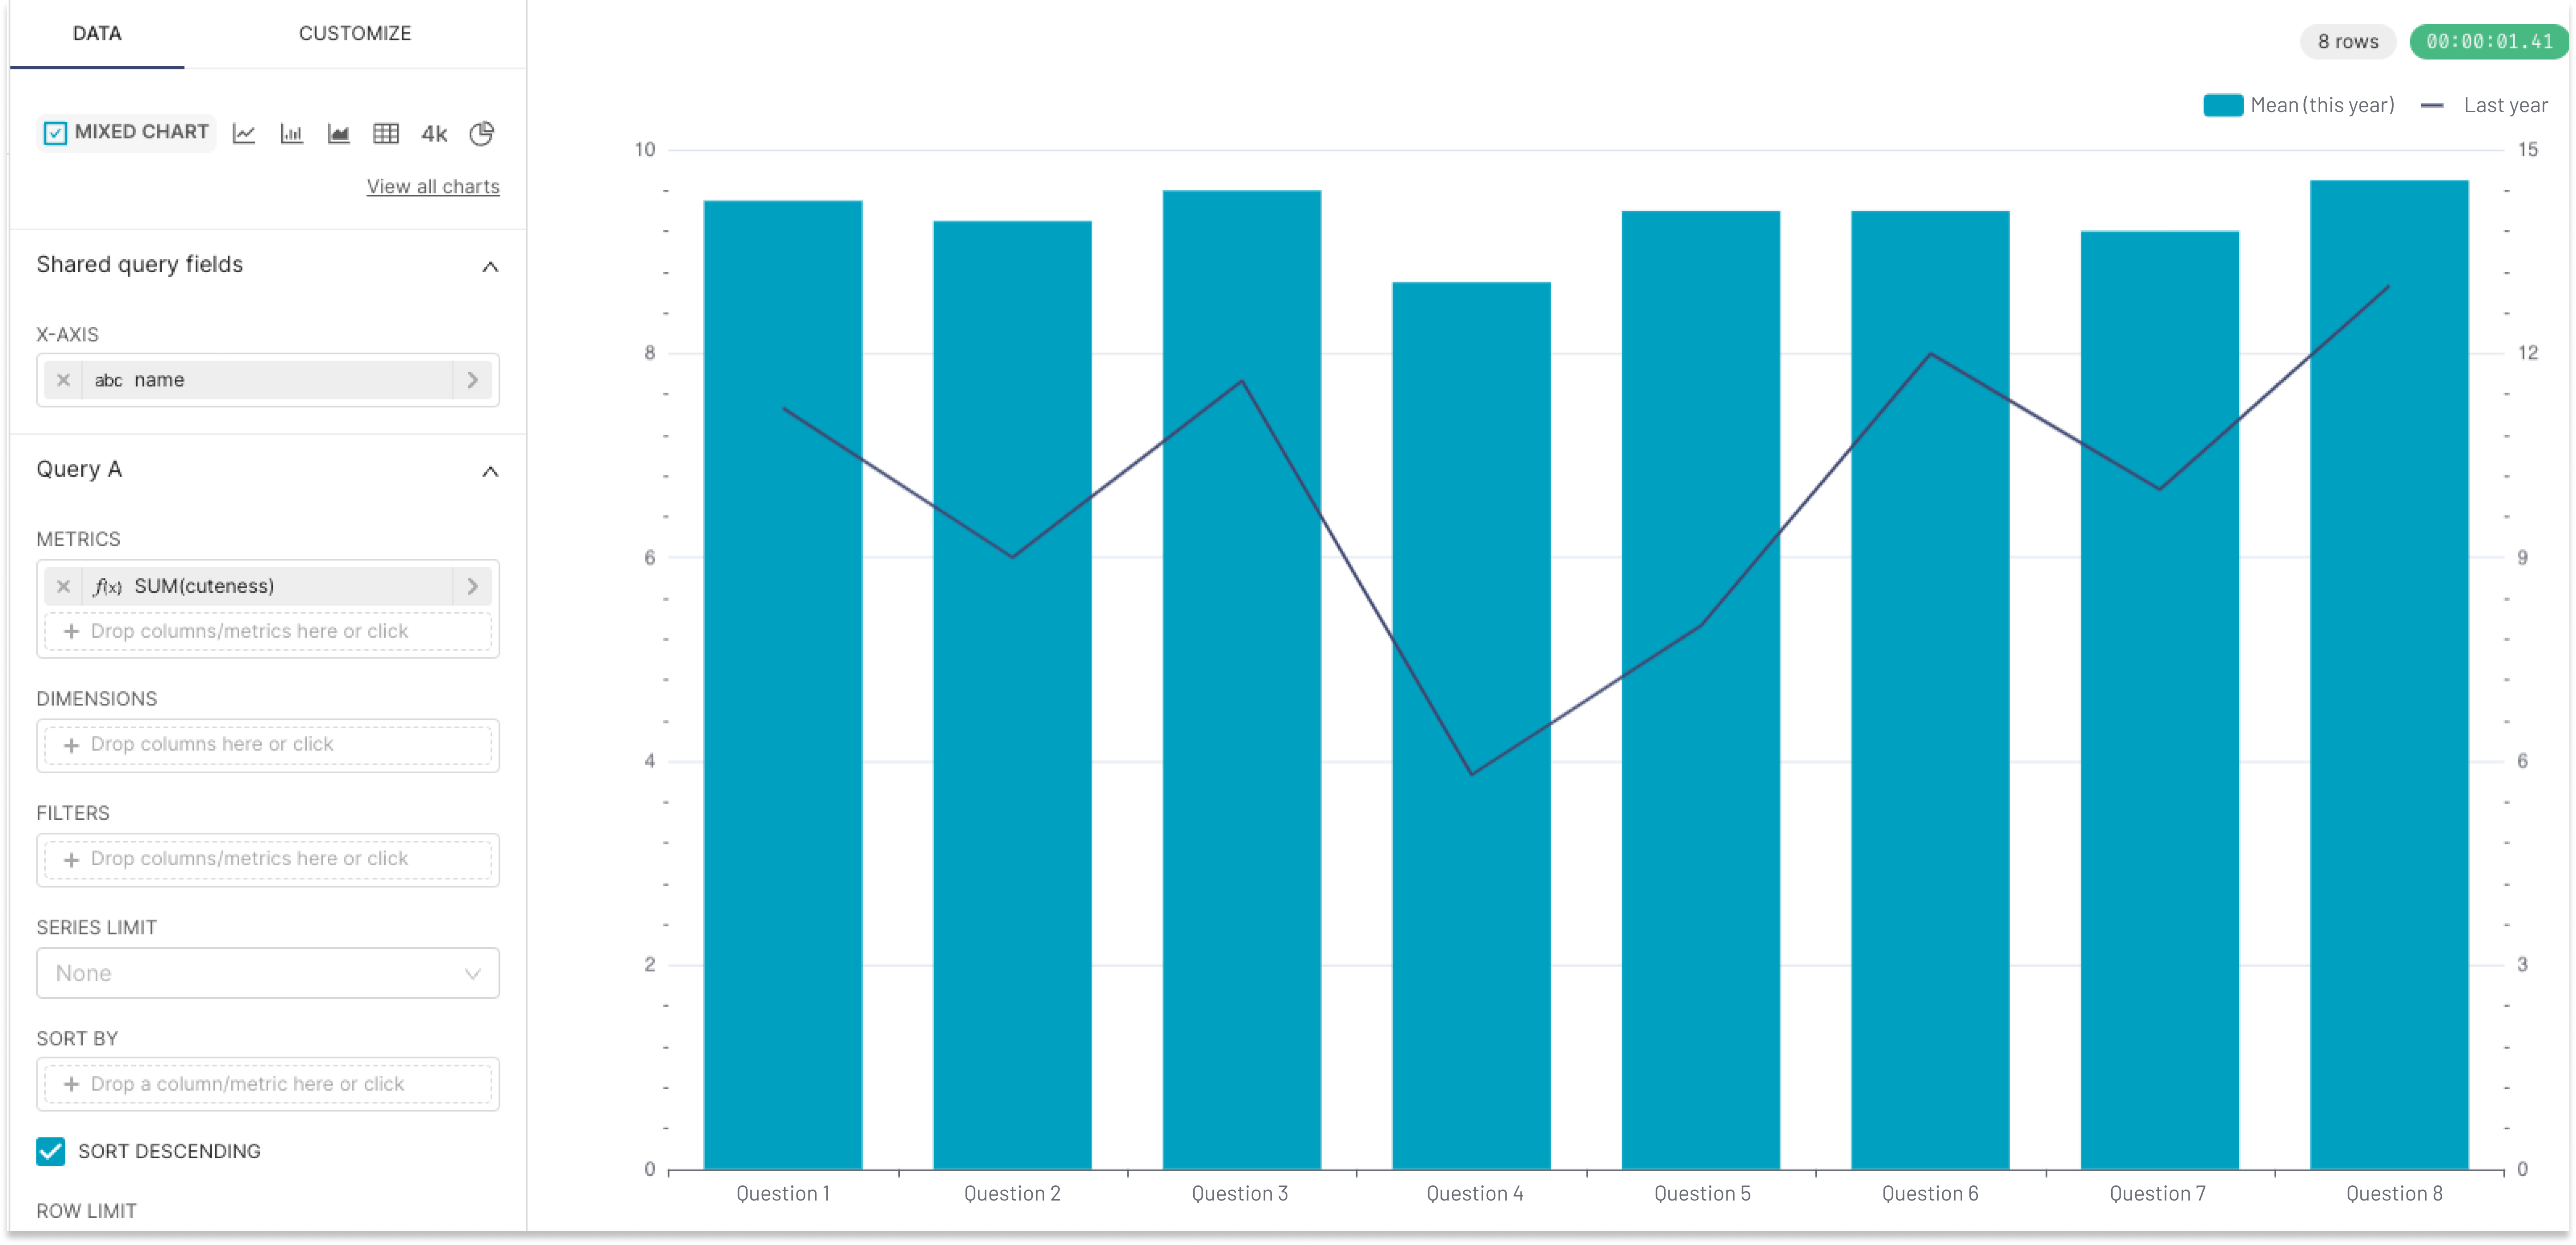
- (Charts) Added Query A and Query B labels to tooltips in Mixed Charts
- (Charts) Introduced a "None" aggregation option for Big Number with Trendline charts
- (Charts) Big Number with Trendline charts that use aggregation are now correctly comparing to the last data point
- (Charts) Fixed an issue where navigating to a chart from a dashboard, then saving the chart, would incorrectly set the time filter to "No filter" and not allow it to be overwritten
- (Charts) Ensured that deck.gl Scatterplot colors are consistent between charts and dashboards
- (Charts) Applied proper D3 formatting to Big Number chart metrics
- (Charts) Resolved an issue where selecting an item from the second page of a line chart legend would redirect to the first page
- (Datasets) Prevented a duplicate metric error that could occur when editing SQL in a dataset and then trying to add a new metric
- (Datasets) Updated the copy in the messages confirming the addition of columns to virtual datasets
- (Datasets) Ensured that a dataset's last modified date is correctly updated when changes are made to its columns or metrics
- (Datasets) Stopped the automatic conversion of a dataset's last modified timestamp to UTC, which was causing display inconsistencies for datasets that were modified before the change
- (Datasets) Corrected an issue related to currency displays
- (SQL Lab) Fixed an issue with saving datasets in SQL Lab that include template parameters
- (Databases) Updated error code to 400 when we fail to connect to a database
- (Databases) Added the ability to connect to a Postgres instance deployed in GCP with SSL enforced
- (Databases) Fixed an issue with Snowflake MAP types
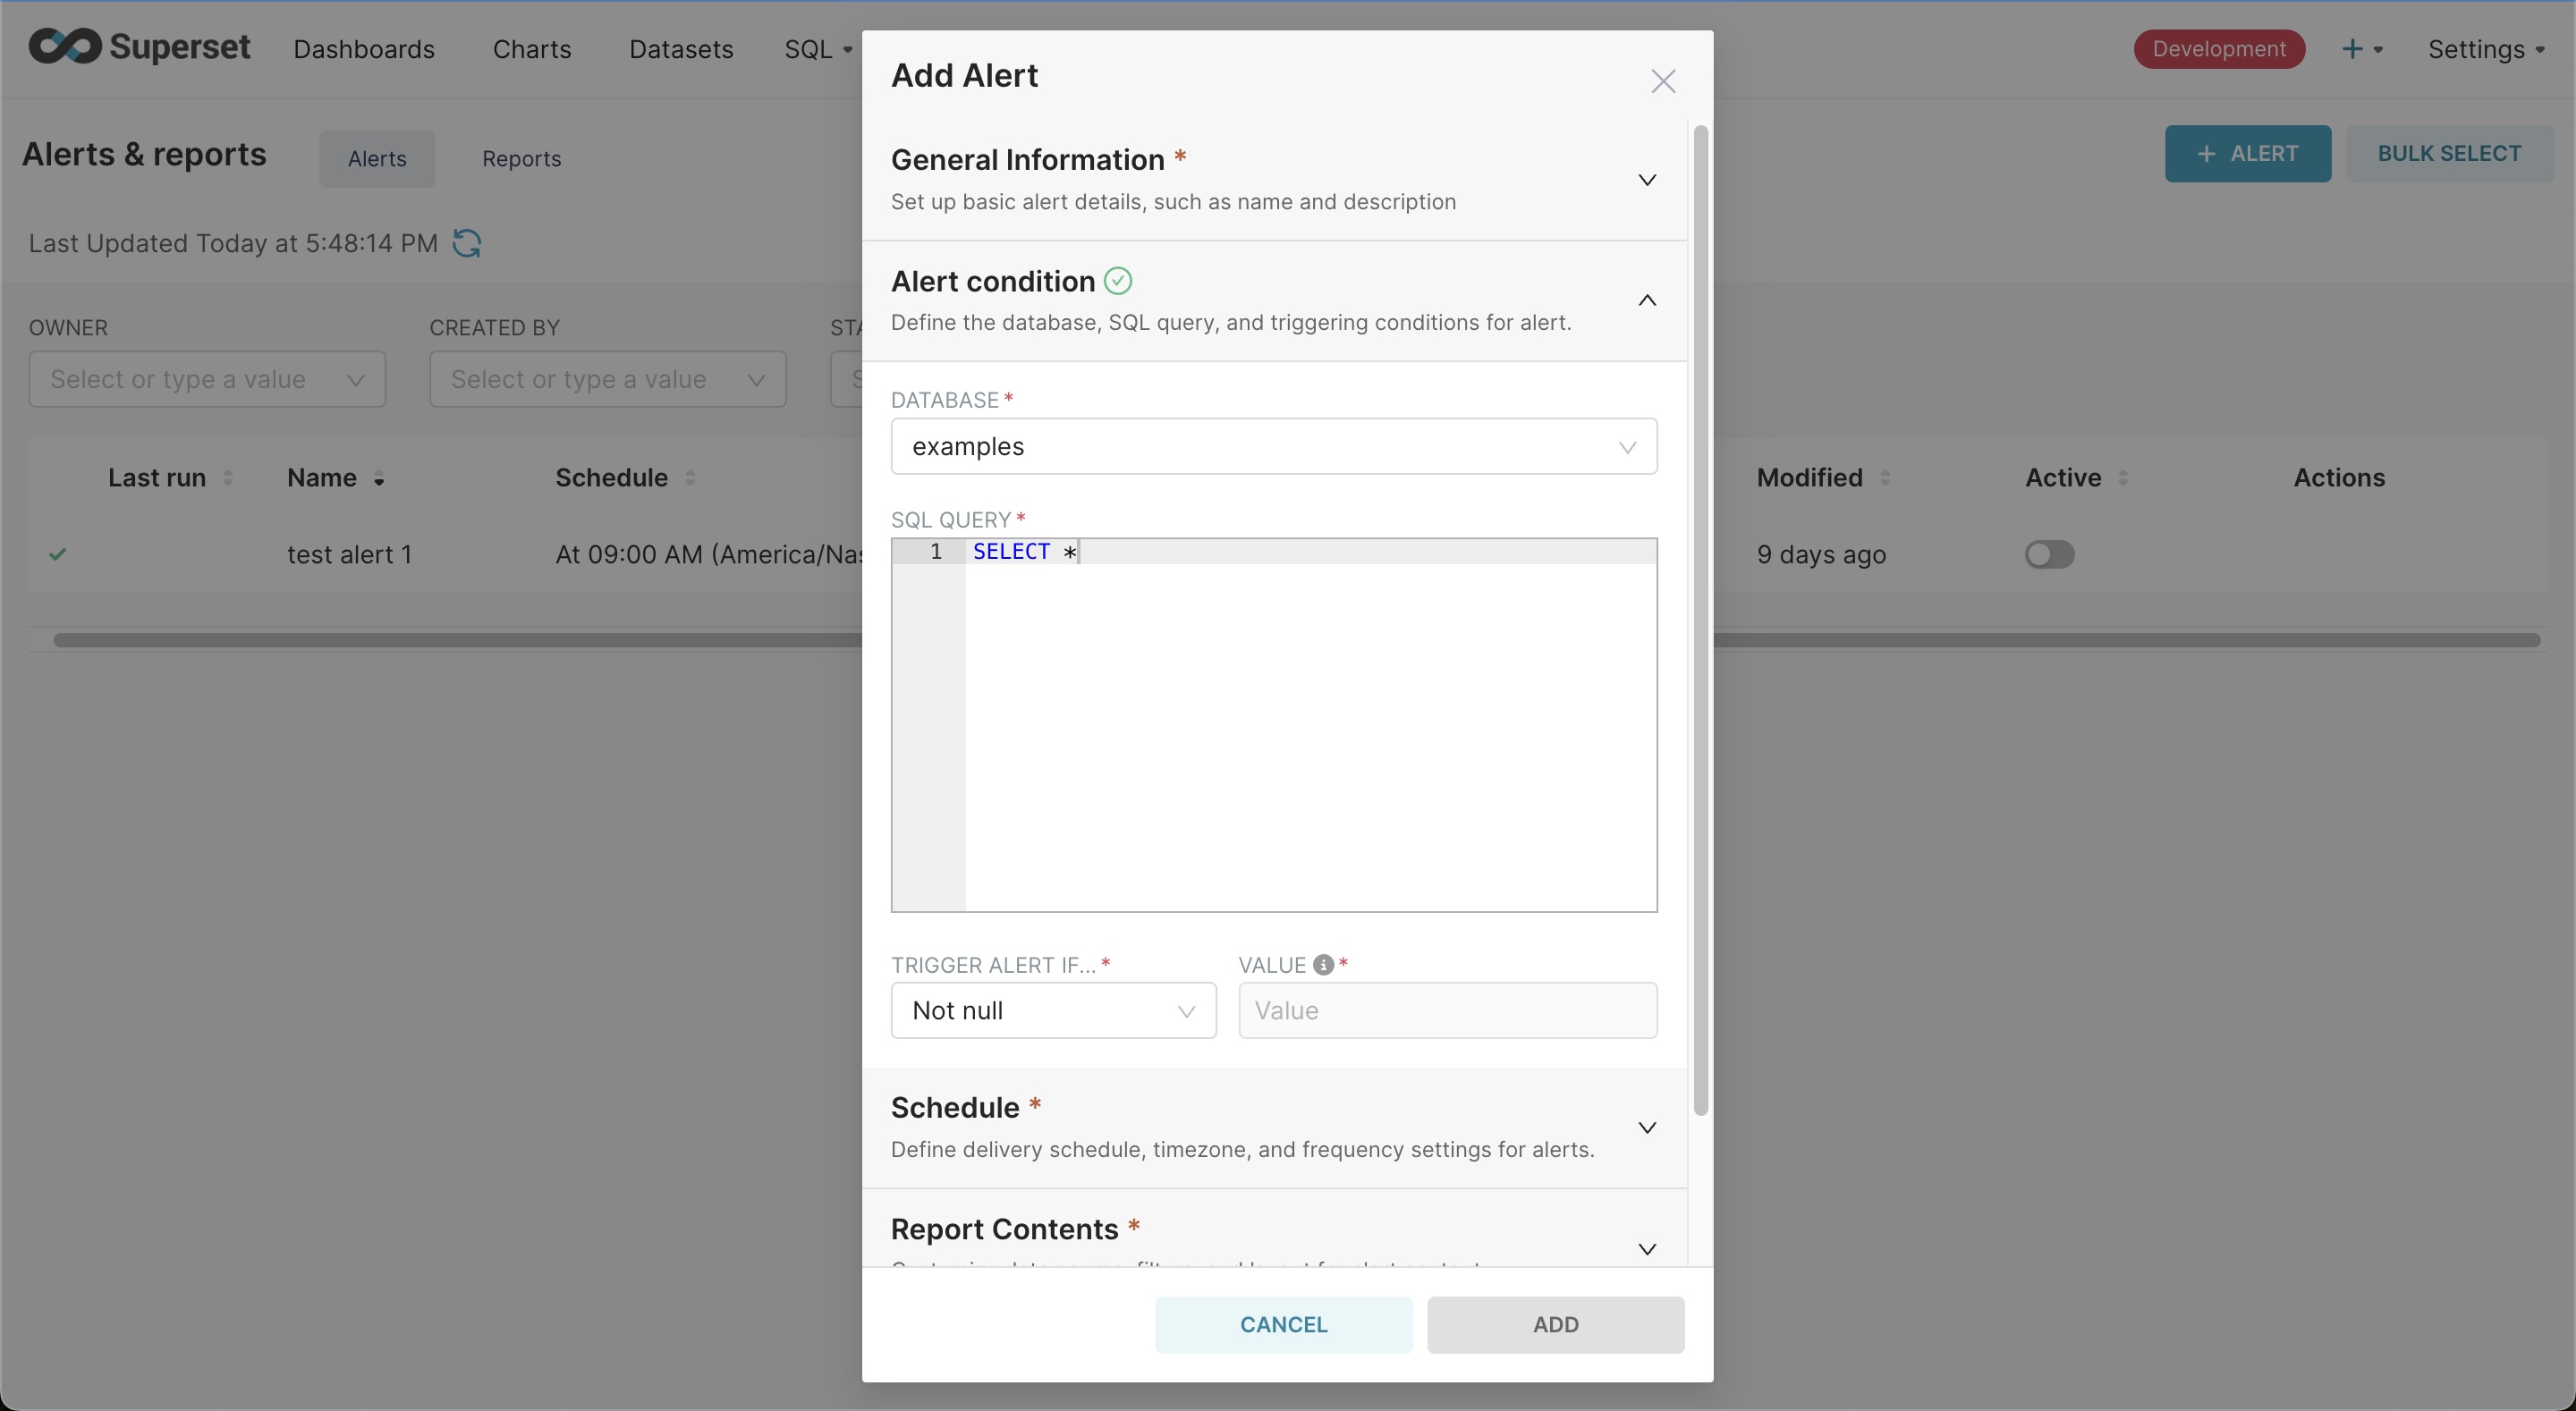
- (Alerts & Reports) Fixed a problem with how the "last updated" time was displayed for Alerts & Reports
- (Home) Fixed an error where we were unable to load favorites on the home page for some users
- (Permissions) Fixed an issue where the Data Access Roles page would sometimes freeze
- (Accessibility) Improved keyboard navigation and screen reader access throughout the app
May 15, 2025
New Features
- (Datasets) Run and test SQL queries from within the dataset editor
- (ECharts) Allows sorting the X axis by a particular/selected metric when more than one metric is present
- (Big Number Chart) Adds support for displaying metric name
Enhancements and Fixes
-
(Embedded) Improved chart loading and display performance
-
(Datasets) Improved reliability of catalogs when using dataset editor
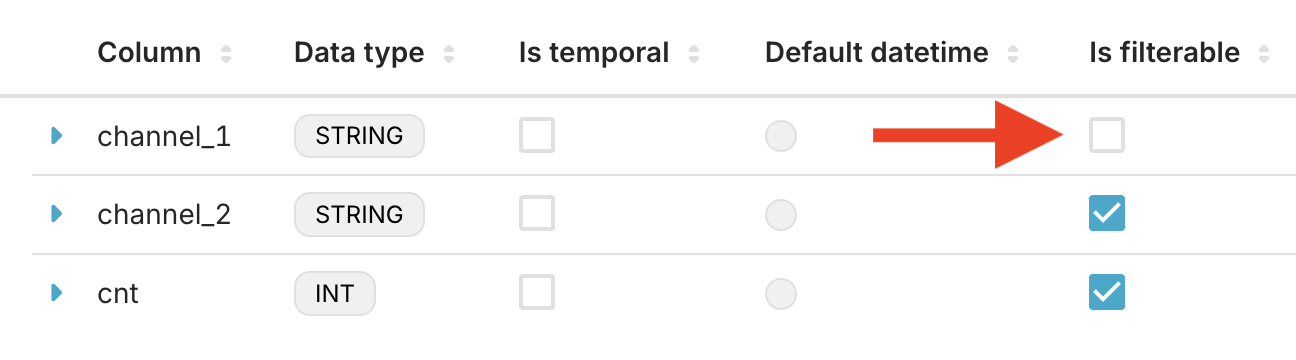
-
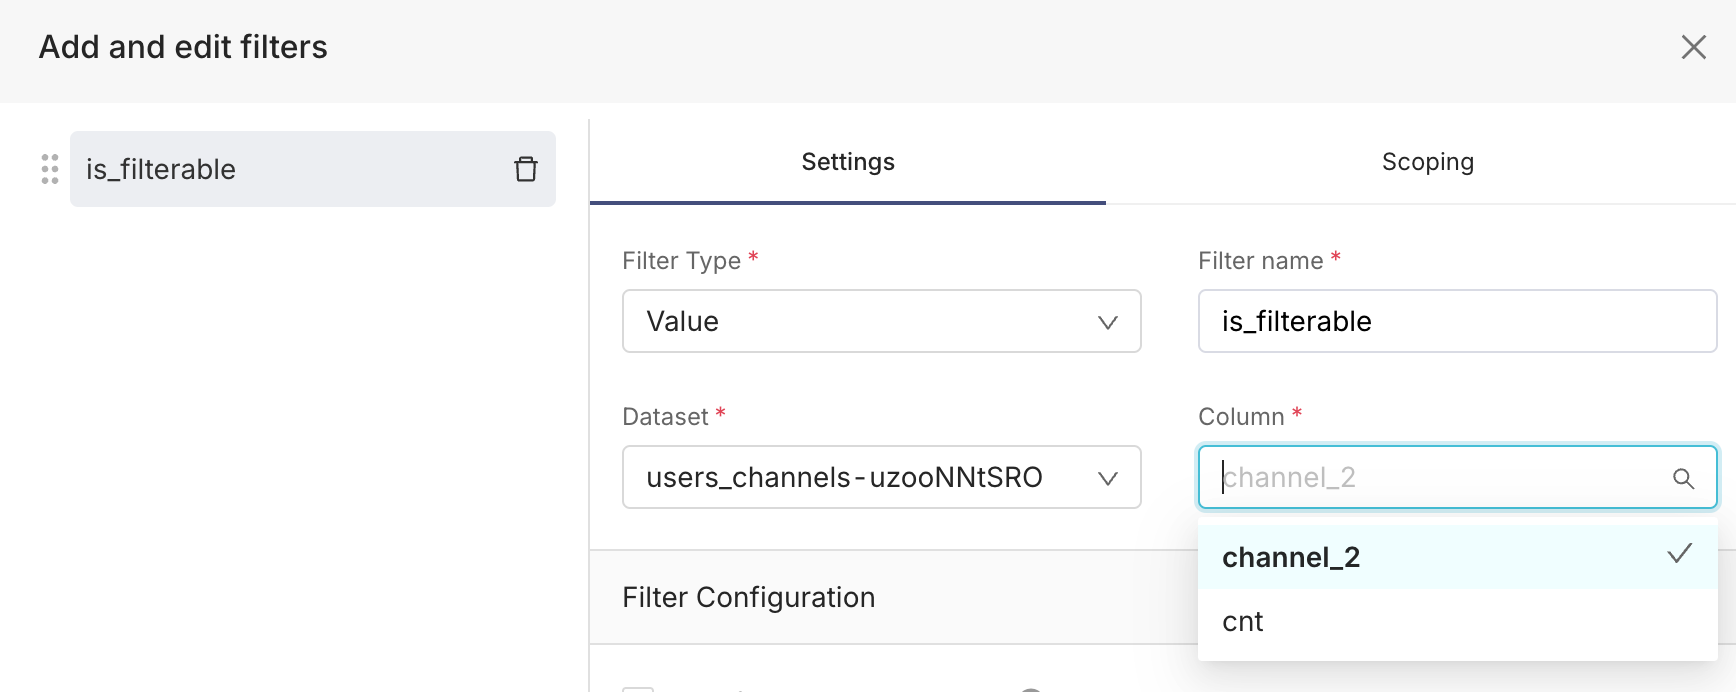
(Dashboards) Filters can only be added for columns marked as filterable in the dataset editor
-
(SQL) More reliable detection of invalid SQL functions
Apr 28, 2025
New Features
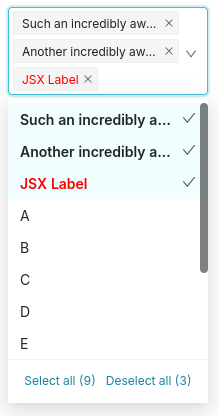
- (Dashboards) Filters now have a Select/Deselect All button that selects or deselects all visible options when searching.
Enhancements and Fixes
- (Dashboards) Improved reliability of standalone mode with certain URL parameter combinations
Apr 18, 2025
New Features
- (Datasets) Added dataset folders API
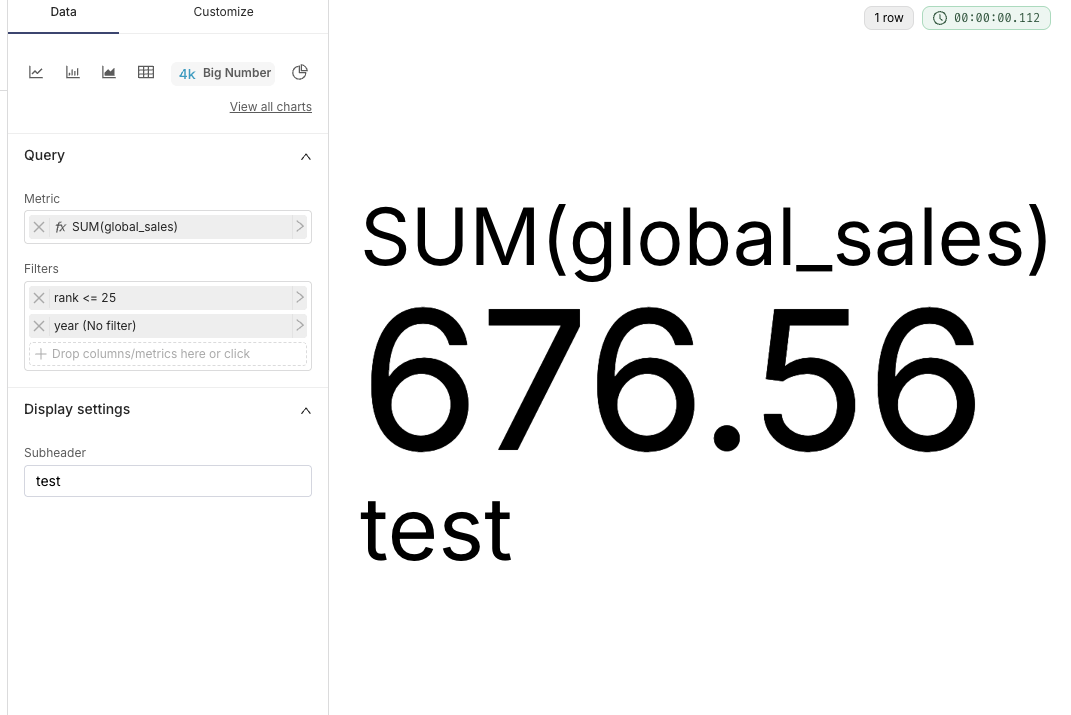
- (Charts) Added subtitle option and metric customization controls to Big Number charts
Enhancements and Fixes
- (Databases) Performance enhancements for catalog permission syncronization
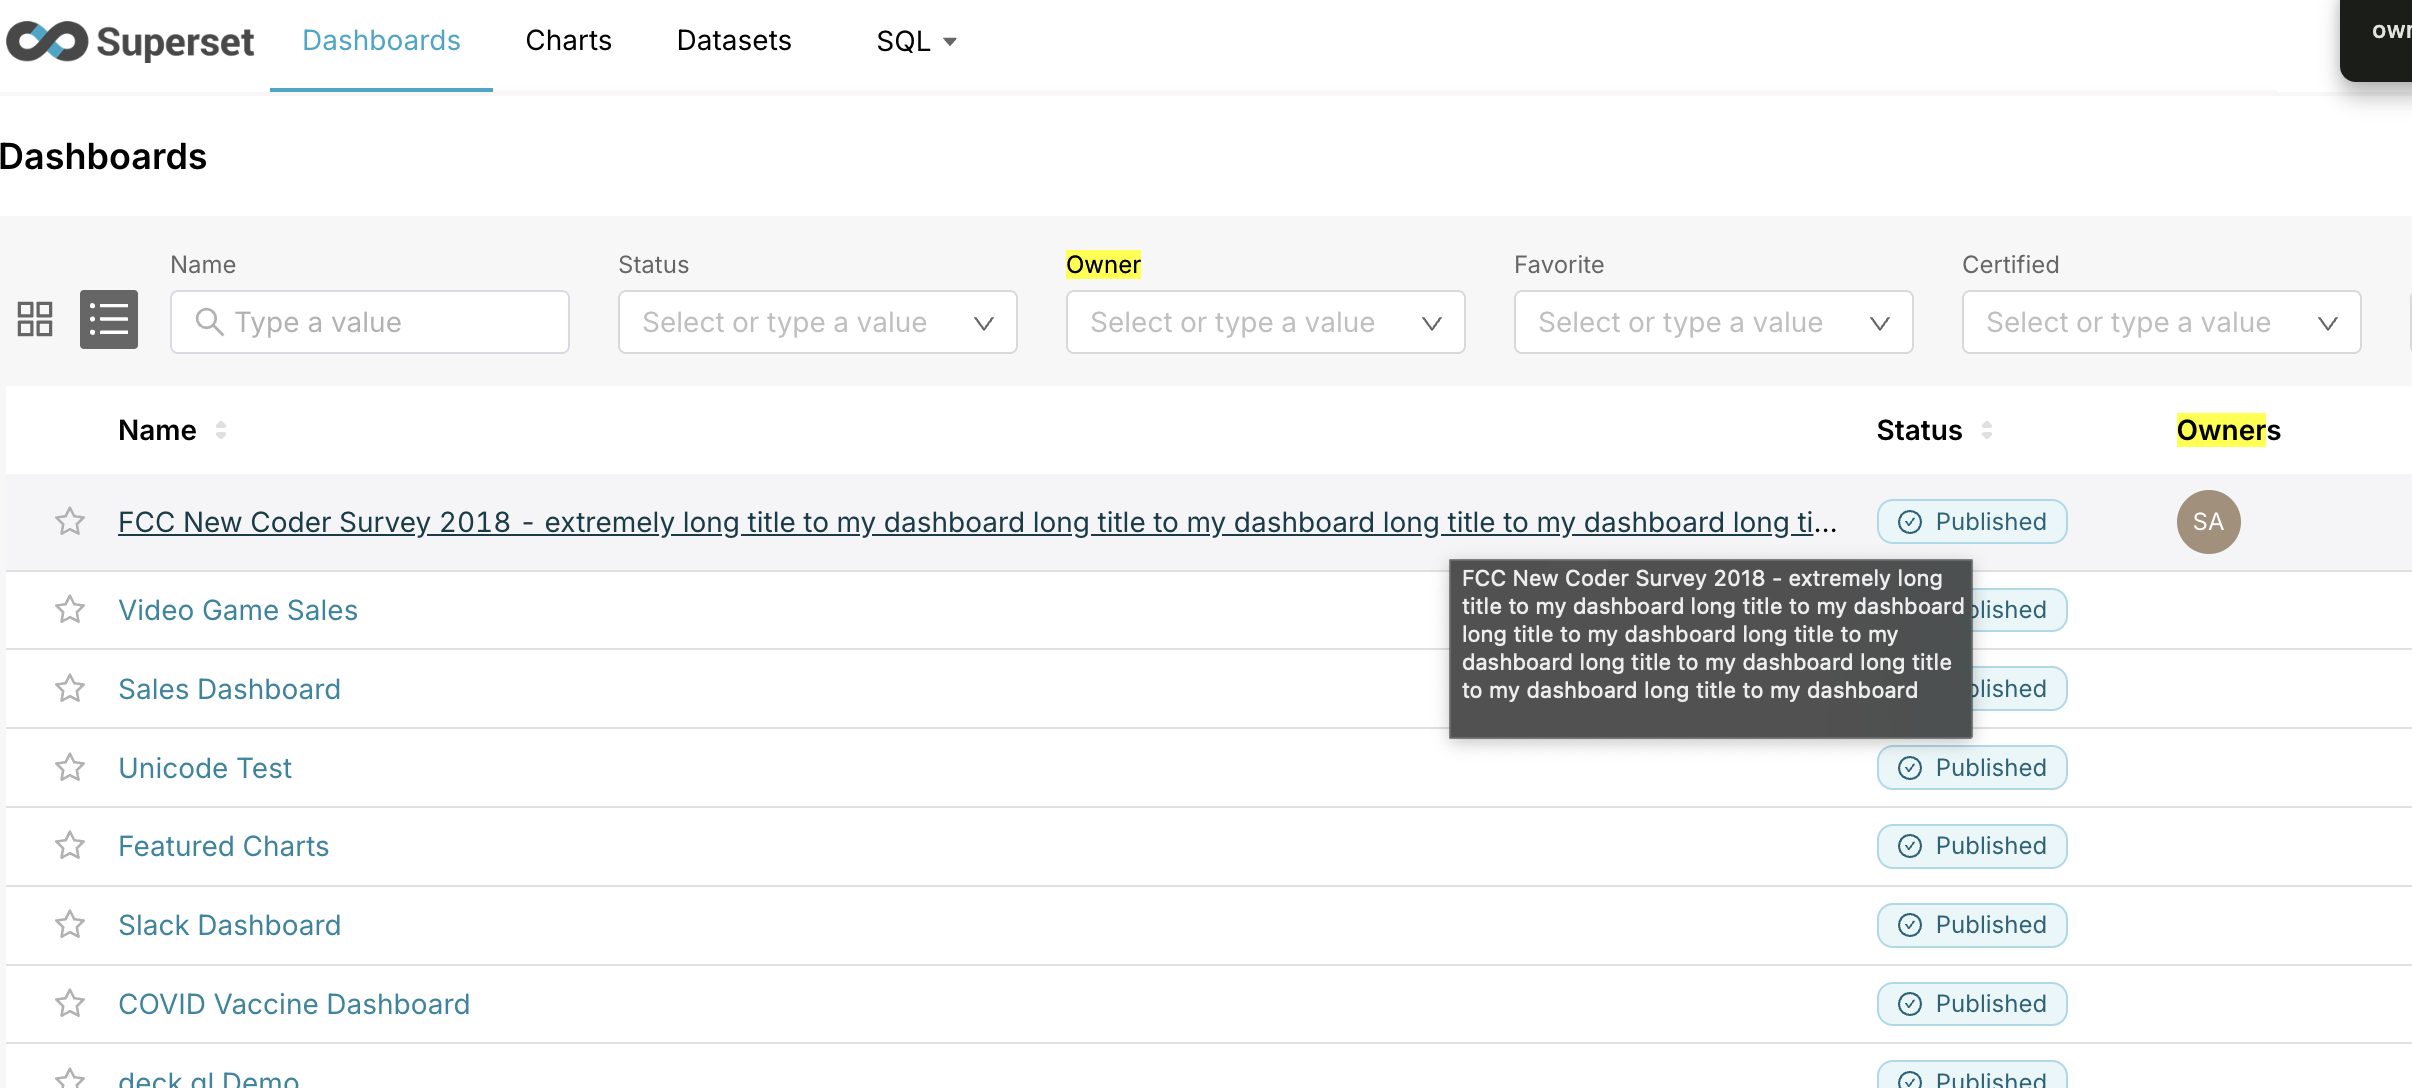
- (List Views) Better support for long titles with truncation and tooltip
- (Interactive Table) Time comparison is now only applied to metrics
- (Databases) Improved reliability when editing OAuth2 credentials in database connections
- (Import/Export) Add folders to import schema
- (Dashboard) Improved reliability of scoping filters within nested tabs
Apr 10, 2025
New Features
- (Charts) Adding a new %d.%m.%y time format option for charts
- (SQL Lab) Adds support for querying latest partition in BigQuery
Enhancements and Fixes
- (Dashboards) Fixes an issue with Chart CSV exports from dashboards
- (Dashboards) Fixes issues when entering full screen mode on dashboards
- (Embedded) Fixes the
show_filtersURL param when passed to embedded dashboards - Other various bug fixes and improvements
Apr 07, 2025
New Features
-
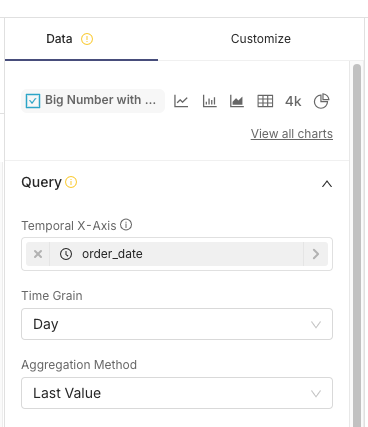
(Charts): Adds Aggregation Method for Big Number with Trendline (e.g. SUM, AVG, MIN, MAX, MEDIAN, and LAST_VALUE)
-
(Databases) YDB Support: Introduced support for YDB as a new database engine.
-
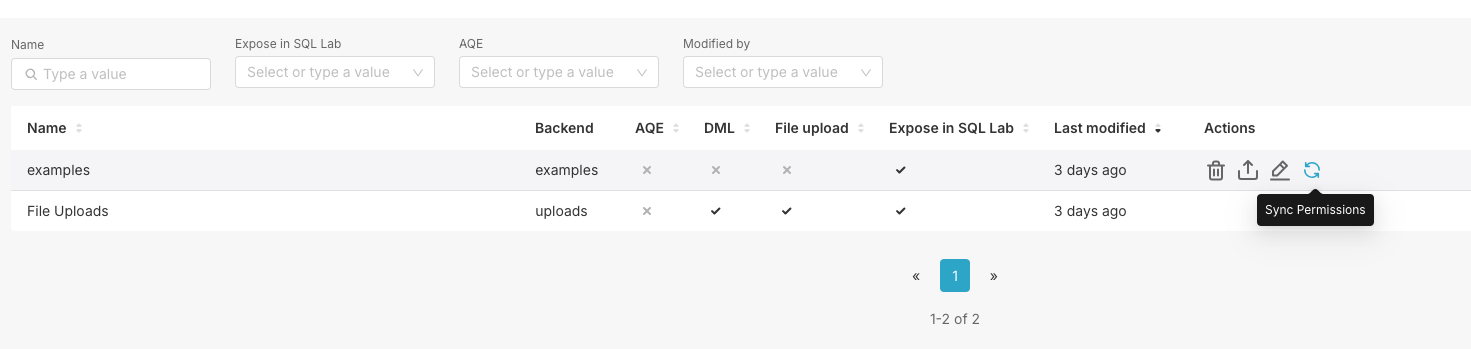
(Databases) It’s now possible to sync permissions for a given database connection, to reflect new schemas/tables/etc in Data Access Roles (gradual rollout since March — now fully available).
-
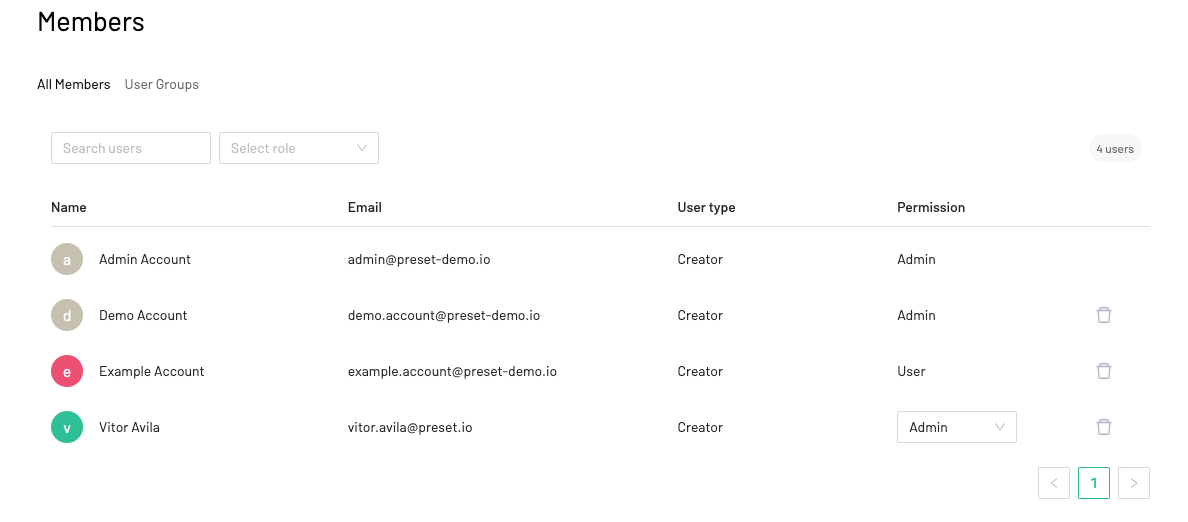
(Preset Manager) It’s now possible to search for users in the Team and Workspace Administration by email, and also filter by role (gradual rollout since March — now fully available).
### Enhancements and Fixes
-
(API): UUIDs have been added to list API calls for better identification.
-
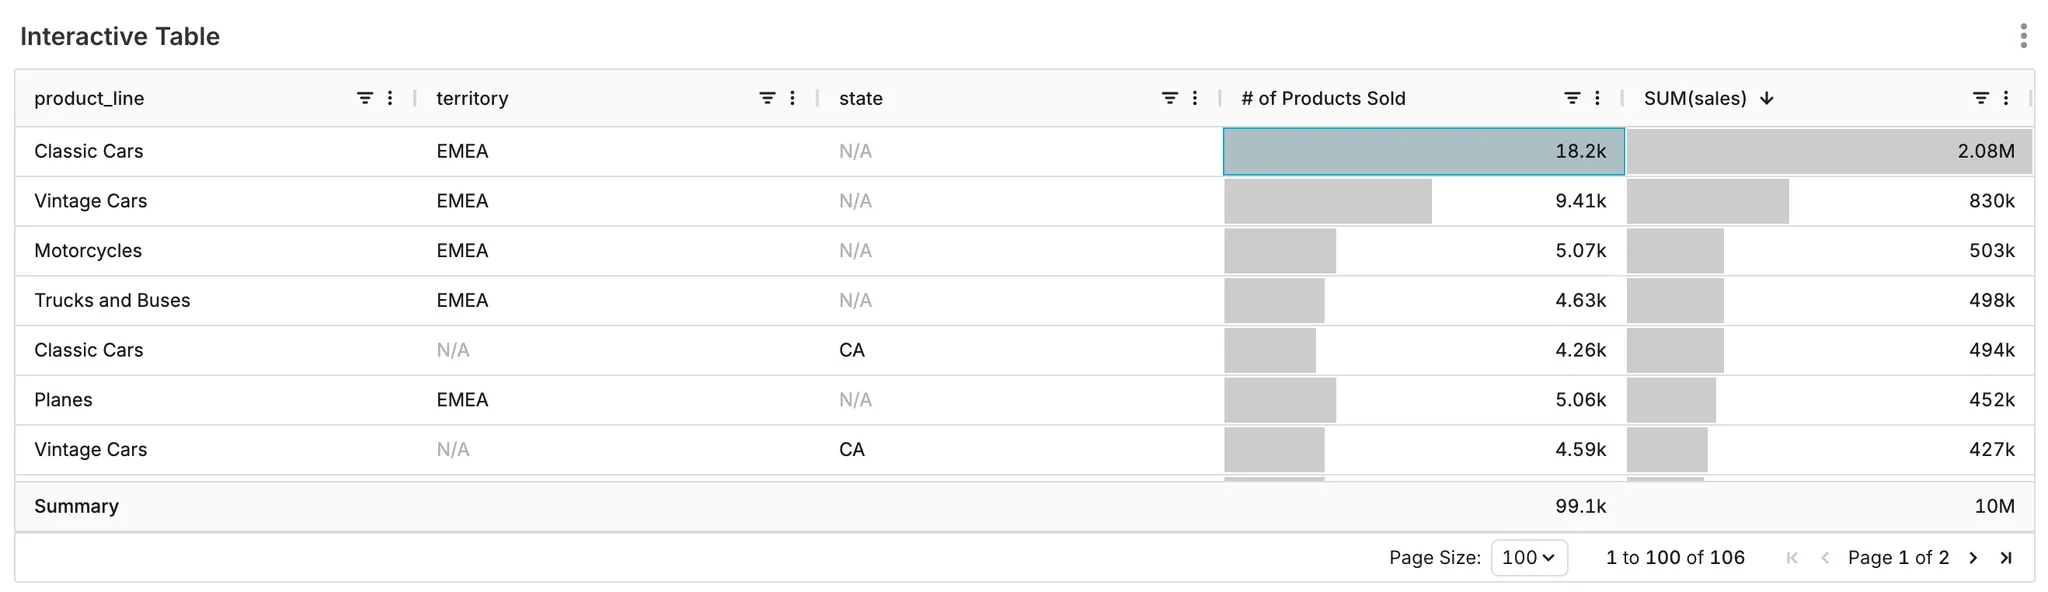
(Charts): Interactive Table now displays the verbose metric name if entered.
-
(Charts): Table chart comparison columns configuration is hidden when time_compare is empty
-
(Dashboards): Permalinks can now be passed to the cache_dashboard_screenshot endpoint.
-
(Datasets): The file uploads dialog now displays only allowed schemas.
-
(Databases): Datasets and queries are now updated automatically when database connections change.
-
(Embedded) Set a specific referrerPolicy for iframe requests to improve security.
-
(SQL Lab) Added a to_datetime Jinja filter for enhanced date-time manipulations.
-
(SQL Lab) Introduced Jinja macro current_user_roles() macro to retrieve roles of the current user.
-
Other various bug fixes and improvements
Mar 21, 2025
- (Databases) Fixes issues connecting to private Google Sheets
- (SQL Lab) Fixes a bug where calculated columns may be duplicated when syncing columns
- Other various bug fixes and improvements
Mar 12, 2025
- (Alerts/Reports) Fixes an issue with adding correct file extensions on attachments sent to Slack.
- (SQL Lab) Fixes an issue with clearing schema display
- Other various bug fixes and improvements
Mar 10, 2025
- (Alerts/Reports) Fixed an issue with Alerts and Reports where users implemented Slack with more than 20K channels in place. (See docs for information on upgrading to the latest Slack API).
- (Datasets) Resolved an issue where calculated columns were not correctly retained correctly when updating queries underlying a virtual dataset.
- Other various bug fixes and improvements
Mar 05, 2025
- (Databases) Improved support for Firebolt dialect
- (Charts) Improved rendering of nested elements in Partition viz
- (Home) Fixed pinning of tags on home/welcome page
- (Home) Fixed issue with collapsing search input
- Other various bug fixes and improvements
Feb 20, 2025
- (Dashboards) Fixed an issue with PDF downloads
Feb 19, 2025
- (RLS) Row level security now displays last modified date
- (Charts) Improved stability of CSS and Handlebars editors in Handlebars plugin
- (Datatsets) Virtual dataset columns are syncronized automatically when updating the SQL query
- (OAuth) Improved usability the OAuth config form
- Other various bug fixes and improvements
Feb 06, 2025
- (AI Assist) Added support for database catalogs
- (Alerts/Reports) Now supporting a max width of 4800 pixels (doubling size)
- (Charts) Small fixes to Pivot Table
- (Databases) Fixes small issues with Pinot and Trino
- Other various bug fixes and improvements
Jan 22, 2025
Enhancements and Fixes
- (Charts) New "Interactive Table" visualization based on AG Grid
- (Dashboards) Fixed an issue where clicking the “Refresh dashboard” button wasn’t refreshing all charts in the dashboard
- (SQL Lab) Fixed an issue where users were unable to update an existing query selected from the Saved Queries list
- (SQL Lab) Cosmetic updates for the Query History pane
- (Databases) Improved support for legacy Firebolt databases via a new
sqlglotdatabase dialect - (Audit Logs) Dashboard filter events are now visible in logs
- (UI) Redesigned label component now visibile throughout the product
Dec 18, 2024
Enhancements and Fixes
- (Dashboards) Fixed an issue where clicking the “Refresh dashboard” button wasn’t refreshing all charts in the dashboard
Dec 16, 2024
Enhancements and Fixes
- (Dashboards) Fixed an issue where tooltips on hovering on the filter bar in dashboards were sometimes blocking the filters from being clicked on
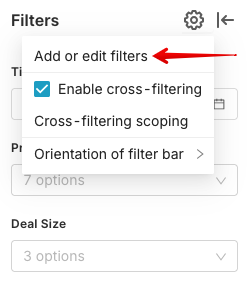
- (Dashboards) Addressed an issue where clicking blank spots in the menu item to “Add and edit filters” on a dashboard wasn’t opening the modal properly
- (Dashboards) Fixed an issue where the last modified date on dashboards was getting updated in some cases where no user action was taking on the dashboard
- (Databases) Addressed an issue where database imports were sometimes returning an error even when the import succeeded
Dec 11, 2024
New Features
-
(Dashboards) Moved the “Add or edit filters” button into the filters settings icon
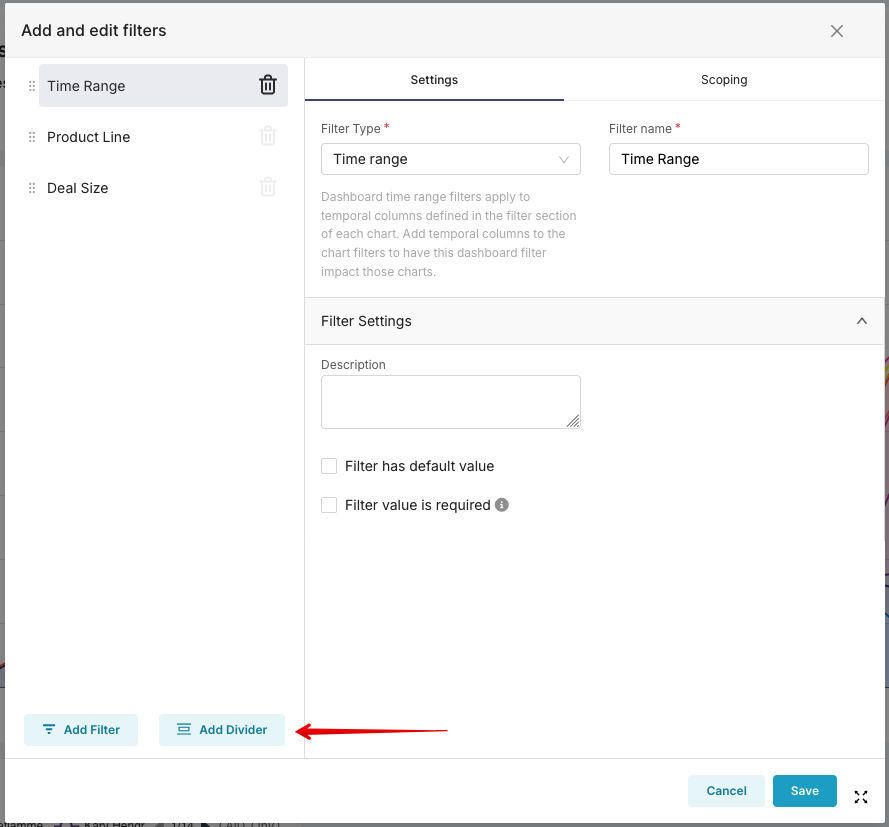
-
(Dashboards) Moved Add Filter and Add Divider to new buttons at the bottom of the filter editing and creation modal
Enhancements and Fixes
- (Charts) Added controls to hide percentages and totals from tooltips in time series charts
- (Charts) Added new number formatting capabilities for the Handlebars chart using
formatNumberandgroup. See here for examples. - (Charts) Addressed an issue where annotation layers were not getting updated when the chart changed orientation
- (Charts) Fixed an issue where axis labels on bar charts would sometimes disappear in edit mode
- (SQL Lab) Fixed an issue where error messages in SQL Lab were appearing duplicated
- (Saved Queries) Added a link from the Name column of the Saved Queries page to more easily access your queries
- (Databases) Fixed an issue where special characters in Databricks catalogs and schemas were not working properly
- (Databases) Added support for user impersonation in the StarRocks database
- (Embedded) Hid link icons for tabs and headers since embedded users don’t have access to use them
- (API) Made improvements to our permissions API to reduce the occurrence of time outs
Dec 4, 2024
Enhancements and Fixes
- (Dashboards) Fixed a visual bug with the undo and redo buttons in Dashboard edit mode
- (Dashboards) Improved the color consistency in dashboards
- (Datasets) Fixed an error where some reserved SQL keywords were causing datasets to error when being created
- (Databases) When updating the database settings on an OAuth2 connection, we now clear existing tokens since they are unlikely to be invalid. Users will need to reauthenticate.
- (Databases) Fixed an issue with Databricks where the connection was not working properly when the catalog or schema name had a special character in it
Nov 26, 2024
New Features
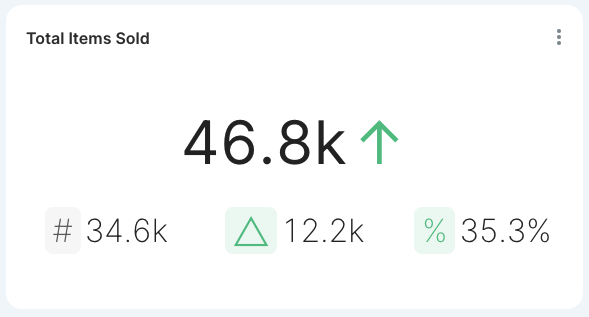
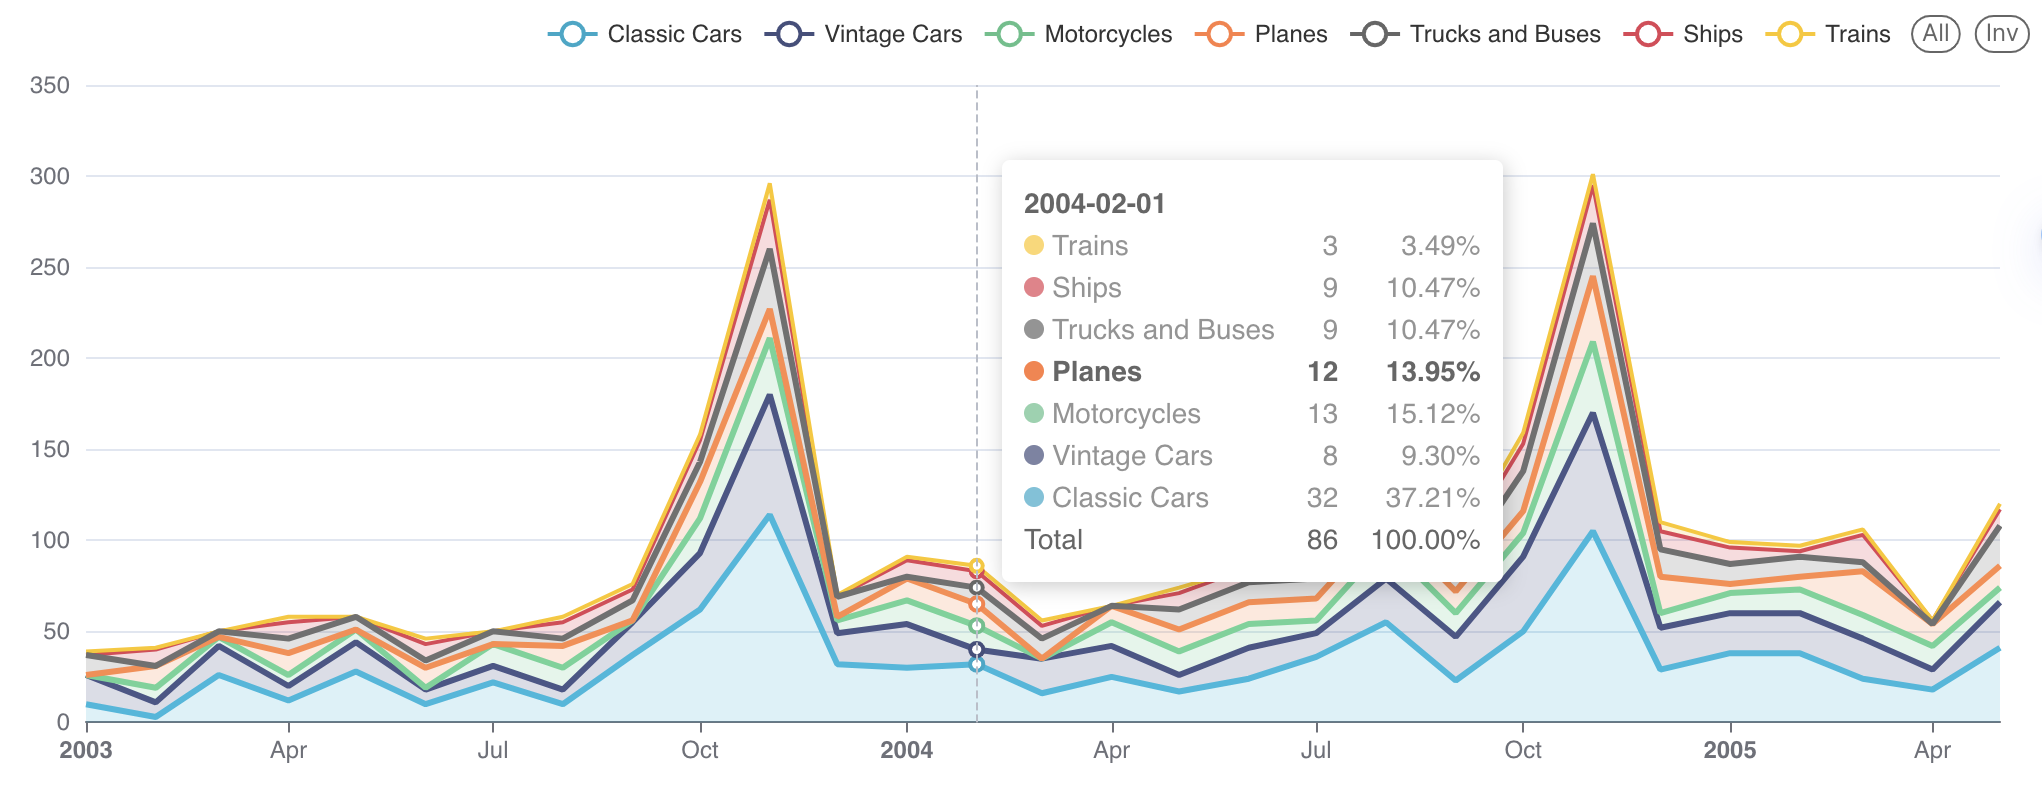
Time Comparison in Big Number and Table Charts
-
Big Number with Time Period Comparison Chart Type
This new chart type allows you to select a metric and a comparison time period (1 day ago, 1 week ago, 1 month ago, 1 year ago, the same range as the length of the original time period, or with a custom time range start date). The visualization will display the main metric, the comparison metric, the absolute change between the two, and the percent change between the periods.
-
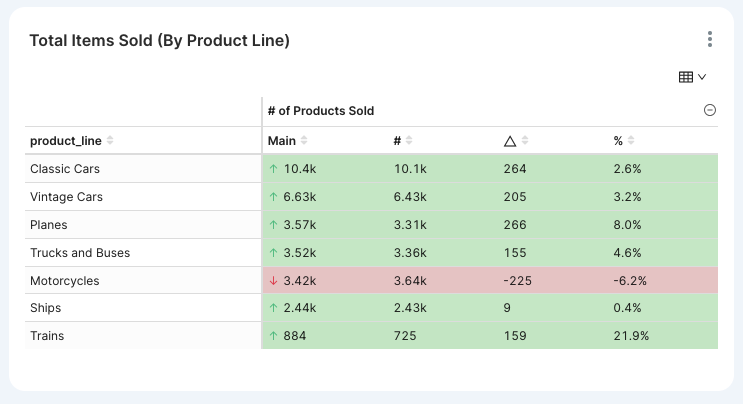
Time Comparison Feature in Table Charts
Tables now support the ability to compare to a previous time period with the same comparison options as above. The table chart will have a new # (previous metric), ∆ (absolute change), and % (percent change) column added for each metric in the table.
OAuth2 Support
- (Databases) Support for OAuth2 authentication for BigQuery, Databricks, Snowflake, and Trino connections. This allows user permissions to be applied when running queries on the database.
Updated Chart Types
The following chart types have been updated. Existing charts will now use the version of the chart marked with the (Legacy) tag. These charts can be manually updated to the new chart types or the CLI command can be used to migrate charts to the new types.
-
New Heatmap chart. Compared to the legacy Heatmap, it has more accurate percentage calculations, server side sorting to respect row limits, and a more interactive legend control that allows selecting a subset of values

-
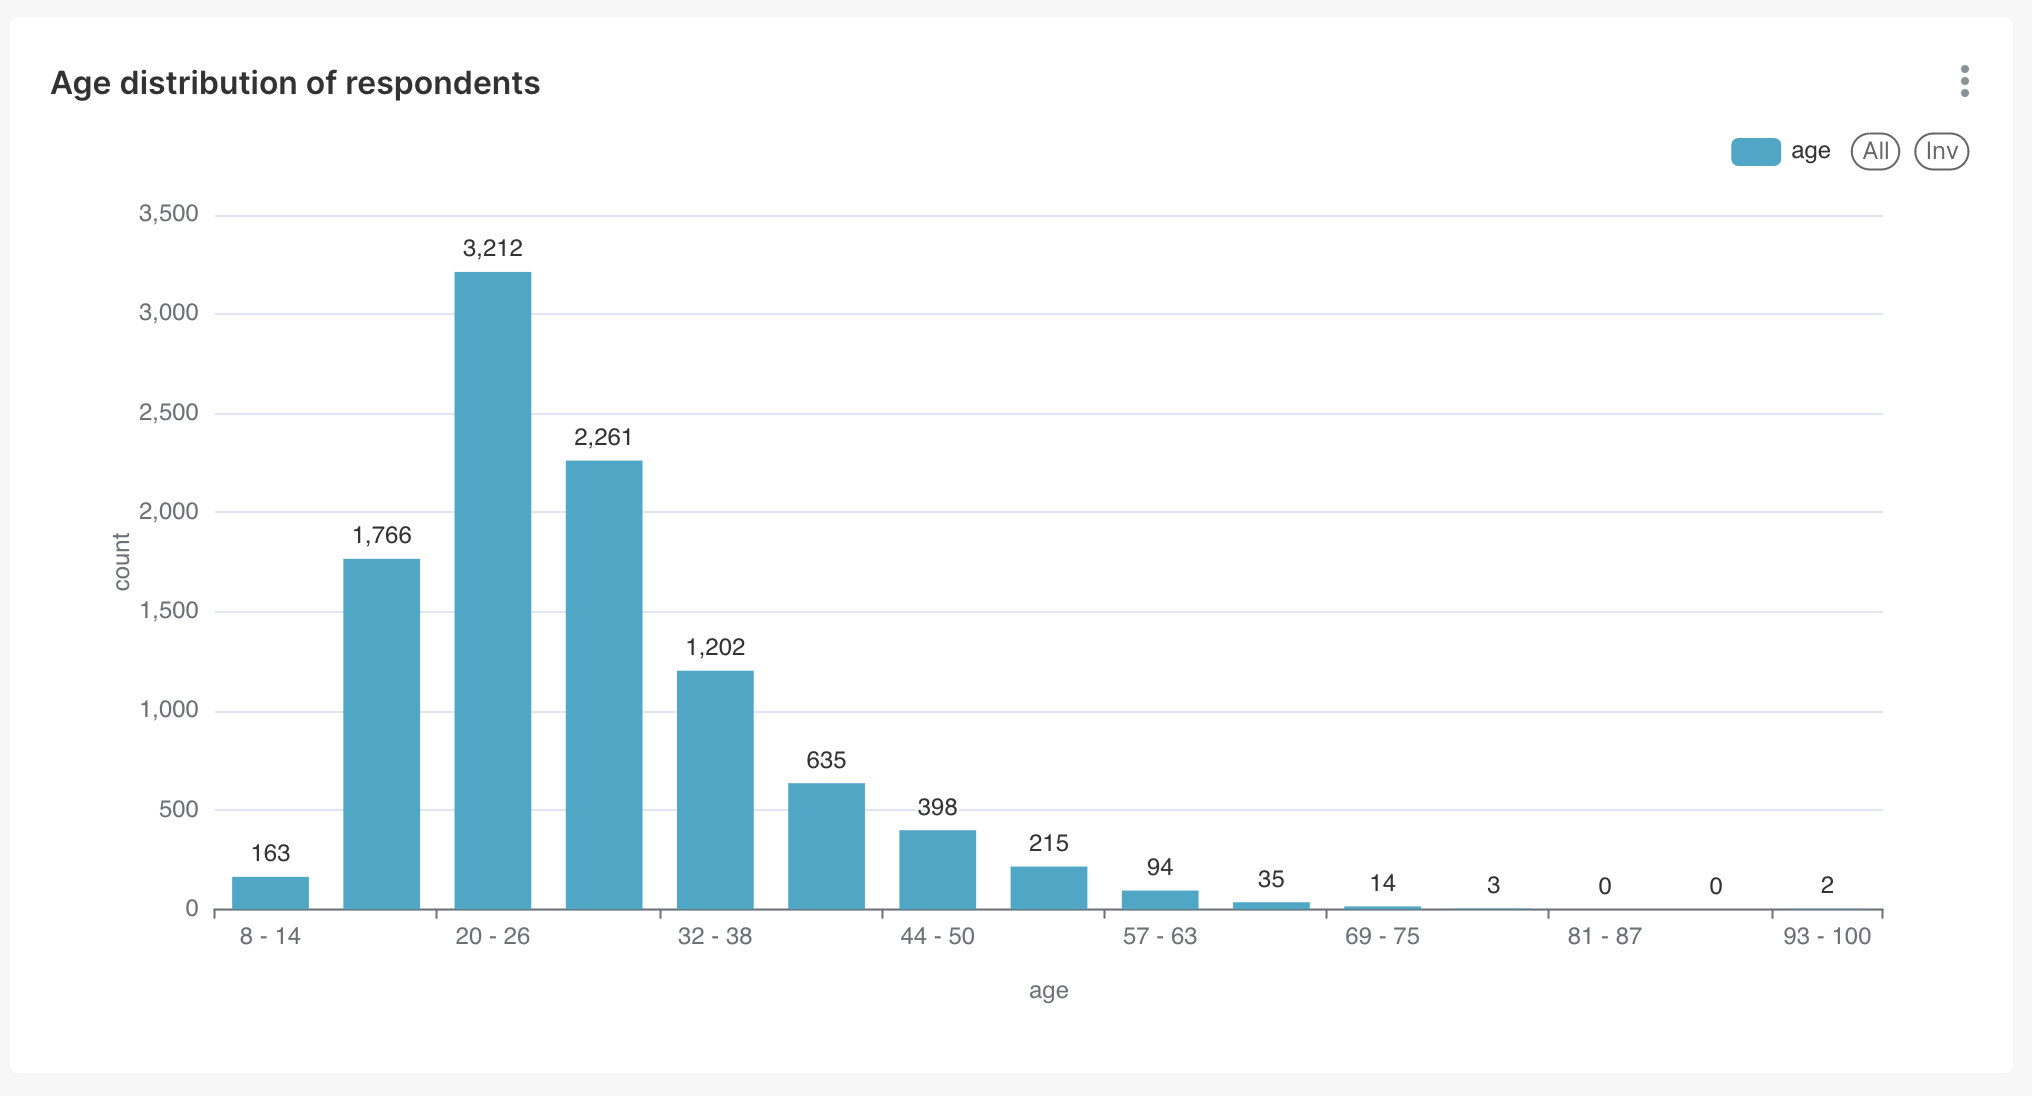
New Histogram chart with additional option to show values on the chart.
-
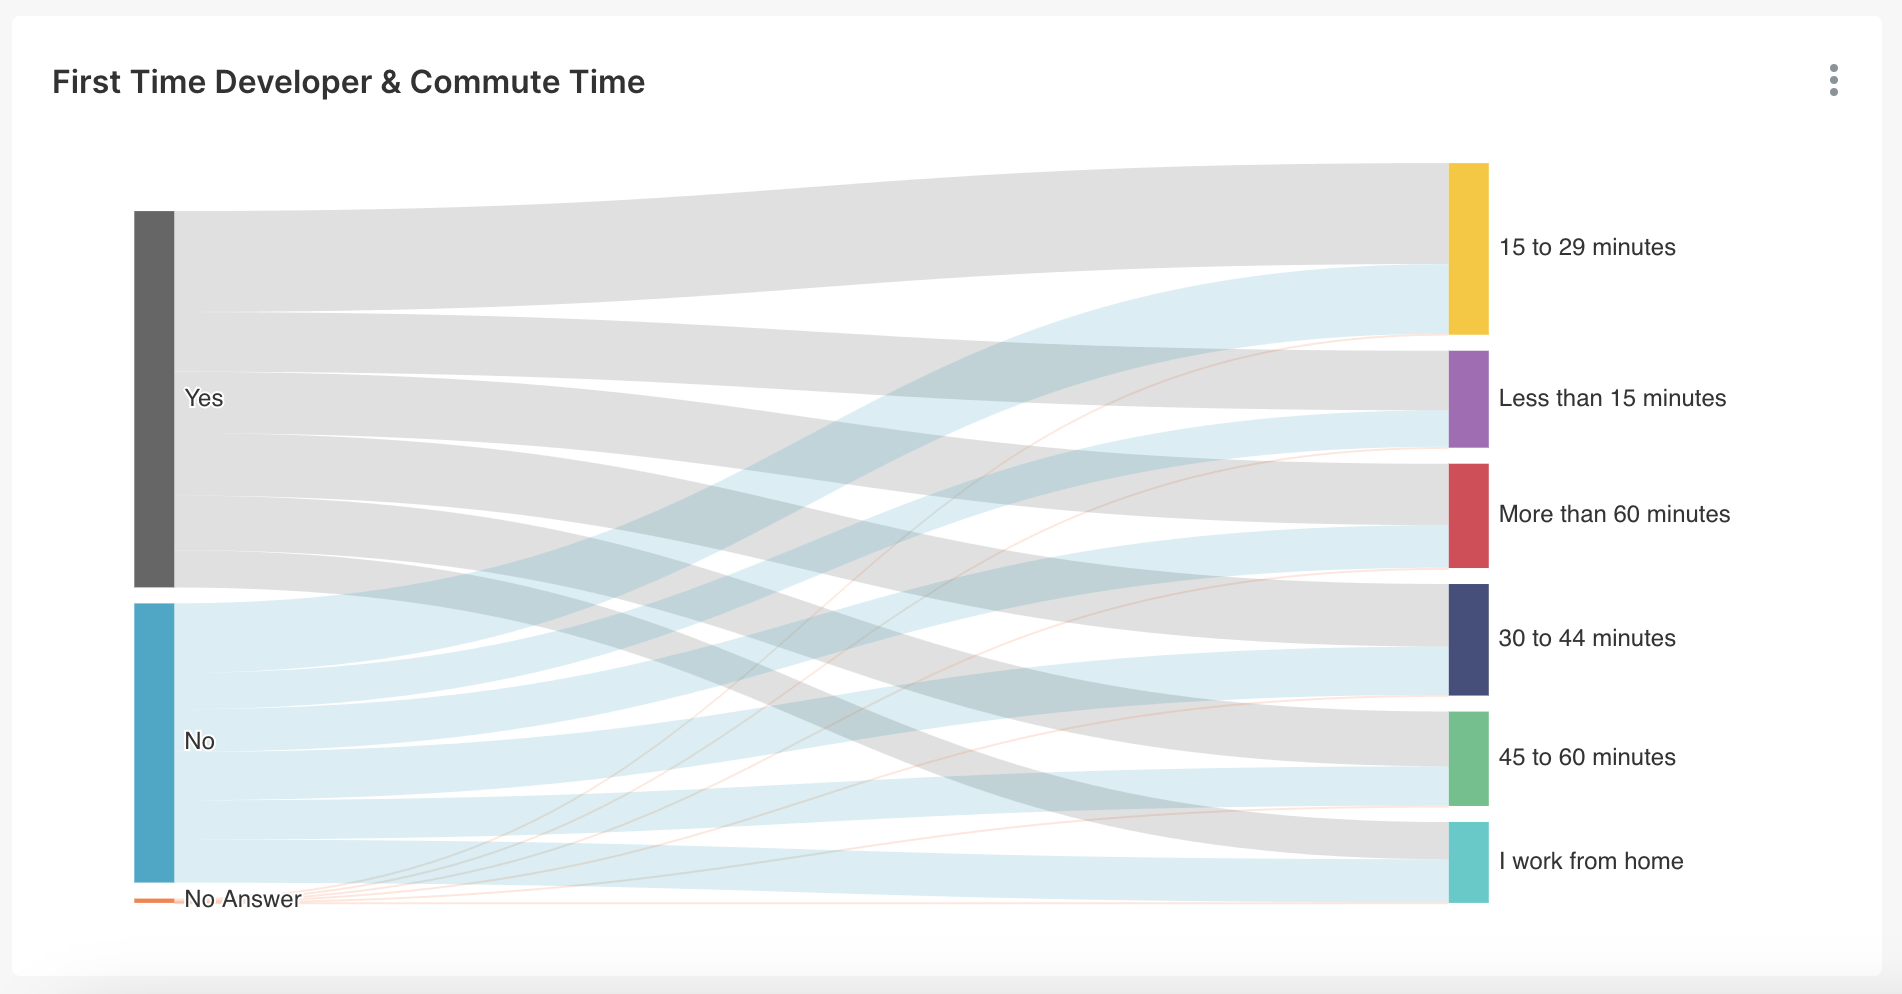
New Sankey chart with clearer source and target controls in the Chart Builder.
-
Added support to migrate Bar Chart (legacy) and Time-series bar charts (legacy) to the new Bar Chart
Other Features
-
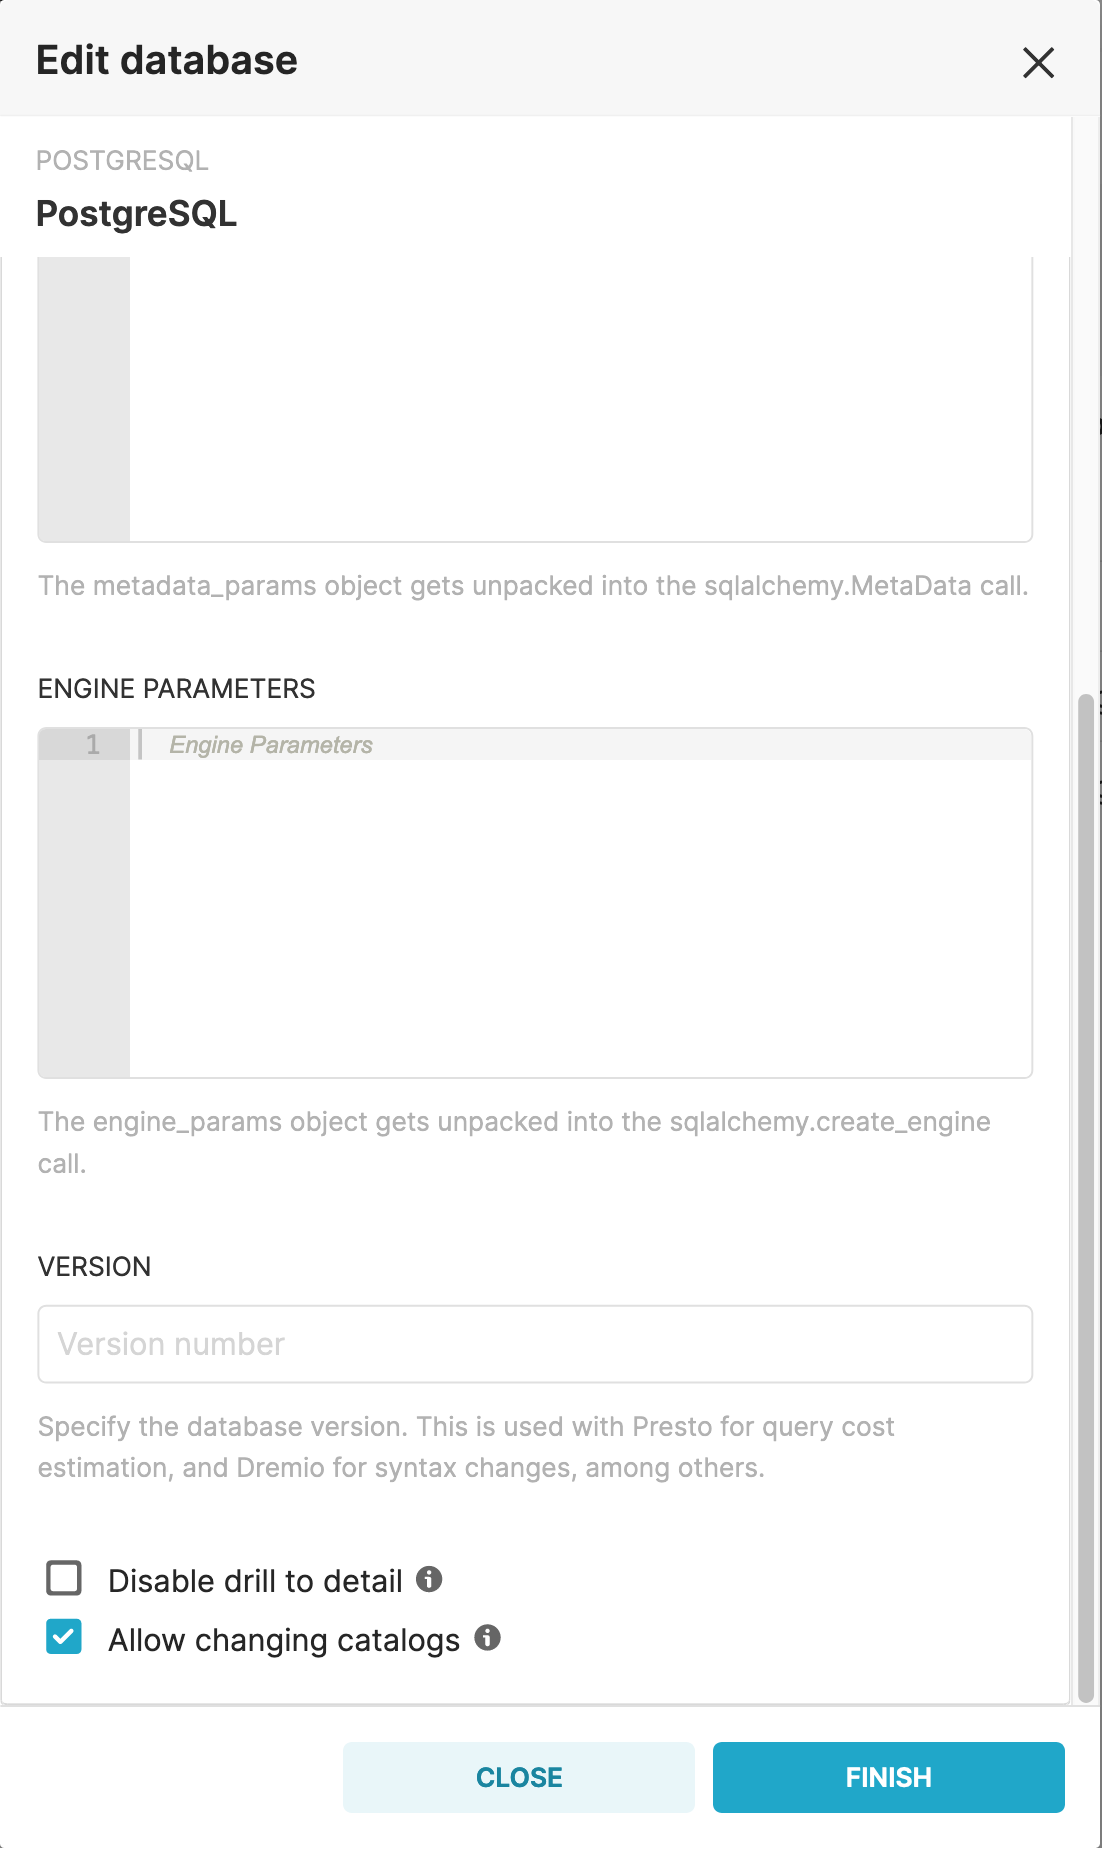
(Databases) Added support for the catalog heirachy for databases that support it, such as BigQuery (projects), Databricks, Presto, Snowflake, and Trino. In the “Advanced” section of a database, under “Other”, select “Allow changing catalogs” to enable this feature. Once enabled, users will see catalogs when selecting tables in SQL Lab, creating a new dataset, and when setting up Data Access Roles.
-
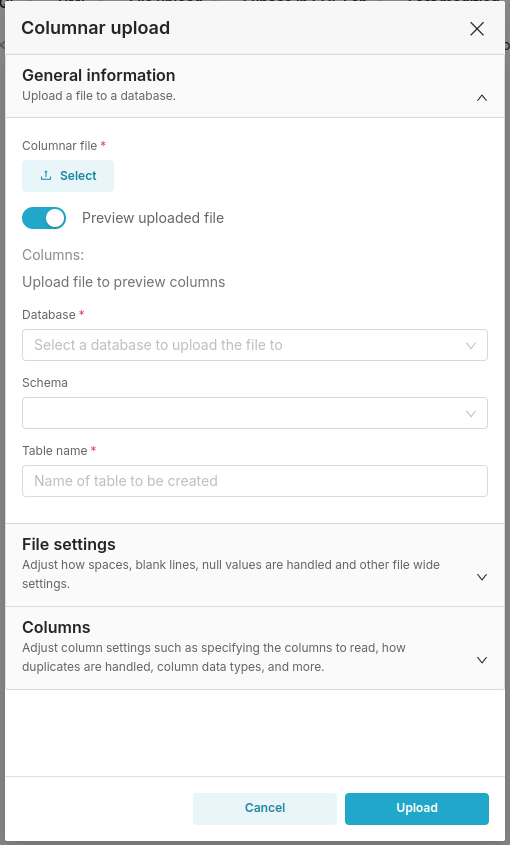
(Upload Forms) The CSV, Excel, and Columnar upload forms have been updated with new UI as well as improved error handling and better validation.
-
(Users) Integrates with Slack to add avatars in Preset when the Slack token has been added for alerts and reports
-
(Alerts & Reports) Users can now optionally customize the subject line of email alerts and reports that get sent out
-
(Time Filters) Support for the “Current” time range that includes current calendar week, current calendar month, and current calendar year
-
(Charts) Updated tooltip formatting for Bar, Line, Big Number with Trendline and other chart types. Stacked chart types now show totals and percentages.
-
(Dashboards) A new Jinja macro
{{ get_time_filter() }}has been added that returns the time filter that is applied to a specific column.
Enhancements and Fixes
- (Permissions)
all_database_accesspermission now correctly grants access to all data in the workspace - (Dashboards) Users are now able to set a custom refresh frequency on dashboards in addition to the previously pre-defined options
- (Dashboards) Enabled Drill By in time series charts that do not have a dimension configured
- (Dashboards) Fixed an issue where tabs were unable to be added into columns when editing a dashboard
- (Dashboards) Fixed an issue where filters were not showing all values when “Dynamically search all filter values” was selected in the filter configuration
- (Charts) New color schemes have been added to charts and dashboards
- (Charts) Added the option in the Customize panel to disable rendering of html in Table charts
- (Charts) The Advanced Analytics controls section will now be hidden when a non-temporal column is set on the x-axis of a chart
- (Charts) SQL comments are no longer removed when executing SQL statements
- (Charts) Fixed an issue where the contribution % on tooltips when time offsets were calculated incorrectly
- (Charts) Support for using mouse scroll in the Data Zoom option for charts
- (Charts) New “Rose Type” control in Pie Charts allows for Nightingale chart support
- (Charts) Added a label templating field to the Pie charts
- (Charts) Pivot tables now support the “Export to Pivoted CSV” option from dashboards
- (Charts) Export options are disabled when the user doesn’t have the correct permissions
- (Datasets) Fixed errors that would appear with the
latest[_sub]_partitionJinja macros - (Datasets) Added additional checks to ensure that dataset names are unique
- (Databases) Added custom database connection form that includes the option to go to MotherDuck to copy and paste the access token and support for
custom_user_agentwhen connecting to MotherDuck - (Databases) Support for uploading data via CSV for Trino
- (Databases) Resolved an issue that caused some Apache Spark statements to be non parseable
- (Alerts & Reports) Adds a config to set an allowed minimum interval for alert and report schedules. Please reach out to support@preset.io if you’d like to customize your minimum report schedule interval.
- (Alerts & Reports) Removed the ability to select duplicate notification methods
- (Alerts & Reports) Resolved an issue where selecting a log retention of “None” was showing an error
- (SQL Lab) Added the option to disable rendering of html in SQL Lab results table
- (SQL Lab) Fixed an issue where some autocomplete details were cut off
- (SQL Lab) Download and copy options are disabled from query results when the user doesn’t have the correct permissions
- (SQL Lab) Saved queries show descriptions again in the Saved queries list
- (SQL Lab) Fixed an issue where the Create Chart options was not enabled in SQL Lab for Pinot databases
- (SQL Lab) Addressed an issue where SQL Lab would show an error when unable to decode a type that was returned for serialization
- (World Map) Added Czech Republic country map
- (World Map) Fixed an issue with the map of India
- (World Map) Added Philippines regional map and cleaned up the Philippines provincial map
- (World Map) Added Turkey’s regions
- (World Map) Updated Ukraine map
- (API) Added 403 response status codes
October 16, 2024
Enhancements and Fixes
- (Charts) In Explore, when adding a new Metric or Dimension, the Simple tab will be opened by default
- (Datasets) Fixed an issue where Drill By and exports weren’t working for charts that used Datasets with a Jinja
{{metric()}}macro - (Databases) Fixed an issue where Firebolt queries were getting parsed incorrectly
October 2, 2024
New Features
- (Databases) Support for connecting to Oracle Cloud databases
Enhancements and Fixes
- (Dashboards) Improved drop indicators when moving tabs around in Dashboard edit mode
- (Dashboards) Fixed an issue where native filters appeared out of scope on example dashboards
- (Charts) Fixed an issue where users would get an error when trying to download a pivot table to CSV
- (Charts) Addressed an issue where chart configurations weren’t kept when switching datasets
- (Queries) Moved the query context logs to appear under the SQL query for Snowflake queries when the feature flag for including user, workspace, dataset, chart, and dashboard info in queries is enabled 2
- (Homepage) Fixed spacing on the Preset workspace home page
September 26, 2024
New Features
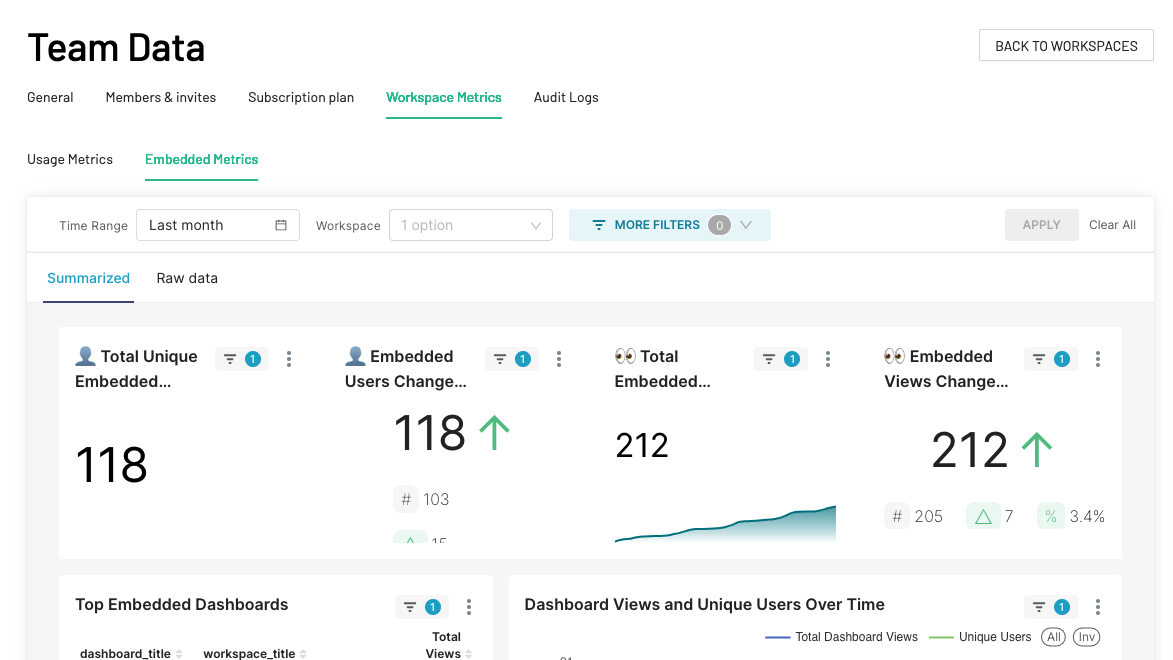
- (Embedded) For teams using Embedded dashboards, admins are now able to see an embedded usage metrics dashboard. Visit the main Preset team page, click “Manage Team” and then “Workspace Metrics” and/or “Embedded Metrics” tabs.
Enhancements and Fixes
- (Embedded) Fixed an issue where PDF exports were not working from embedded dashboards
September 18, 2024
Enhancements and Fixes
- (Charts) Added a new control when Time Shift is used to allow selecting between using the original series colors or different colors for the time shifts
- (Charts) Custom column labels in Raw Records tables now work properly for columns that do not contain aggregates
- (Dashboards) Fixed an issue where some dashboards were not loading the filters properly
- (Dashboards) Filters with the option “Select first filter value by default” now show an error message in the dashboard when the filters can’t be loaded properly
- (SQL Lab) Improved performance by disabling the text editor in inactive tabs, fixing an issue with the cursor, and not re-rendering the JSON results modal
- (SQL Lab) When opening a tab that references a deleted database, the user will see a warning message
September 10, 2024
New Features
- (Databases) Added support for connecting to Airtable as a database
Enhancements and Fixes
- (Databases) Fixed an issue where Databricks connections with a blank Secure Extra configuration field were not working correctly
- (File Uploads) Fixed an issue where some users were not able to upload files to their database successfully
- (Performance) Improved the performance on the Home page of workspaces
September 5, 2024
Enhancements and Fixes
- (Databases) Fixed an issue where Trino queries were not running
- (Databases) Updated the Snowflake OAuth connection to not require a username and password
- (Databases) Added support for Apache Doris
- (Databases) OAuth for Databricks is supported now by adding the client info into the Extra field and enabling User Impersonation
- (Dashboards) Updated example dashboards for new workspaces
- (Dashboards) Fixed an issue where comments were appearing under other dashboard elements
August 21, 2024
Enhancements and Fixes
- (Dashboards) Fixed an issue with generating dashboard thumbnails
- (Dashboards) Addressed an issue where Viewers, Dashboard Viewers, and Embedded users were unable to download dashboards to PDF or PNG
- (Datasets) On the Datasets list view, the Dataset field now shows the dataset name with the full schema and dataset in a tooltip
August 13, 2024
Enhancements and Fixes
- (Queries) Fixed an issue where query comments about the user, chart, and dataset weren’t getting added to queries in some cases. This feature is currently behind a feature flag, reach out to the Preset team to start using this feature. 1
August 7, 2024
New Features
- (Databases) Added initial support for connecting to Snowflake with OAuth
- (Charts) Added a new control in Pivot Tables called “Render Columns in HTML Format”. This allows users to add hyperlinks in Pivot Tables.
- (Charts) Added a new Histogram chart type. Previous histograms will be labelled as chart type “Histogram (legacy)”
Enhancements and Fixes
- (Alerts & Reports) Fixed an issue with the loading of Slack channel names
- (Charts) Addressed an issue with autocomplete when using Custom SQL in the Chart Builder
July 29, 2024
New Features
- (API) Added new endpoints for generating and downloading dashboard screenshots. Visit our API docs for more detailed information.
Enhancements and Fixes
- (Alerts & Reports) Fixes some issues with sending Alerts & Reports via Slack, and improved the Alert & Report creation process when setting up a Slack Alert or Report. The Slack bot still needs to be added to the proper Slack channel for Alerts & Reports to send properly.
- (Tags) Tag filters on Dashboard, Chart, and Saved Queries pages are properly filtering out results again
- (Dashboards) Drill to detail no longer truncates int64 values
- (Dashboards) Addressed an issue where empty columns instead of tabs couldn’t be deleted when creating a dashboard
- (Dashboards) The “Refresh Dashboard” button now refreshes filters in addition to charts
- (Dashboards) Fixed a bug where generating a permalink of a tab on a dashboard would sometimes use the previous tab instead of the current one
- (Dashboards) When switching to a new top level tab, the dashboard will scroll to the top instead of retaining the previous scroll position, so that users don’t see a tab that looks empty
- (Charts) Fixed an issue that was adding extra space between the legend and the chart contents
- (Charts) SQL comments will not be removed when executing chart queries
- (Charts) Renames the Total column to Summary in Table charts
- (Chart Builder) Fixed an issue where custom SQL filter clauses were sometimes unable to be changed and saved
- (Chart Builder) Addressed an issue where the chart controls were sometimes incorrectly changing sizes when the browser window was resized
- (Chart Builder) Fixed an issue where some chart controls were not properly unhidden after the user switches the chart from using a temporal x-axis to a non-temporal x-axis and back
- (Chart Builder) The Advanced Analytics section is now hidden when the chart doesn’t use a temporal x axis
- (Chart Builder) Changing the Y-Axis Axis Format control now updates the formatting accordingly
- (Chart Builder) Fixed a bug where switching between Aggregate and Raw Records mode in Table charts would sometimes show an error
- (Chart Builder) Fixed various issues with time shifts, including some calculations where the time shift granularity didn’t match the chart granularity, connecting time shifts lines when there is missing data, and fixing the patterns used when displaying multiple time shifts
- (Chart Builder) Fixed a calculation error in tooltips when a bar or line chart was created with time shift and contribution mode enabled
- (Chart Builder) Renamed some legacy chart types to include “Time-series” in the name
- (SQL Lab) Addressed a rare case where switching tabs would cause a query from the previous tab to be run
- (SQL Lab) Fixed a bug where switching tabs would sometimes show an empty state instead of having a database selected
- (SQL Lab) Comments should be retained when executing SQL statements
- (SQL Lab) The description column has been added back to the Saved Queries page
- (SQL Lab) Fixed an issue where Trino and Presto schema previous were not working in SQL Lab
- (SQL Lab) Improved the json serialization in SQL Lab to prevent hard failures
- (Databases) The database modal will no longer close when clicking outside of the modal so that users don’t lose progress in connecting or editing a database
- (Databases) Added support for the Apache Spark dialect so that Spark SQL statements are processed even when the dialect is not specified
- (Datasets) Fixed an issue that was allowing some datasets with duplicate names to be created
July 10, 2024
Enhancements and Fixes
- (Charts) The page size selector on Table charts should not be accessible to screen readers
June 27, 2024
Enhancements and Fixes
- (Error Messages) Fixed an issue where raw html was displaying rather than a proper error message
- (Charts Dashboards) New color schemes have been added
June 26, 2024
Enhancements and Fixes
- (Dashboards) Improved the color consistency on dashboards. Series with shared labels across charts should share a color. Colors set in the Dashboard properties will still be respected.
- (Chart Builder) Addressed an issue where the Color Scheme control would not show when users opened a chart from the dashboard
- (Chart Builder) Fixed a bug where the top x results were not returning the right results in some cases
June 20, 2024
Enhancements and Fixes
- (Permissions) Updated the “All database access” permission to give access to all datasets and databases, and thus all charts and dashboards
- (Permissions) Fixed an issue where ****invites with different capitalization than the user’s email would not have the right account permissions
- (Tags) Addressed an issue where some charts and dashboards were unable to be deleted if they had a tag applied to them
- (Dashboards) Fixed some issues with dragging to resize a chart when creating or editing a dashboard
- (Databases) Fixed some column type handling for Presto and Trino
May 30, 2024
Enhancements and Fixes
- (Alerts & Reports) Fixed an issue where sometimes alert or report screenshots would be captured before all chart contents were loaded
- (Tags) If a user doesn’t have the correct permissions to tag content, they will see an error message. When tagging items in bulk, the content that the user does have permission to tag will be updated correctly.
May 22, 2024
Enhancements and Fixes
- (Dashboards) Addressed an issue where some charts would disappear until hovered over after a recent Google Chrome update
May 2, 2024
Enhancements and Fixes
- (Databases) Updated Dremio database configurations to support certificates
- (Databases) Added Dremio support for
datetime[ms] - (Databases) Fixed an issue where
%in queries were getting duplicated to%%
April 22, 2024
Enhancements and Fixes
- (Chart Builder) Fixed an issue where users were unable to reorder metrics within the control panel
- (Chart Builder) Operators such as
>,<, and=were not being properly displayed in Conditional Formatting on tables
April 18, 2024
New Features
- (Databases) Added a database level configuration to disable Drill to Detail. This can be found in the Advanced section of your database connections in Preset
- (Charts) Added an “On dashboards” column to the Charts list, which allows users to see which dashboards a chart has been added to
Enhancements and Fixes
- (Dashboards) Users with the workspace role “Viewer” are able to use the Drill By feature again
- (Dashboards) Added the ability to navigate through dashboard titles, charts, and chart controls using keyboard navigation
- (Dashboards) Added labels for screen readers on dashboard filters and search
- (Dashboards) Added a border to show the rows that will be changed when using the move, delete, or settings icon on the left side of dashboard edit mode
- (Dashboard Filters) Made a fix so that screen readers can access the filter values that are used in the “Applied filters” tooltip
- (Charts) Fixed an error where queries containing the word
constructorwould return an error - (Charts) Fixed a bug where some time shift data would not be showing when using a Time Shift in Advanced Analytics alongside a Row Limit configuration
- (Chart Builder) When dragging a metric from the dataset panel in the Chart Builder to the control panel, the drop indicator will more clearly show the valid areas where a metric can be dropped
- (Chart Builder) Increased timeout on chart annotation layers
- (Chart Builder) When a chart has one remaining temporal filter, clicking the X will now clear the filter values rather than showing the user a warning message to not remove the last temporal filter
- (Datasets) When using the
latest_partition('table_name')Jinja macro, any leading or trailing whitespace will be removed from the table name - (SQL Lab) Comments in executed queries are no longer stripped
- (SQL Lab) Improved the error that is displayed when there is a syntax error in a query
- (Homepage) Users who don’t have access to charts and queries will no longer see those tabs in the Homepage
April 11, 2024
New Features
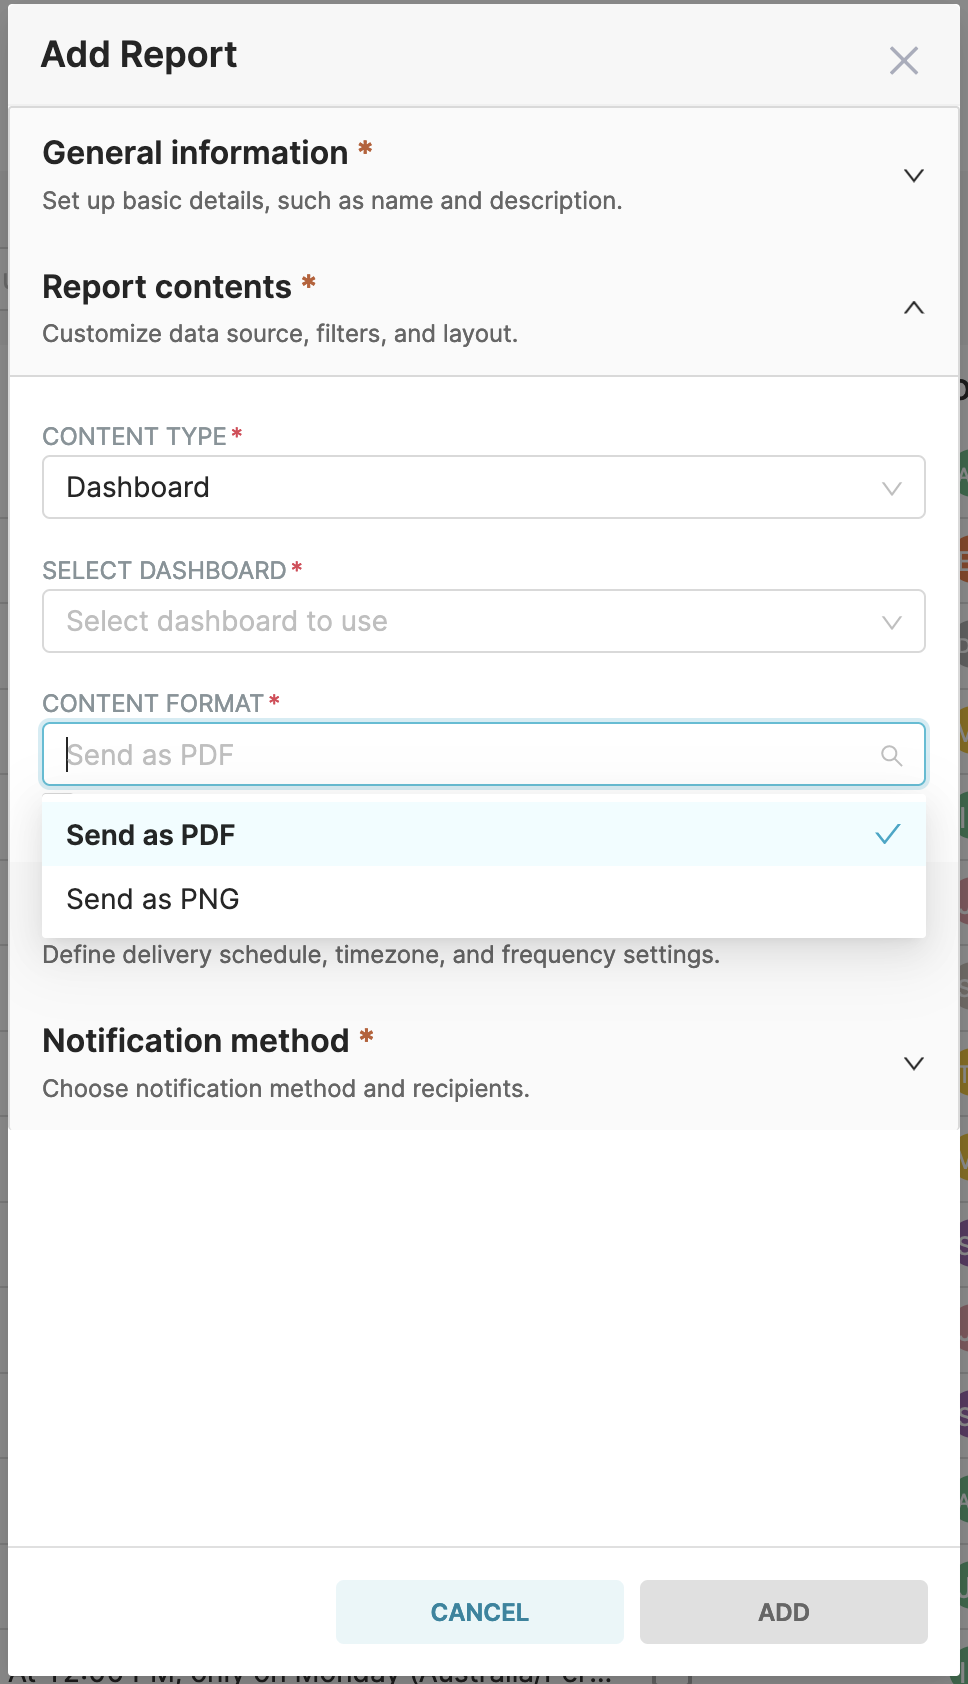
- (Alerts & Reports) Users can now select a PDF option when creating an Alert or a Report
Enhancements and Fixes
- (Chart Builder) Improved performance and rendering of the dataset columns list in the left panel
- (Chart Builder) The row count indicator in the top right of the chart builder has been updated to reflect the number of rows from the database, before any processing is done on the data. It will turn red when the row limit set in the control panel has been reached and the chart may be showing partial data.
- (Chart Builder) Improved feedback on the Control Panel when the user is trying to drag and drop a column into a control area that is not allowed
- (Charts) When charts are loading, additional information has been added to the spinner to help users understand the loading process
- (Bar Charts) Fixed an issue where using “Stacked” mode and a Time Shift would stack all time shifts in the same bar. Different times shifts will now show as their own stacked bars.
- (Bar Charts) In horizontal bar chart mode, the chart legend no longer overlaps with the content of the bar chart
- (Dashboards) When editing a dashboard, hovering over the menu icons on rows now shows the border of the entire row, clarifying the charts that will be affected by any changes
- (Datasets) Added a new Jinja macro
{{ metric('metric_key', dataset_id) }}to retrieve metric syntax from a dataset so that it can be re-used in charts, SQL Lab, datasets, etc.
Mar 27, 2024
New Features
- (Dashboards) Improved drag and drop usability when creating or editing dashboards. Users will now see clearer and larger drop areas when moving dashboard content around
-
(Alerts & Reports) New modal for setting up Alerts & Reports in a linear process, with better grouping of the configuration fields. 1
-
(Permissions) Row Level Security rules no longer require setting up an empty Data Access Role and can now be associated to any Data Access Role
-
(Permissions) Data Access Roles and Row Level Security can now be set up for invited users who have not yet accepted their invites. Search for them using their email address and “Pending Invite” in the user list.
-
(dbt) Preset’s dbt integration has been upgraded to support the new metric and measure schemas introduced in newer versions of dbt, which provides a path for upgrading to dbt 1.6 and 1.7 2
Deprecations
- (Dashboard Filter Boxes) Old dashboard Filter Box chart types have been migrated to the filter bar. Any previous filter boxes have been updated to Markdown components in the dashboard and can be removed by a dashboard owner.
- (Sunburst Charts) Sunburst charts have been automatically migrated to the new Sunburst chart type
- (Datasets) Added validation on date formats. Format
%Y%m%dis not currently supported and will show the user an error, please migrate these dates to a supported format such as%Y/%m/%d - (Redirects) Short URL links with format
/r/{id}from 1.5 years ago or older will no longer redirect
Enhancements and Fixes
Databases
- (SSH Tunnelling) Fixes an issue where SSH tunnels were not being removed properly from database connection configurations
- (SSH Tunnelling) Added an error message when the port in the database configuration form was missing
- (Clickhouse) Fixed an issue where datasets couldn’t be created if
SimpleAggregateFunctionwas used - (Pinot) Addressed an issue where epoch ms timestamps and datetime conversions were incorrect
- (Trino) Fixed an error that occurred when fetching Hudi table schemas
Datasets
- (Creation) Added additional data access validation during virtual dataset creation
- (Configuration) Dataset extra configuration option
{"disallow_adhoc_metrics":true}will only allow dragging and dropping saved metrics to the Chart Builder Metrics field
Charts
- (Data Zoom) The data zoom tool now changes orientation when the chart orientation is updated from horizontal to vertical
- (Resample) Fixed an issue where the Resample Fill Methods were not working correctly if the time index was present
- (Results) Fixed an issue where the Results tab in the Chart Builder would sometimes display an infinite spinning icon
- (deck.gl Multiple Layer Chart) Added deck.gl Heatmap and deck.gl Contour Layers to the deck.gl Multiple Layer Chart
- (Gauge Chart) Fixed the color boundaries when interval bounds and a minimum value are set
- (Heatmap) Numeric X and Y axes are now sorted correctly
- (Mixed Chart) Label colors specified in Dashboard properties are now applied properly
- (Time Series Charts) The Y-axis format is correctly applied when contribution mode has a value other than ‘None’
- (Time Series Table) Negative time lag values are now allowed, making it possible to compare to the beginning of the time range
- (World Map) Repositioned the Overseas departments and regions of France (DROM) to be displayed in one view and improved the rendering of the map view of France
Dashboards
- (Dashboard Creation and Editing) Fixed an issue where table chart types were displaying larger than their chart container when dragging to move them in dashboard creation and edit modes
- (Filters) When set to a slider, the dashboard filters now slide properly for values between 0 and 1
- (Performance) Charts now display additional information on the loading spinner about the status of the chart load
- (Permissions) Users will now see an error message and be redirected to the Dashboards page when trying to access a dashboard they don’t have permissions to see using a permalink
SQL Lab
- (Performance) Improved the initial loading time for SQL Lab
- (Tabs) SQL Lab no longer shows invalid placeholder text when closing a tab
- (Tabs) Added back the placeholder image for query results in a new SQL Lab tab
- (Tabs) Fixed an issue where closing a tab that had been removed in another window would throw errors
- (Tabs) The cursor saves its position when switching between SQL Lab tabs
- (Left Panel) Fixed an issue where Databases weren’t appearing correctly when typing into the search bar
- (Results) Fixed an error that caused the json modal in SQL Lab results that contain json blobs to be flaky
- (History) Addressed an issue where SQL Lab history would display errors
Alerts & Reports
- (Configuration) Updates the Screenshot Width configuration option to accept only numeric values
- (Logs) When alerts fail, the logs no longer show query and query result information for security purposes
Other
- (API) The
ownersfield on datasets and charts is no longer lost if it is not included in the update payload - (dbt) Updated UI to allow specifying custom dbt Cloud API URLs when setting up the database sync
- (Embedded) The Embedded SDK will no longer fire requests to refresh the guest token after the embedded iFrame is unmounted
- (Embedded) New Macro
{{url_param()}}fetches parameter values from the dashboard URL - (Errors) Addressed an issue where errors and messages in the bottom right of the application would be duplicated
- (List Views) Fixed a bug where selected filters on the list view were not applied when changing the sort order
- (List Views) When refreshing the list views, the sort order is retained
- (List Views) User will be redirected to the first page of a list view if an invalid page is entered
- (Imports) Added a validation to prevent users with limited permissions to import charts and dashboards that already exist
- (Jinja) New Macro
{{curent_user_email()}}is added that can support applying RLS based on the logged in user - (Permissions) Improves performance on page load of the Data Access Roles page
- (Queries) A limit is no longer applied to
SELECT *queries in databases that don’t supportLIMIT - (Queries) Adds dashboard_id and renamed slice_id to chart_id in comments to queries that are run, when the feature flag to enable query logs is enabled 2
- (Tags) Fixed an issue where dashboards with duplicated tags were sometimes not deleting properly
- (Uploads) Corrected a data type on the CSV and Columnar upload forms
1: Available on the Professional and Enterprise plans only.
2: Available on the Enterprise plan only.
Feb 22, 2024
Enhancements and Fixes
- (Embedded) Charts in Embedded dashboards now support the option to View as Table
- (Dashboard) Fixed an issue where dashboards were displaying with the incorrect height
- (Dashboard) Excluded headers from displaying in PDF exports
- (Charts) Big Number charts with currencies now display values on one line
- (SQL Lab) Fixed an issue where Apache Drill queries would return an error if there were no rows returned in the query results
- (Databases) Firebolt now supports connections using Service Accounts
- (Databases)
init_commandscan now be set on MySQL connections - (Security) Improved the display of the Description field of the Row Level Security modal
Feb 15, 2024
Enhancements and Fixes
- (Databases) Fixed an issue where some SSH Tunnel database connections were failing
- (Homepage) The Popular section of the home page no longer shows dashboards in draft status
- (Charts) Custom column formatting now accepts custom d3 format values
- (Charts) Fixed an issue where the table chart type header and content were misaligned
- (Charts) Fixed an issue where the currency symbol was not appearing when the Small Number Format was set
- (Charts) Charts using BigQuery connections no longer display an error if a metric or dimension name contain a special character
- (Charts) Fixed an error where adding margins to horizontal bar charts would add it to the wrong side of the chart
- (Tags) Tags containing colons
:now display properly - (Security) Fixed an alignment issue in the Row Level Security modal
- (Export) Saved queries can now be exported, even if the schema and table fields are not present
February 7, 2024
New Features
- (Security) Added chart id and dataset id as a comment in queries that are run for logging purposes. This feature is currently behind a feature flag, reach out to the Preset team to start using this feature. 1
Enhancements and Fixes
- (Database) Fixed an issue where IBM Db2 database connections were failing
- (Charts) The Time Grain configuration option now appears for the Line Chart (Legacy) and Bar Chart (Legacy), and Area Chart (Legacy) chart types
- (Charts) Filter values dropdowns in the Chart Builder now populate correctly for Athena databases when a NULL value is present
- (Tags) The tag list now properly displays up to 25 tags per page
- (Import) Charts that contain annotation layers will import without error. Annotation layers are not imported with the chart.
1: Available on the Enterprise plan only.
January 24, 2024
New features
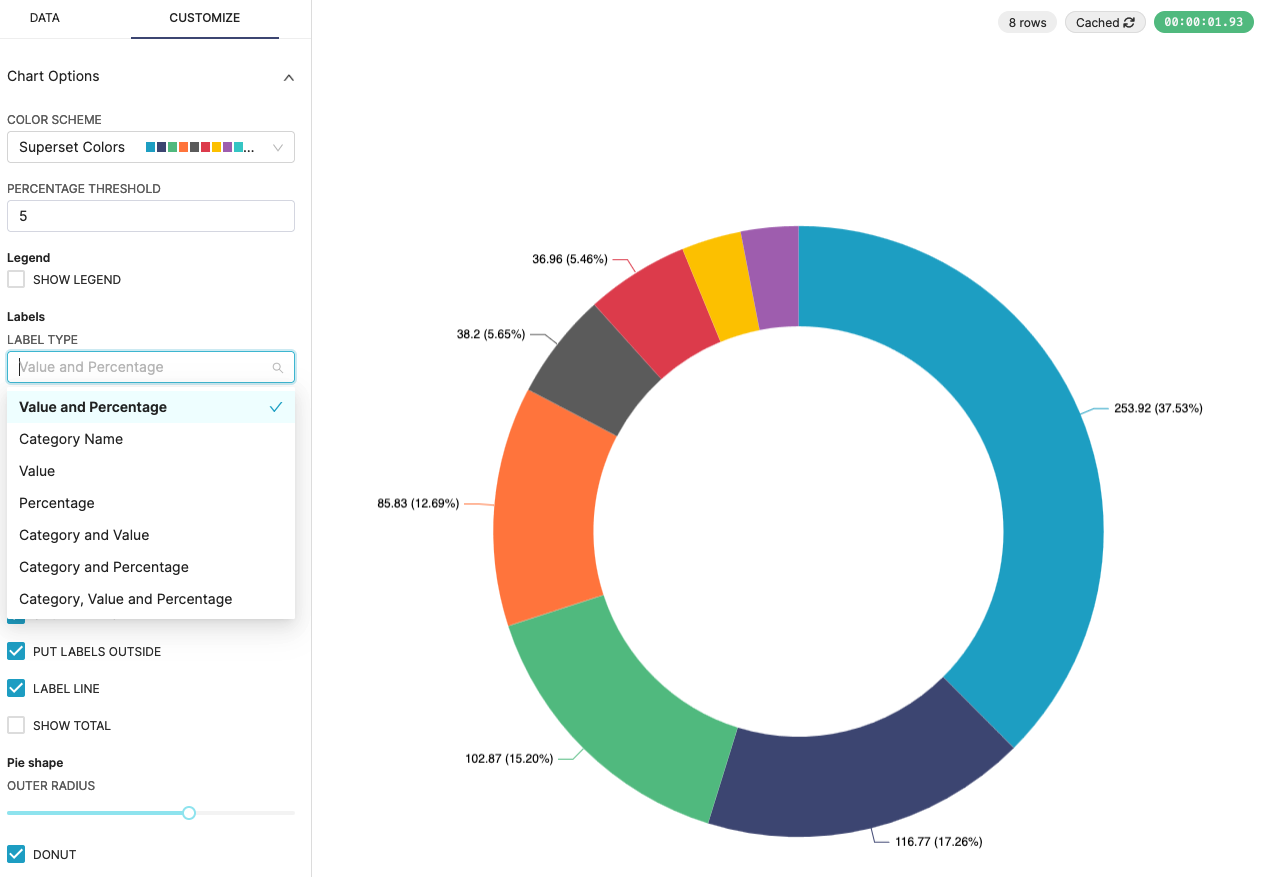
- (Charts) Pie Charts and Funnel Charts have a new “Value and Percentage” Label Type option
- (Databases) Added CelerData StarRocks support
Enhancements and Fixes
- (Dashboards) When dragging charts or layout elements onto a dashboard, we increased the drop area to allow for ease of dashboard creation and editing.
- (Charts) Fixed an issue where the chart menu would be disabled in full screen mode
- (Charts) Added a new control to force numeric x-axis charts to categorical axes. This is disabled by default and can be used in cases where the axis should be sorted in a non-numeric way
- (Charts) Fixed an issue where table charts were not correctly maintaining customizations when metrics were reordered
- (Charts) Charts using the cumsum rolling function that have null values in the data will use zeros in place of nulls to avoid gaps from appearing in the chart
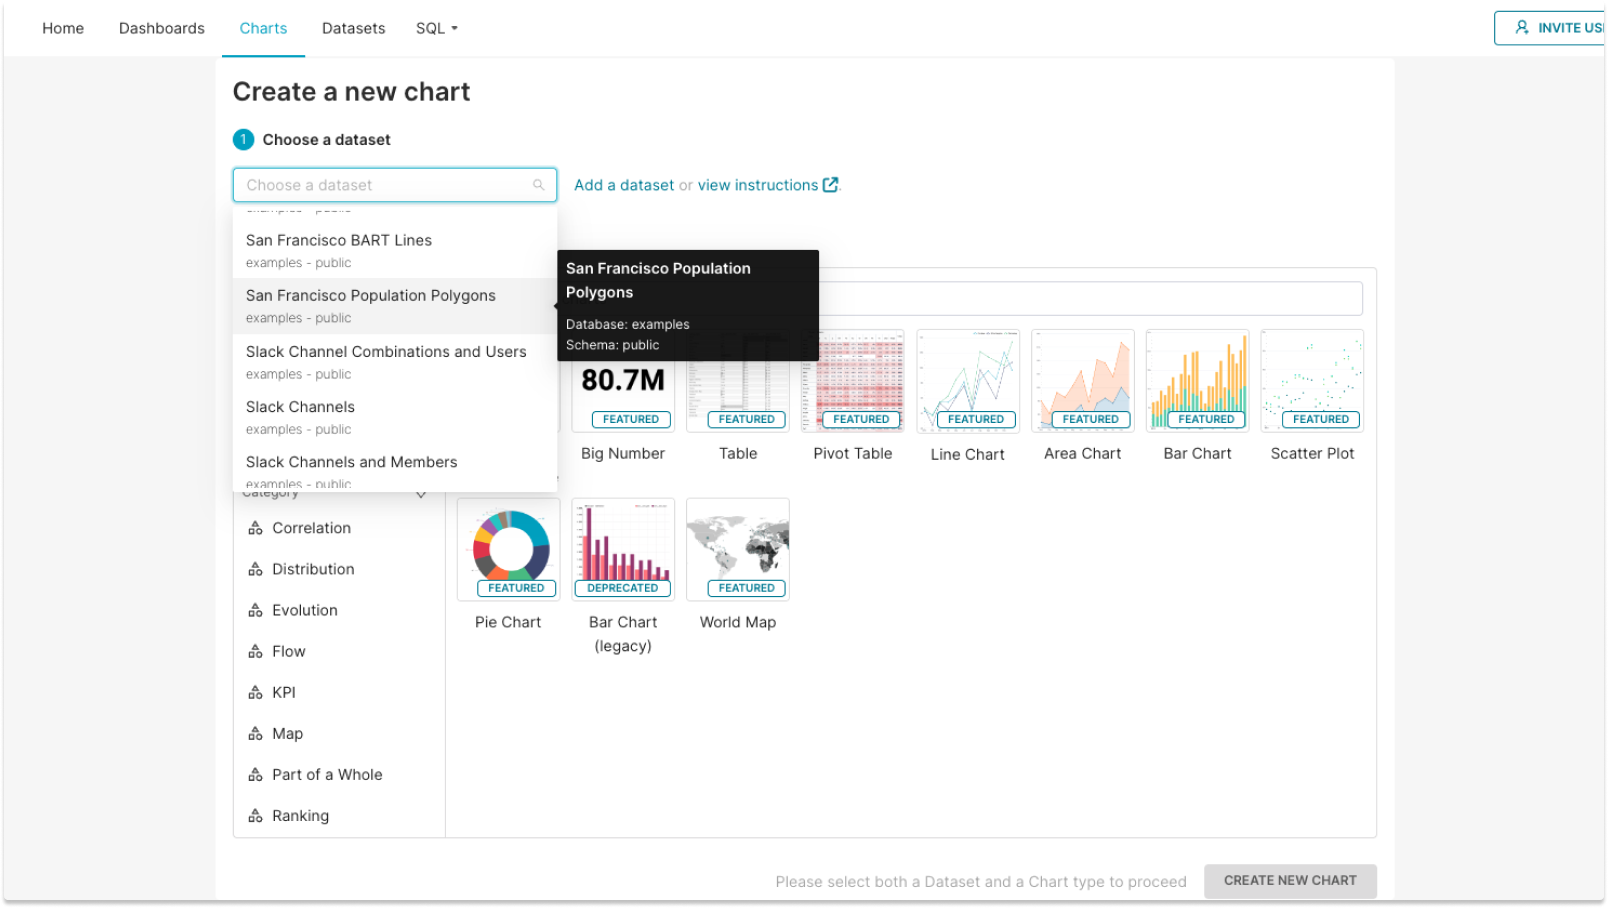
- (Charts) Added example images in the chart selection page for some chart types
- (SQL Lab) We fixed an error that would occur when Trino tables are not found
- (Databases) We enabled the ability to filter databases by UUID via the API
- (Databases) Fixed a DuckDB issue where schema dropdowns were showing multiple instances of the same schema
- (Embedded) We fixed an issue where accessing an embedded dashboard would return a browser console error
- (Embedded) The option to go into fullscreen mode is now hidden in embedded dashboards
January 3, 2024
New features
-
(Chart) Handlebar charts now support CSS.
-
(Tags) The last tile in the pinned tags carousel on the homepage links to a single tag page for the pinned tag, allowing you to easily access other tagged items.
Enhancements and fixes
- (Alerts) We added a tooltip clarifying that alert conditions need to return as double precision numbers.
- (SQL Lab) We resolved an issue preventing hidden SQL Lab tabs from expanding.
- (Dashboard) Titles with special characters now render correctly.
- (Chart) In charts with a numeric x-axis, truncation controls on the x-axis have been added, defaulting to the minimum and maximum values from the data when lower and/or upper bounds are undefined.
- (Chart) Charts now feature a default 90° x-axis label rotation, facilitating the display of labels on the x-axis with numerous data points.
- (Chart) We addressed the intermittent display of 502 errors in some charts.
December 13, 2023
Enhancements and fixes
- (Meta database) We’ve added support for decimals in the meta database.
- (Database) We now offer support for importing a database connection with a version set.
- (Database) We’ve added support for Apache Doris.
- (Dashboard) The dashboard filters now display more filter bar labels before truncation.
- (SQL) You can now edit and save the ad-hoc column labels.
- (Reports) Chart header controls are no longer displayed in reports.
- (Tags) We have enhanced the hover state and redirect functionality of Preset Homepage tags.
December 4, 2023
New features
- (Homepage) Viewers and Dashboard Viewers can now land on the Preset Homepage after visiting a Preset workspace.
- (Database) When deleting a workspace, databases created from file uploads in the workspace (e.g., CSV file uploads) are automatically deleted.
Enhancements and fixes
- (Database) We've updated the
versionfield in the database configuration modal to be a string field instead of the previous number field. - (SQL Lab) We now display
Durationas a separate column in the "Query History" view instead of as a tooltip on theTimecolumn. - (Chart Builder) We fixed an issue in which pasting a value into a filter did not retain the value, causing an error when running the chart.
- (Dashboard) We have improved the rendering performance of dashboard filters by reducing over-rendering.
- (Tags) We made UI updates to enhance the experience of using tags in the Preset Homepage, including pinning tags in the order they were selected in the "Manage Tabs" modal.
- (Tags) We've fixed an issue where the tag creation form is sticky (retains the previously created tag’s name) by clearing it by default.
- (Tags) We fixed the issue so that a user without appropriate permission cannot see the "Create Chart" button or the "Pin Tags" option in the "Manage Tabs" modal.
- (RLS) We renamed the "tables" field to "datasets."
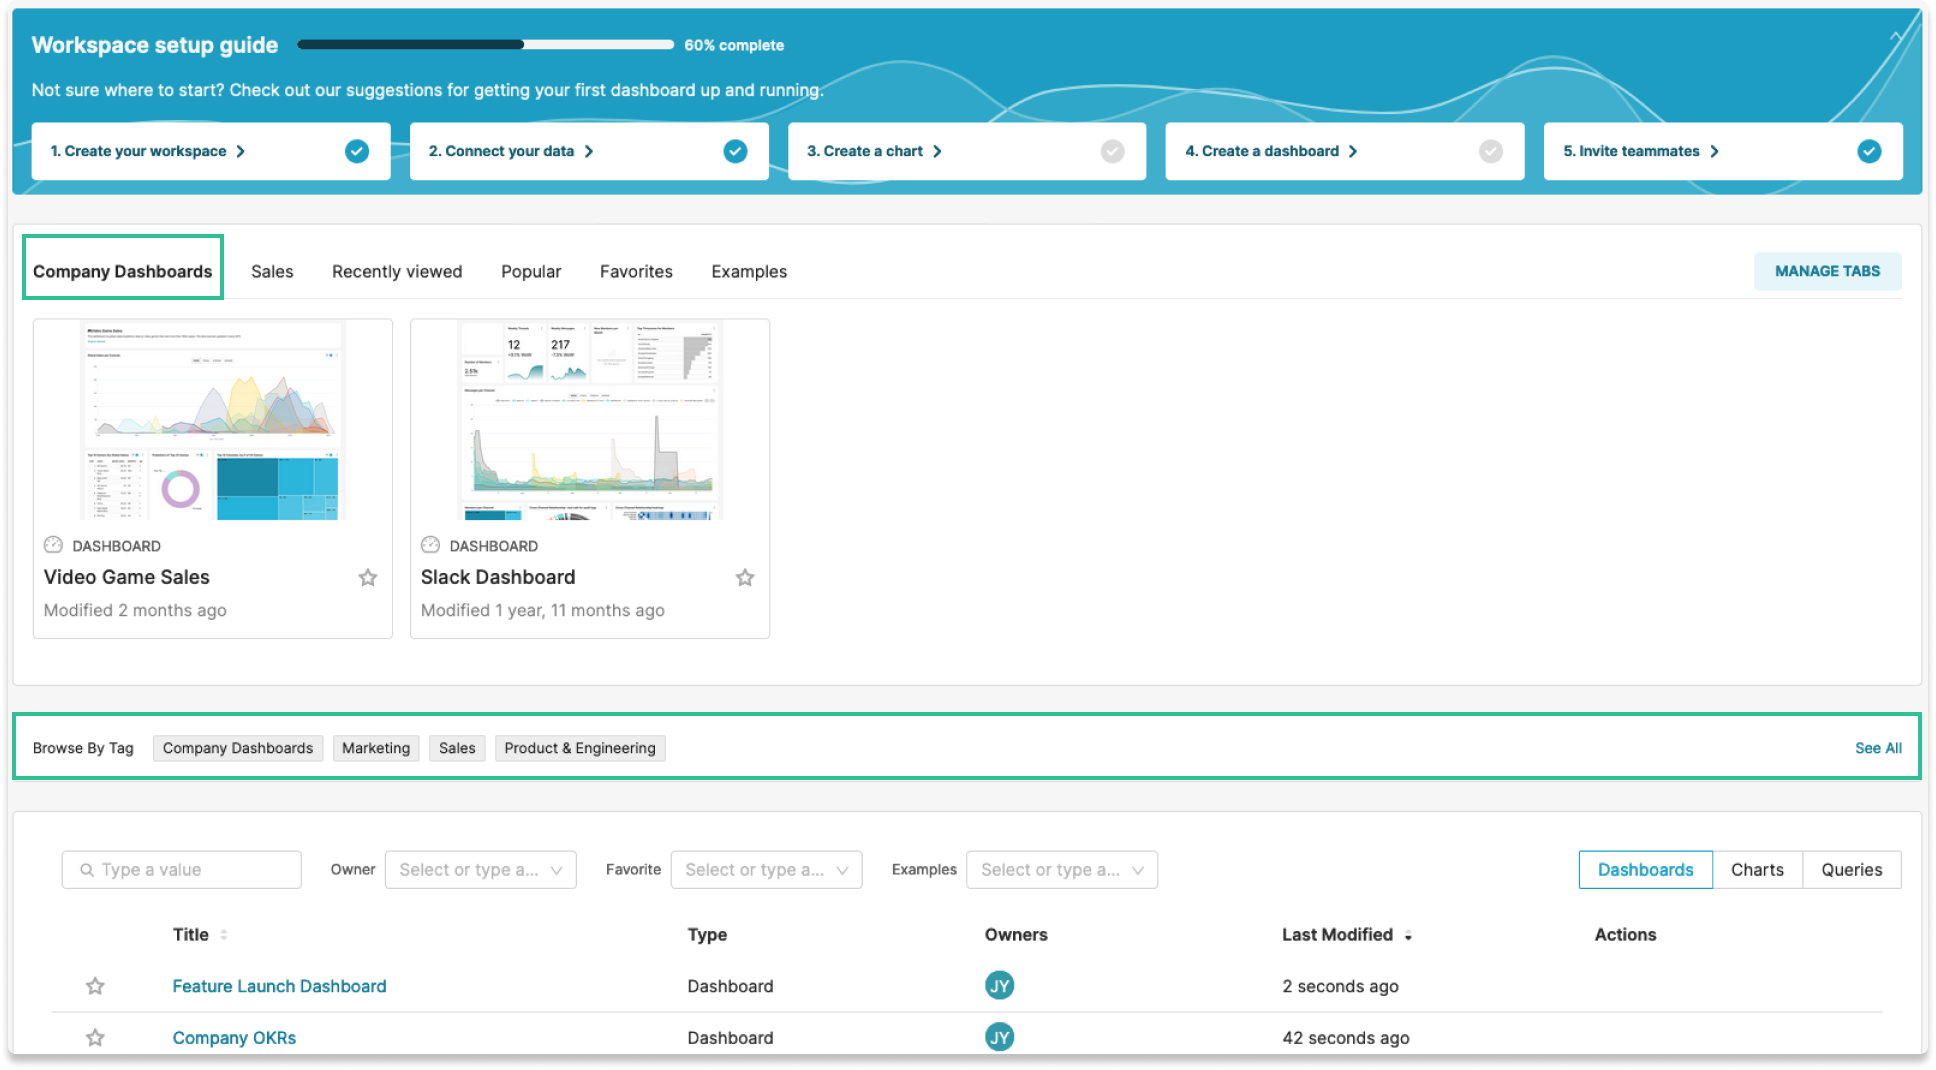
November 15, 2023
Highlight
Instantly access a collection of charts and dashboards from the Preset Homepage using tags. You can now browse your organization’s tags or pin them as quick-access tabs on your homepage, allowing you to easily access or discover content relevant to your work.
New features
- (SQL Lab) The "Format SQL" feature is now available to help you format SQL code in the query editor. You can also access the feature through a shortcut, ctrl + shift + f.
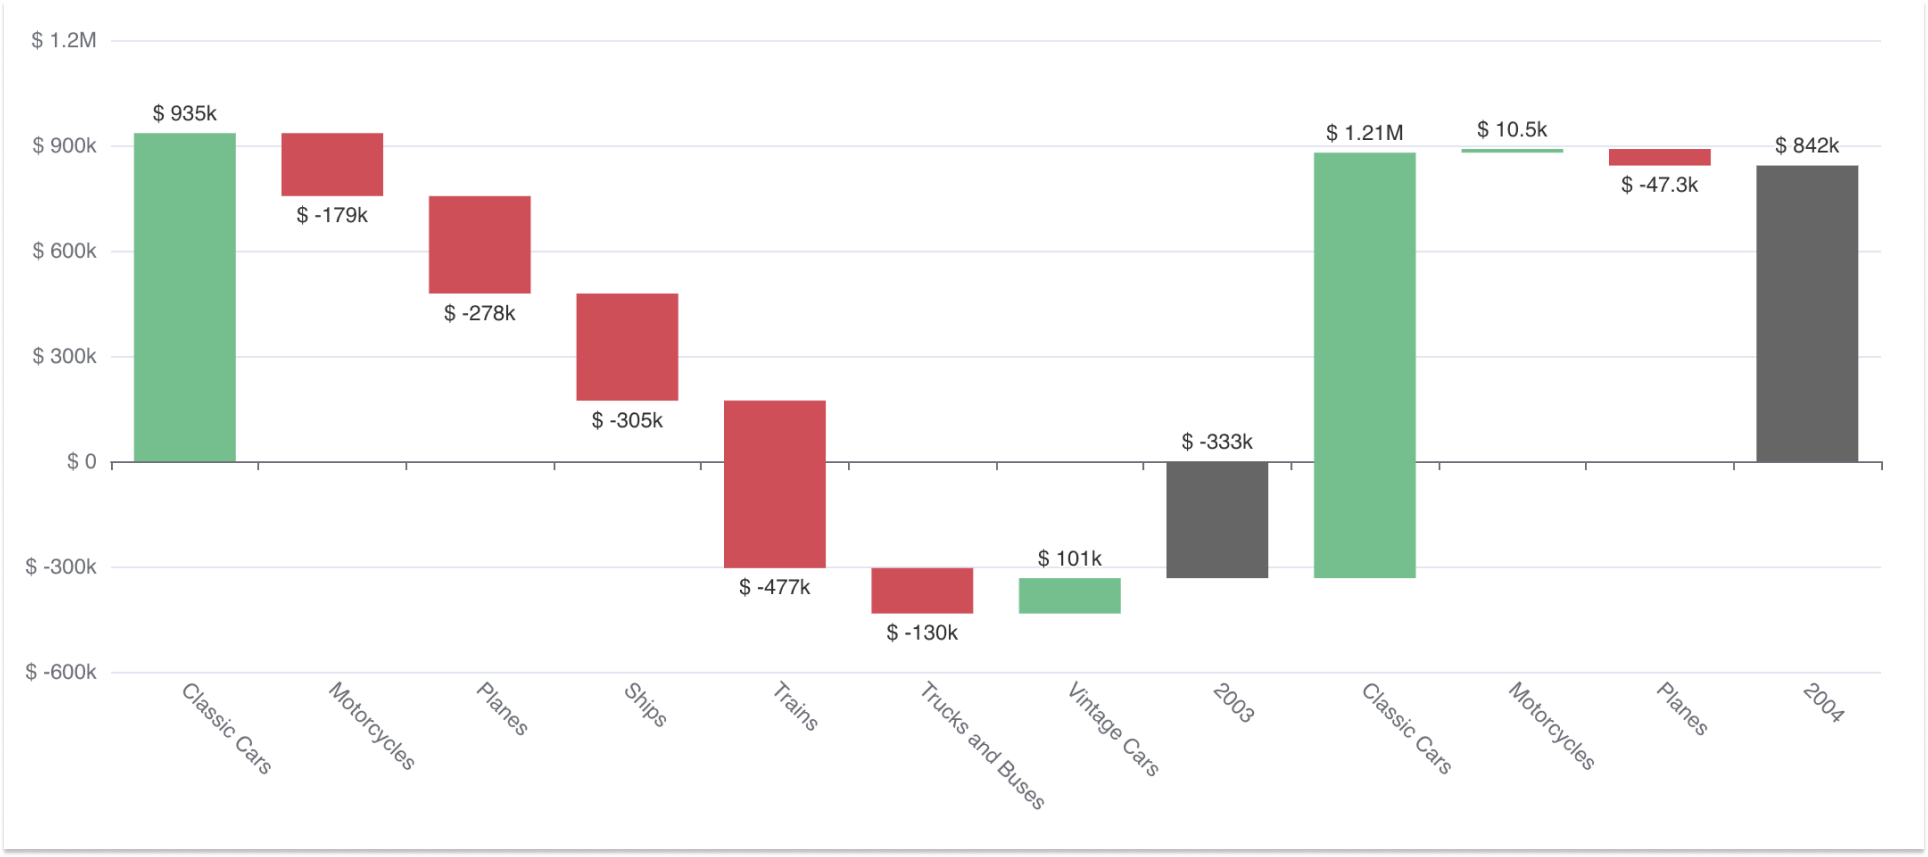
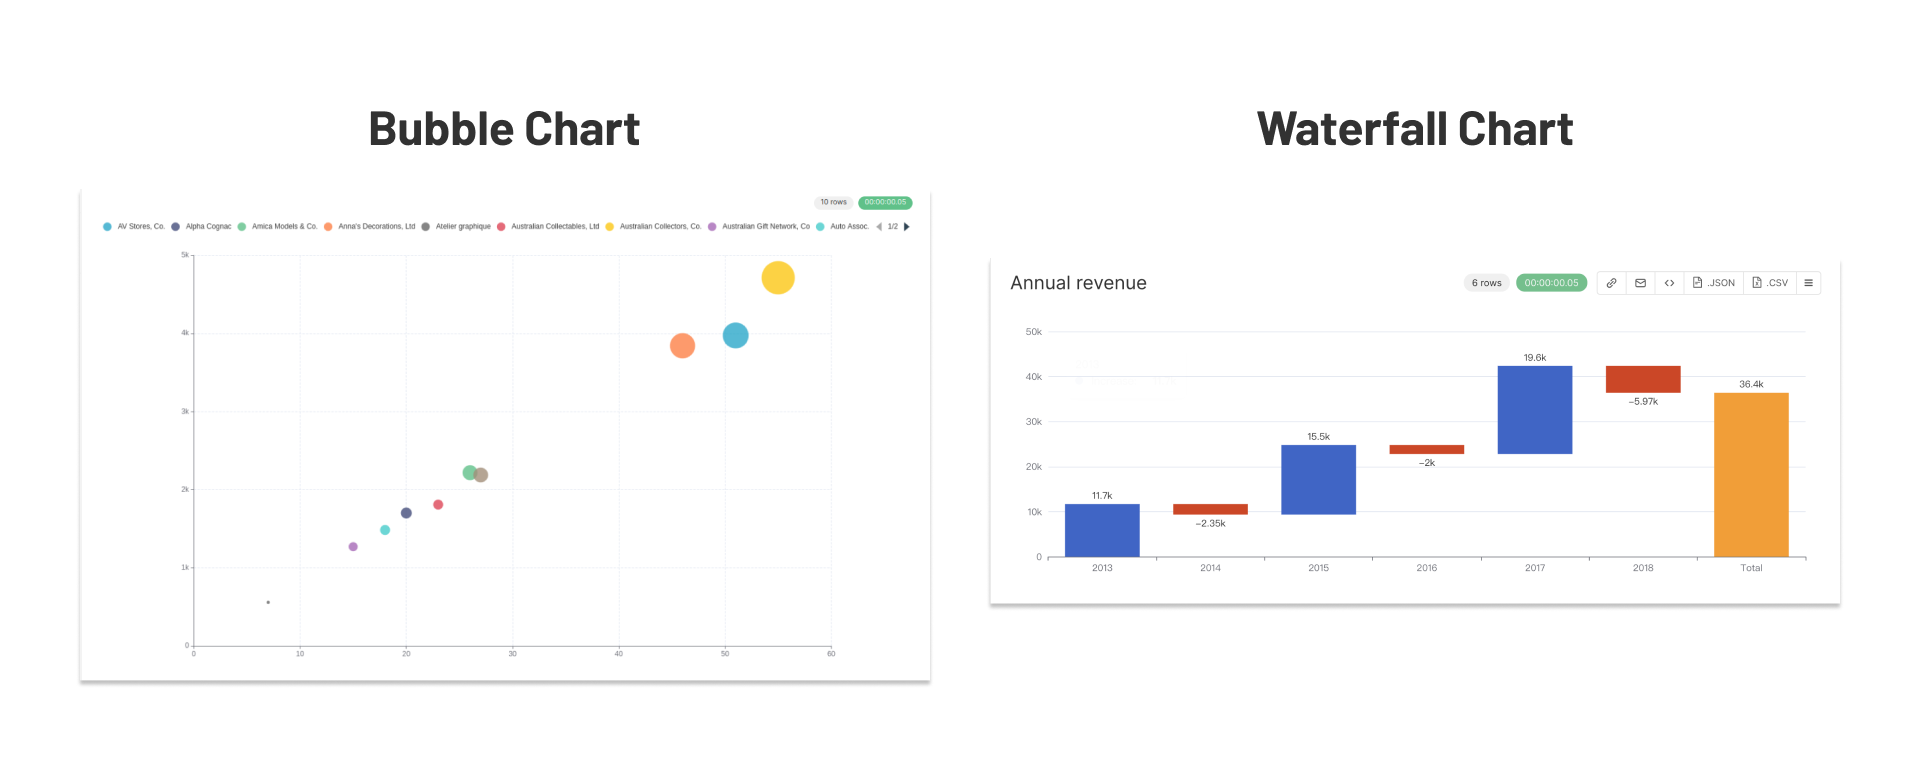
- (Chart) We have made enhancements to the waterfall chart type, including support for a non-temporal x-axis, series color selection, currency and time formatting, and the ability to use mixed data types in the x-axis.
- (Homepage) Users with Viewer or Dashboard Viewer access now land on the Welcome Homepage upon logging into Preset, facilitating easier navigation and onboarding.
Enhancements and fixes
- (Dashboard) We’ve fixed an issue with the dashboard filter where the "Apply Filters" button remained disabled after clearing a single-value existing filter.
- (Chart) We fixed an issue with a time grain filter applied to a dataset that uses Jinja templating.
- (Chart) We fixed an issue where you couldn't save a mixed chart with a chart-level time filter when dashboard filters were in use.
- (Dataset) You can now view the full SQL query in the "Edit dataset" modal, regardless of its length, making it easier to validate the query.
- (RBAC) We fixed an issue where a user unintentionally became a chart owner when they added a chart to a dashboard they didn't want.
To learn more about the features and enhancements included in this release, visit Apache Superset Pull Request.
November 1, 2023
Highlights
Organize and discover relevant charts and dashboards with content tags
Tags are now available to help you organize your charts, dashboards, and saved queries in Preset and facilitate easier discovery, access, and collaboration among your team. Learn how to use tags.
New features
-
(SQL Lab) We have added a "keyboard shortcuts" helper in SQL Lab to make it easier to look up and use shortcuts.
-
(Chart Builder) Database and schema names are now visible when choosing a dataset for chart creation.
-
(Chart) You can now customize or disable tooltips for the funnel chart type.
Enhancements and fixes
- (Dashboard) Tooltips for filters in the horizontal bar are no longer truncated.
- (SQL Lab) You can now open SQL Lab in a new browser tab when selecting "View in SQL Lab" from the charts.
- (Import) We have ensured that old data source IDs are not referenced when importing charts into your Preset workspaces.
- (Navigation Bar) We fixed an issue where the previous tab on the top navigation bar was highlighted when you landed on the "database" page.
To learn more about the features and enhancements included in this release, visit Apache Superset Pull Request.
October 18, 2023
New features
- (Chart) We’re introducing two new chart types in Preset: Waterfall charts and Bubble charts.
Enhancements and fixes
- (Chart) We now support the ContourLayer in deck.gl charts.
- (Chart) We fixed the country borders in the India Country Map.
- (Dashboard) We fixed issues where dates were not being formatted correctly in dashboard filters.
- (Dashboard) All values in the column are displayed in the datetime (dttm) format in the dashboard filters when
python_date_formatis set for a column. - (Dashboard) Dashboard filters now render more quickly.
- (Dataset) We improved the error messages for saving datasets for easier troubleshooting.
- (SQL Lab) The “Save” button no longer flickers.
- (SQL Lab) We fixed the issue with icon alignment in the database/schema side menu bar.
- (Alerts and Reports) We removed the duplicate items that appeared in the “Alerts and Reports” modal.1
- (Row level security) In the “Add Rule” modal, we fixed the alignment issue with the “Add” and “Cancel” buttons.
1: Available on the Enterprise and Professional plans only.
To learn more about the features and enhancements included in this release, visit Apache Superset Pull Request.
October 4, 2023
New features
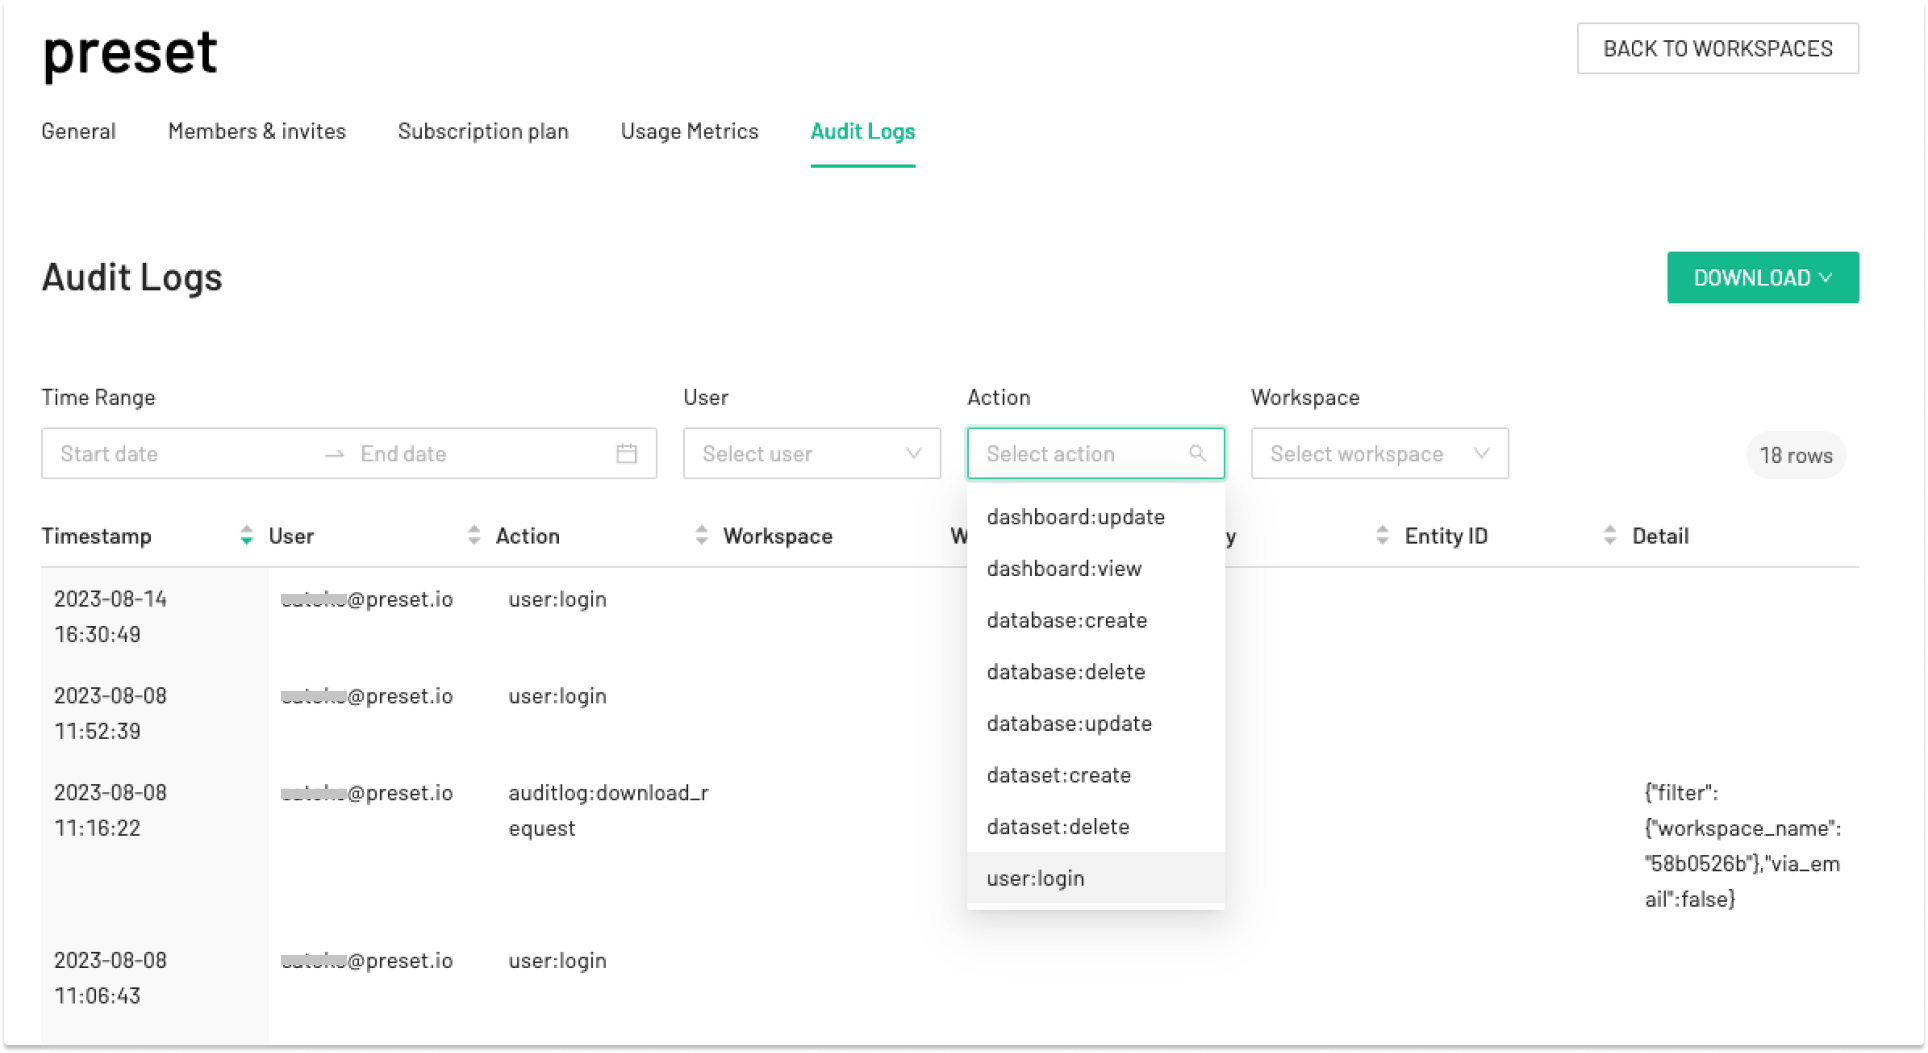
- (Audit logs) The following events are now available in the audit logs1
- Downloading dashboards
- Downloading charts from dashboards and from Chart Builder
- Downloading saved queries
Enhancements and fixes
- (Dashboard) When an existing RLS is updated, the changes are now reflected in dashboard filter configurations immediately.
- (Chart) We fixed an issue with using custom SQL columns as the x-axis.
- (Chart Builder) We fixed the issue in which you could not remove a chart filter on a chart placed on a dashboard with an active dashboard time range filter.
- (SQL Lab) The command
is_selectworks withUNION. - (Alerts and reports) We fixed the issue in which scheduled alert/report email notifications were intermittently missed or sent in duplicates.
- (Reports) Reports are now correctly executed.
- (Other) You can now export charts to Excel files with columns containing date/time with time zones.
1: Available on the Enterprise plan only.
To learn more about the features and enhancements included in this release, visit Apache Superset Pull Request.
September 20, 2023
New features
- (SQL Lab) You can now see the SQL queries in the results panel.
- (Dashboard) Viewer and Dashboard Viewer workspace roles can now generate dashboard perma links to easily share dashboards with others.
Enhancements and fixes
- (Database) When uploading CSV files, columns with international timestamps (i.e., days before months) are correctly imported.
- (Database) The placeholder values for the "Account" and "Database" fields on the Snowflake dynamic form display correctly.
- (Chart Builder) Clearing the currency format in the "Customize Tab" no longer affects the currency format displayed in the chart.
- (Chart Builder) The currency format is now applied to a table chart immediately without the need to select the number format.
- (Chart Builder) In Treemaps, number and currency formatting no longer apply to numeric chart labels.
- (Chart Builder) We fixed the issue in which all available filter options (rather than only those selected) apply to a chart when filters are set to "Dynamically Search All Filter Values."
- (Chart) Dashboard time range filters now work correctly on charts that are initially updated with dashboard time range filters but are subsequently overwritten with new chart configurations.
To learn more about the features and enhancements included in this release, visit Apache Superset Pull Request.
September 6, 2023
New features
- (Database) You can now create a new database using the
superset://SQLAlchemy URI, allowing you to create a custom database by joining data from multiple databases or moving data from one database to another. Reach out to the Preset team to start using the feature (which is currently behind the feature flag).
*Note: Read a few tips to avoid running expensive queries.
Enhancements and fixes
- (Database) We now support the Spectrum-enabled Amazon Redshift driver,
redshift+spectrum. - (Datasets) We introduced a checkbox in the “Edit Dataset” modal which requires you to opt into normalizing new dataset column names (i.e., allow column names to be case insensitive format).
- (Dashboard) We fixed an issue where dashboard filter names were overflowing from the hover modals.
- (Dashboard) Custom URL parameters are now preserved when toggling between normal and full-screen sizes.
- (Dashboard) We have ensured that access to a dataset is granted within the confines of dashboard filters when a user is granted access to the dashboard via dashboard RBAC.
- (Embedded dashboards) We have ensured that embedded dashboard viewers can properly see all visualizations in the dashboard (i.e., Role-based access is granted within the confines of the embedded dashboard).
- (Embedded dashboards) Dashboards now load correctly when the URL contains a trailing “/” (slash).
- (Chart) Conditional formatting properly works on cells with a value of 0.
- (Chart) You can set the default format to the Heatmap using the Time Format control.
- (Chart) The Calendar Heatmap accounts for timezone differences and correctly displays data for the specified time/dates.
- (SQL Lab) We fixed an issue so that the cursor (the scroll position) remains fixed after running a query.
To learn more about the features and enhancements included in this release, visit Apache Superset Pull Request.
August 23, 2023
Highlights
Troubleshoot issues and ensure regulatory compliance with audit logs1. Admins can now track the team’s activities in Preset, such as workspace access, chart and dashboard updates (create/view/edit/delete), permission changes, and data download, from the past 30 days. Learn more.
Enhancements and fixes
- (Database) You can now connect MotherDuck, a cloud version of DuckDB, through SQL Alchemy.
- (Chart) We fixed an issue in which tooltips did not disappear on the Heatmap chart.
- (Chart) We fixed a bug in which the dataset names were being displayed as links inside the tooltips of dashboard chart cards.
- (Chart) You can now add column and row subtotals in pivot tables.
- (Chart) We added 5 Central Asia countries (Kazakhstan, Kyrgyzstan, Tajikistan, Turkmenistan, and Uzbekistan) to the country map chart.
- (Chart Builder) We added currency controls in the control panels of the Chart Builder.
- (Chart Builder) We clarified the various types of "save" actions for charts in the Chart Builder.
- (SQL Lab) When writing long queries, the keyword tooltip now displays complete keyword names without collapsing them.
- (Docs) We added README for database engine specifications which describe all their features and functionality. We also added a new command to test database engine specs, SQLAlchemy dialects, and database connections.
To learn more about the features and enhancements included in this release, visit Apache Superset Pull Request.
August 9, 2023
New features
- (Chart) Your legacy chart types are automatically updated to the new chart types when you import them into Preset from Superset (and vice versa).
Enhancements and fixes
- (Chart) In deck.gl's Path and Polygon charts, we updated the default unit of line width from meters to pixels to make the line more visible in large-scale maps.
- (Chart) In tooltips, hovered data series are no longer highlighted.
- (Dataset) You can now update the
dataset_uuidin exported YAML files to point charts to a different dataset, and reimport the file to overwrite your chart. - (Dataset) We fixed the
schemato be passed to a virtual dataset created from SQL Lab. - (Dataset) You can now create datasets from tables that contain slashes in their table names.
- (Dataset) We improved the performance of the dataset creation flow for database schemas containing more than 10,000 tables.
- (Dashboard) We resized the width of the modal for setting up dashboard filters.
- (Dashboard) We fixed an error that occurs when you delete dashboard filters that are in use.
- (SQL Lab) We fixed the margin style of the horizontal scroll bar for the query results.
To learn more about the features and enhancements included in this release, visit Apache Superset Pull Request.
July 26, 2023
New features
- (SQL Lab) We introduced a new shortcut (
ctrl + shift + enter) to automatically detect the range of the current query, select, and run it more easily.
Enhancements and fixes
- (Database) We fixed the issue where SSH tunnels could not be created through the UI modal. 1
- (Database) We fixed an issue where users were unable to edit databases that have SSH tunnels configured.1
- (Dataset) When importing datasets, the
extrakey for datasets functions even if it has an empty string (extra: ""). - (Dashboard) Dashboard filter validation and the “Clear All” feature only apply to filters in scope.
- (Dashboard) We made improvements to avoid repeated colors in the same charts on dashboards that had shared labels across tabs.
- (Chart) The time grain filters on dashboards are now correctly applied to the pivot tables.
- (Chart) You can no longer add a chart to a dashboard not owned by the chart owner.
- (Report) We brought back the ability to edit an existing report without specifying the custom width.2
1: Available on the Enterprise plan only.
2: Available on the Enterprise and Professional plans only.
To learn more about the features and enhancements included in this release, visit Apache Superset Pull Request.
July 12, 2023
Highlight
- Preset charts now support multiple currency formats. You can configure the currency format for saved dataset metrics and display it in selected charts1. Supported currencies include
"USD", "EUR", "GBP", "INR", "MXN", "JPY", "CNY", and more.
New features
- (Alerts & reports) You can now customize the screenshot width of alerts and reports.
Enhancements and fixes
- (Database) We added connection support for the DuckDB database.
- (Database) Column names have been denormalized as applicable, allowing dashboard filters to function correctly on datasets created from the Oracle database.
- (Dashboard) We resolved the issue of infinite loading errors that occurred when the horizontal dashboard filter contained the first filter value out of scope.
- (Dashboard) We fixed the issue where the dashboard time filter sometimes did not work properly on a chart newly added to a dashboard.
- (Dashboard) We’ve improved the dynamic numeric search in dashboard filters to return more accurate results.
- (Chart) We fixed an issue where a new dataset saved from SQL Lab displayed an error in Chart Builder.
- (Chart) The totals in stacked charts now calculate correctly when interacting with the legend.
- (Chart) Double-clicking a series value in stacked charts exclusively selects the series.
- (Chart) Big numbers are now rendered properly in all charts.
- (Chart) We fixed the error that occurred when searching for a dashboard in the chart list view.
- (Chart Builder) Metric names are no longer truncated in tooltips in Chart Builder.
- (SQL Lab) We have re-enabled sharing of the saved queries.
1 Current formatting is supported in the following charts today: Area Chart, Line Chart, Big Number Chart, Funnel Chart, Gauge Chart, Heatmap, Line Chart, Mixed Chart, Pie Chart, Pivot Tables, Smooth Line Chart, Stepped Line Chart, Sunburst Chart, Tables, Treemap, WorldMap.
June 28, 2023
Highlights
-
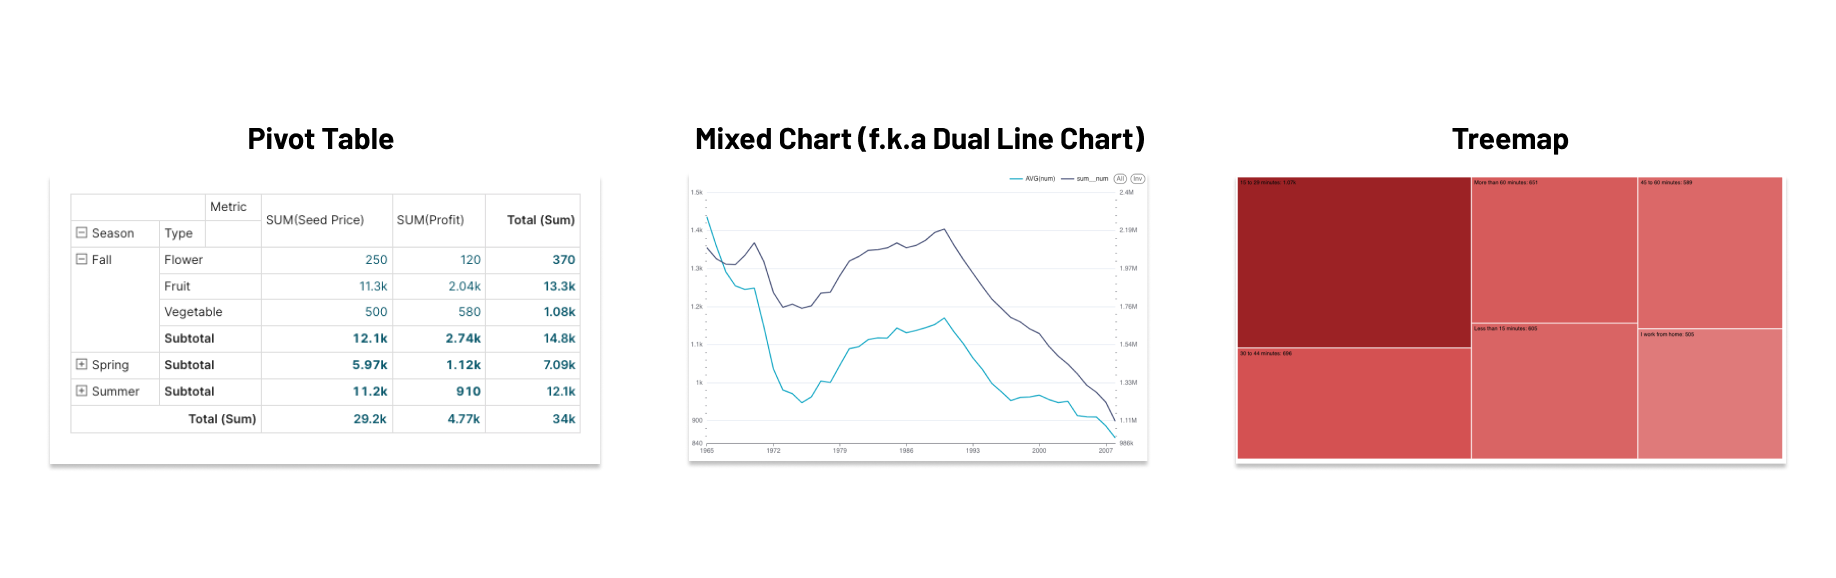
We have deprecated three chart types: the (old) Pivot Table, Dual-Line Chart, and the (old) Treemap. The existing charts created with the old chart types in your workspaces have been automatically migrated to the new chart types, the (new) Pivot Table, Mixed Chart, and the (new) Treemap. See here to learn more about the differences between the new and old chart types.
-
We migrated the following api/v1 endpoints in preparation for Superset 3.0 upgrade.
| Old Path | New Path |
|---|---|
| /superset/slice_json/ | /api/v1/chart/int:id/data/ |
| /superset/annotation_json/ | /api/v1/chart/int:id/data/ |
| /superset/recent_activity/ | /api/v1/log/recent_activity/<user_id>/ |
| /superset/fave_dashboards_by_username/ | /api/v1/dashboard/favorite_status/ |
| /superset/fave_dashboards/ | /api/v1/dashboard/favorite_status/ |
| /superset/created_dashboards/ | /api/v1/dashboard/ |
| /superset/user_slices/ | /api/v1/chart |
| /superset/created_slices/ | /api/v1/chart |
| /superset/fave_slices/ | /api/v1/chart |
| /superset/favstar/ | /api/v1/dashboard, api/v1/chart//favorites/ |
| /superset/get_or_create_table/ | /api/v1/dataset/get_or_create/ |
| /superset/sqllab_viz/ | /api/v1/dataset/ |
| /superset/stop_query/ | /api/v1/query/stop |
| /superset/queries/ | /api/v1/query/updated_since |
| /superset/search_queries/ | /api/v1/query/ |
| /superset/copy_dash/int:dashboard_id/ | /api/v1/dashboard/<dash_id>/copy/ |
| /superset/save_dash/int:dashboard_id/ | - |
| /superset/add_slices/int:dashboard_id/ | /api/v1/chart/ |
| /superset/testconn | /api/v1/database/test_connection/ |
| /superset/validate_sql_json/ | /api/v1/database/validate_sql/ |
| /superset/schemas_access_for_file_upload | /api/v1/database/{pk}/schemas_access_for_file_upload/ |
| /superset/extra_table_metadata/ | /api/v1/database/int:pk/table_extra/<table_name>/<schema_name> |
| /superset/available_domains/ | /api/v1/available_domains/ |
| /superset/estimate_query_cost/ | /api/v1/sqllab/estimate/ |
| /superset/results/ | /api/v1/sqllab/results/ |
| /superset/sql_json/ | /api/v1/sqllab/execute/ |
| /superset/csv/ | /api/v1/sqllab/export/ |
| /superset/tables/int:db_id/ | /api/v1/database/int:pk/tables/ |
| /superset/filter/<datasource_type>/int:datasource_id/ |
/api/v1/datasource/<datasource_type>/ |
| /superset/datasources/ | /api/v1/dataset/ |
Enhancements and fixes
- (Chart) Table charts now support hyperlinks.
- (Chart) You can manually adjust the lower bound of the y-axis to extend the logarithmic limit beyond 10 when a set of series contains zero values.
- (Chart) In deck.gl’s scatterplot chart, the size of the circles now correctly adjusts after changing the radius values.
- (Chart) In deck.gl’s Geojson chart, you can now select the line width unit in meters or pixels to properly display the line path
- (Chart) The Time Shift feature in Chart Builder works when joining queries with different time granularity.
- (Dataset) We added a tooltip to clarify
metric_namein the “Edit Dataset” modal. - (Database) We fixed the issue with the expansion/collapsing dropdown in the “Advanced” tab of the database modal.
To learn more about the features and enhancements included in this release, visit Apache Superset Pull Request.

June 26, 2023
Product Announcement
Preset now integrates with dbt Cloud via its user interface1, enabling data teams to define data models (databases, datasets, and metrics) as version-controlled assets within dbt Cloud and to synchronize them with Preset Cloud. While we have been supporting integration with dbt Cloud and dbt Core through Preset CLI for some time, the new feature allows you to seamlessly sync the two tools via UI. Learn more here.
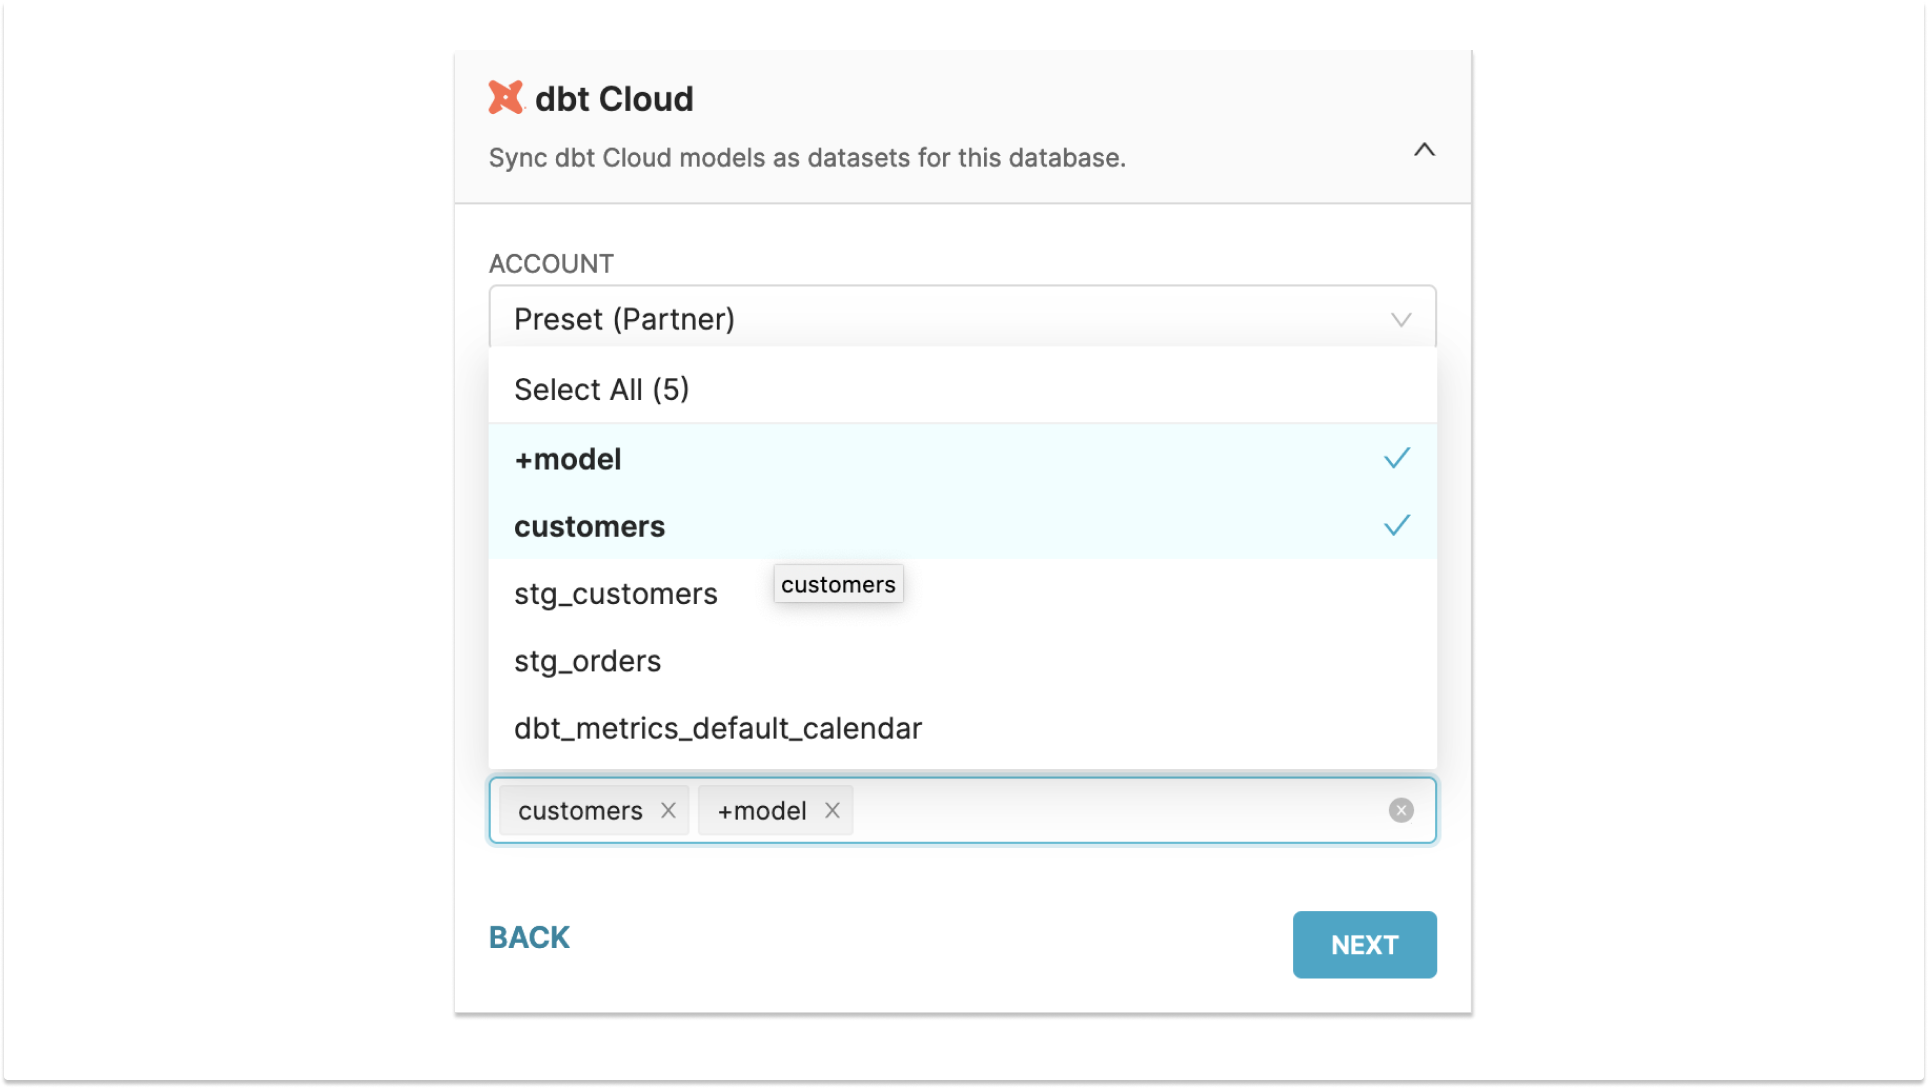
1 The feature is available for teams on Preset’s Enterprise plan.
June 1, 2023
New features
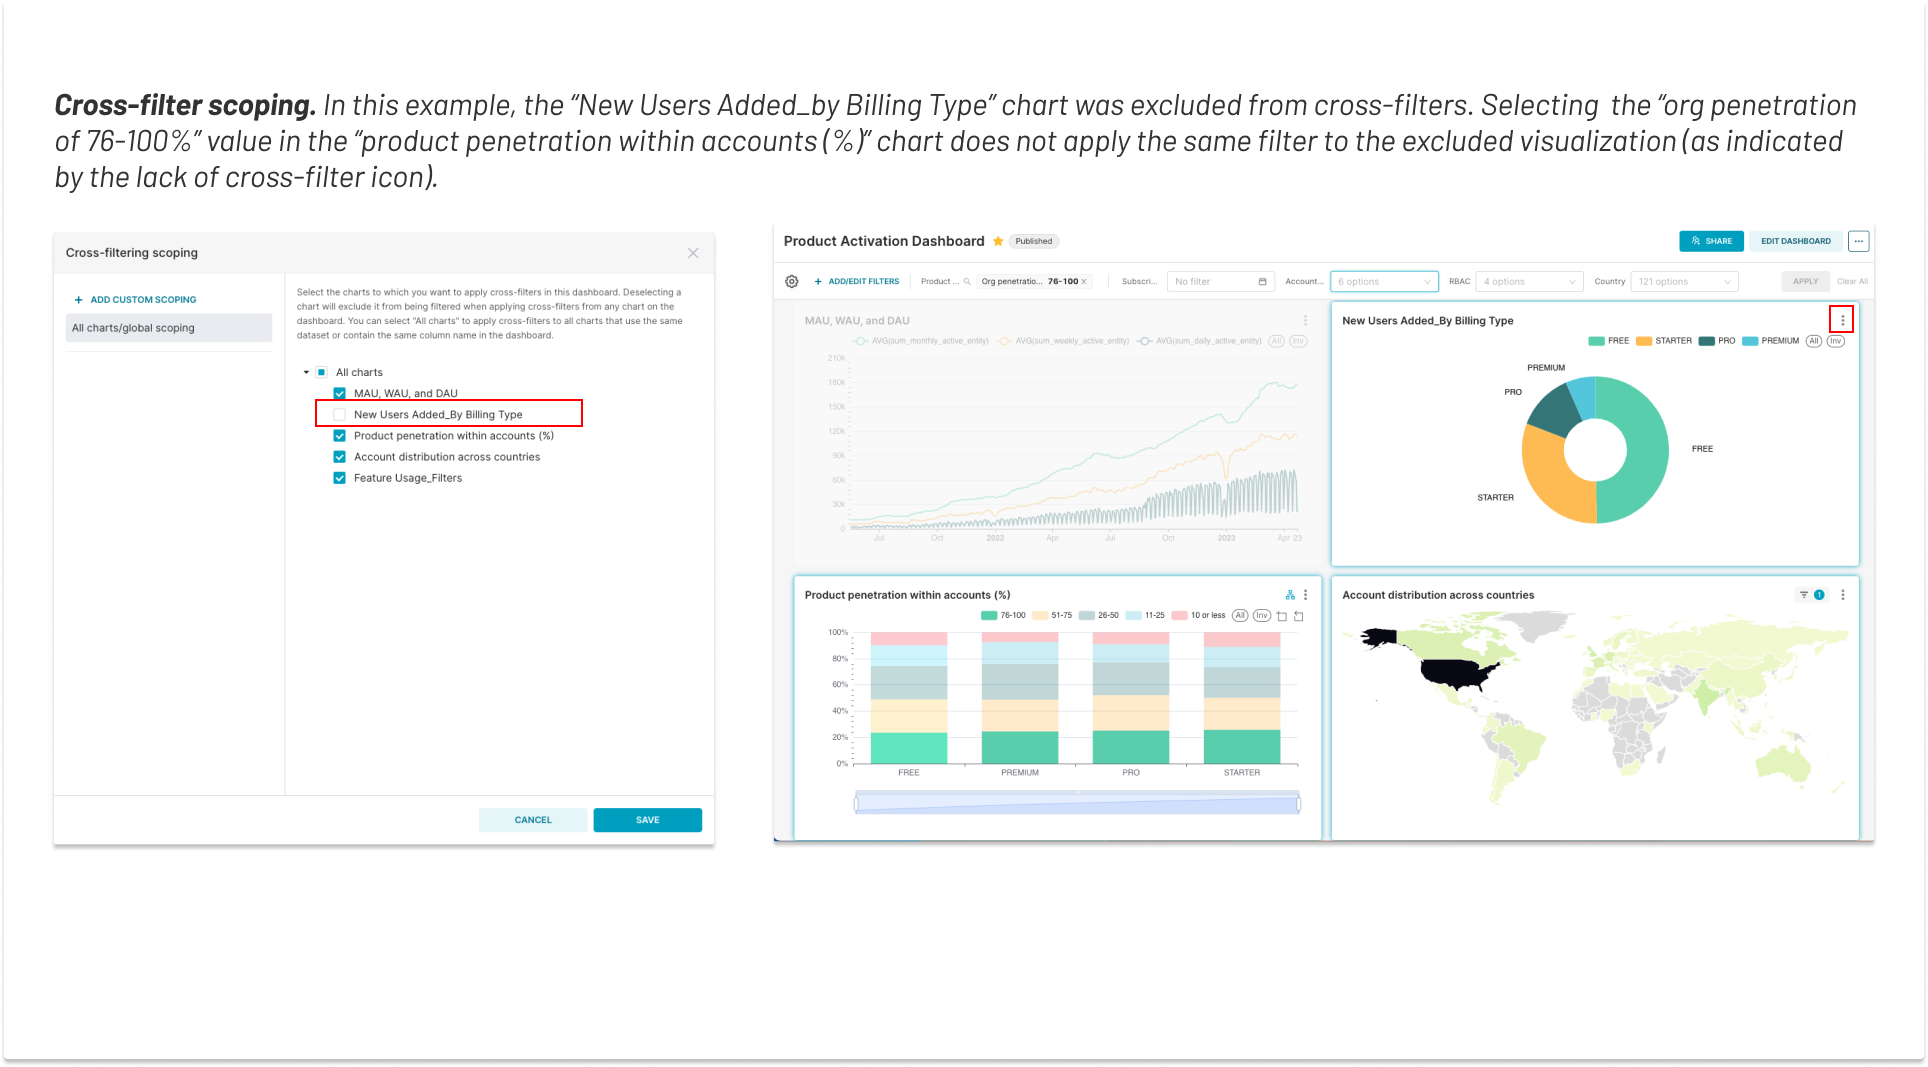
- (Dashboard) You can now control which visualizations in the dashboards are impacted by cross-filters using “Cross-filtering scoping.”
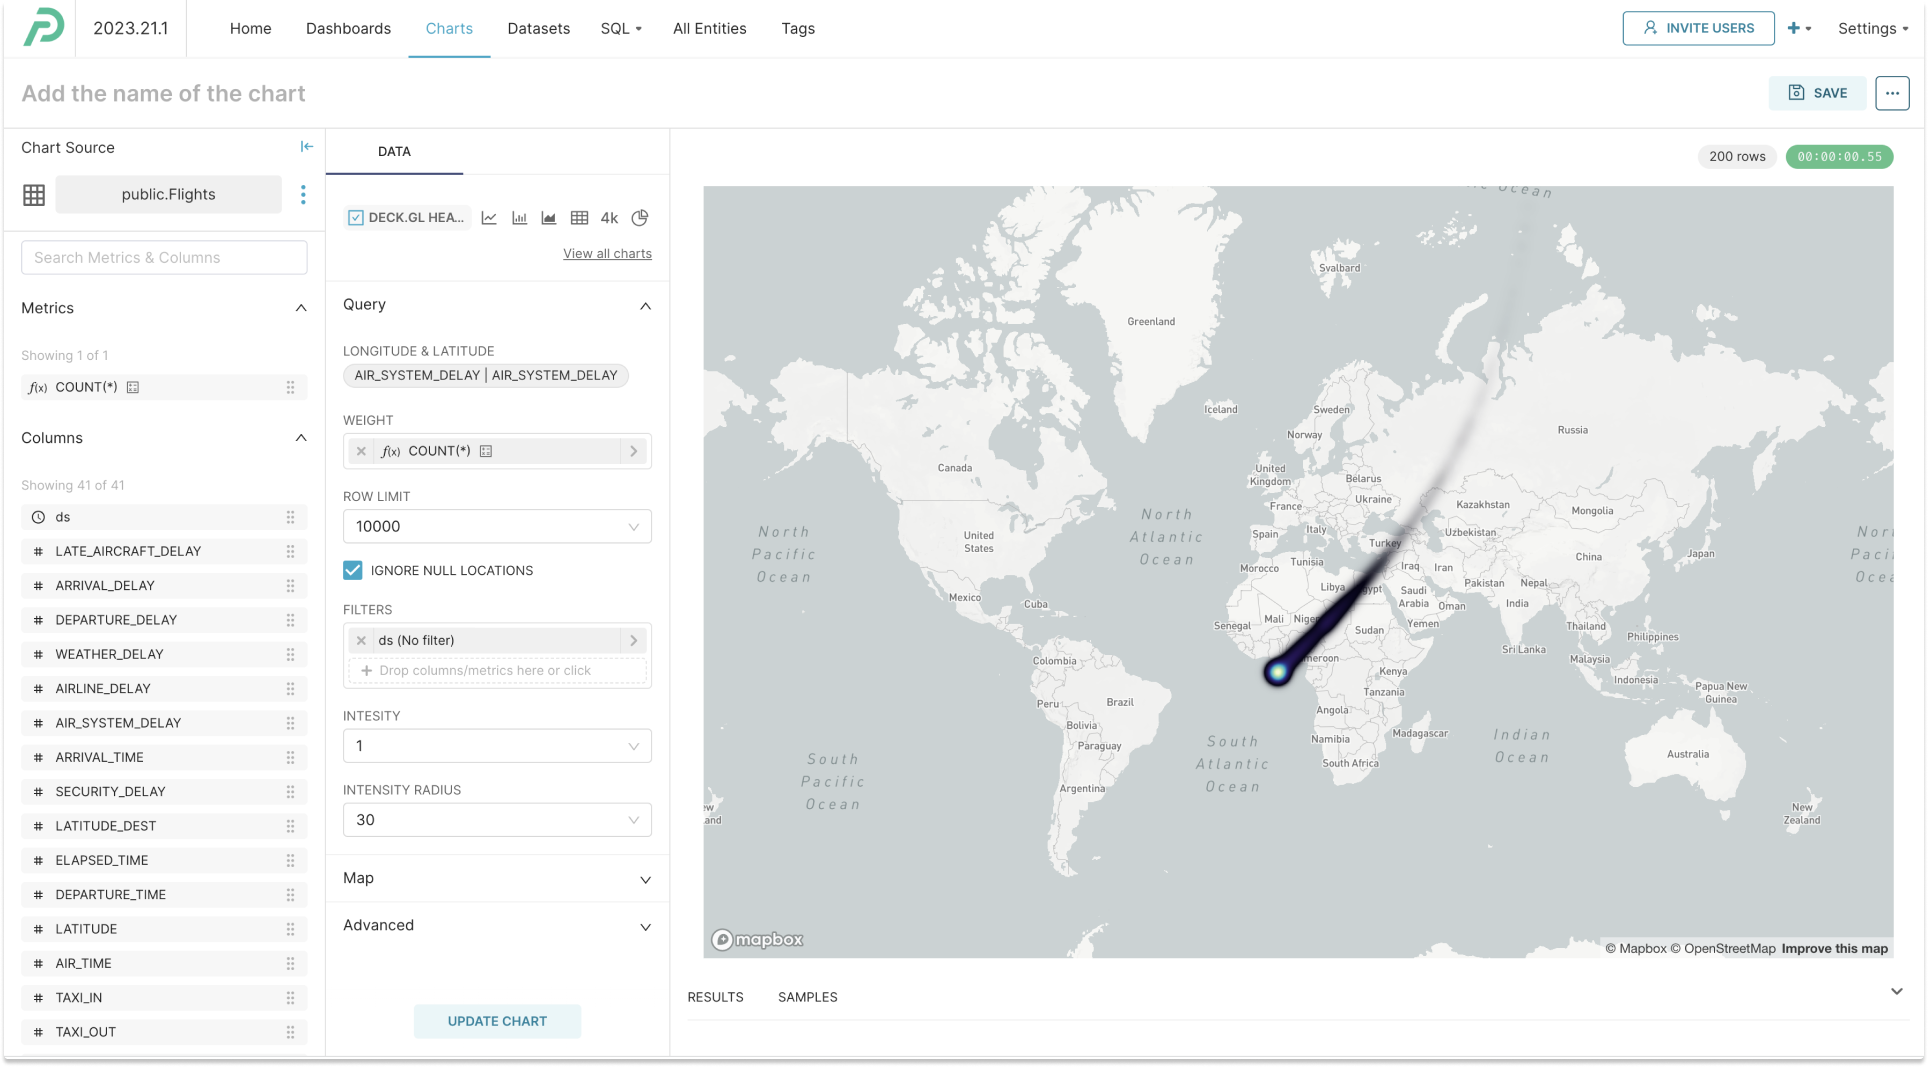
- (Chart) Deck.gl’s heatmap chart is now available in Preset.
Enhancements and fixes
- (Dashboard) You can now export individual charts on dashboards in Excel (.xlsx) file format.
- (Chart Builder) You can now see more details about the data types in a tooltip when you hover over the “#” and “abc” icons of the type column options in the “metadata” panel.
- (Chart) The same colors are no longer repeated for distinct labels if the color palette has more colors than what the chart requires.
- (Chart) When updating a chart with a new dataset and a different chart type, the filters will populate using columns from the new dataset.
- (SQL Lab) We fixed the issue where typing and using “Enter” to select the table broke the “SQL Lab” screen layout.
- (Alert) The current user will pre-populate as the default owner in the “Alert” modal during new alert initialization1.
1 This feature is available for teams on Preset's Professional and Enterprise plans.
To learn more about the features and enhancements included in this release, visit Apache Superset Pull Request.
May 24, 2023
Product Announcement
Find more insights with Drill By!
Drill By, the latest drilling functionality in Preset, makes data analysis easier by allowing the slicing and dicing of data directly in the visualizations. Unlike the traditional "drill-down", you can filter and group by any dimension in your dataset in any order.
May 18, 2023
Enhancements and fixes
- (Database) We added a new field called "Column Data Types" to the "CSV Upload" form, allowing users to specify data types for columns in the uploaded file. This addresses the issue where text columns in the Redshift database were converted to varchar columns with character limits.
- (Dashboard) Search input in the filters is retained while you select values containing the same search input, making it easier to select multiple values.
- (Dashboard) We have fixed the issue that caused dashboard filters to stop working properly on some legacy charts (e.g., Heatmap and Bar Chart (legacy)) after we introduced the non-temporal x-axis.
- (Chart) Big Number charts support conditional formatting (coloring), allowing you to easily see how the numbers compare to goals, forecasts, or expectations in real-time.
- (Chart) You can now define the secondary y-axis bounds in Mixed Charts.
- (Chart) The Calendar Heatmap chart is available again in the visualization library.
- (Chart) Time grain now works properly for Pivot v2 charts.
- (Chart) Results from editing a Table chart used in a dashboard are now saved and loaded properly in the Chart Builder view.
- (Chart) The scrollbar no longer flashes on and off when resizing the browser size in the Chart Builder view.
To learn more about the features and enhancements included in this release, visit Apache Superset Pull Request.
May 3, 2023
New features
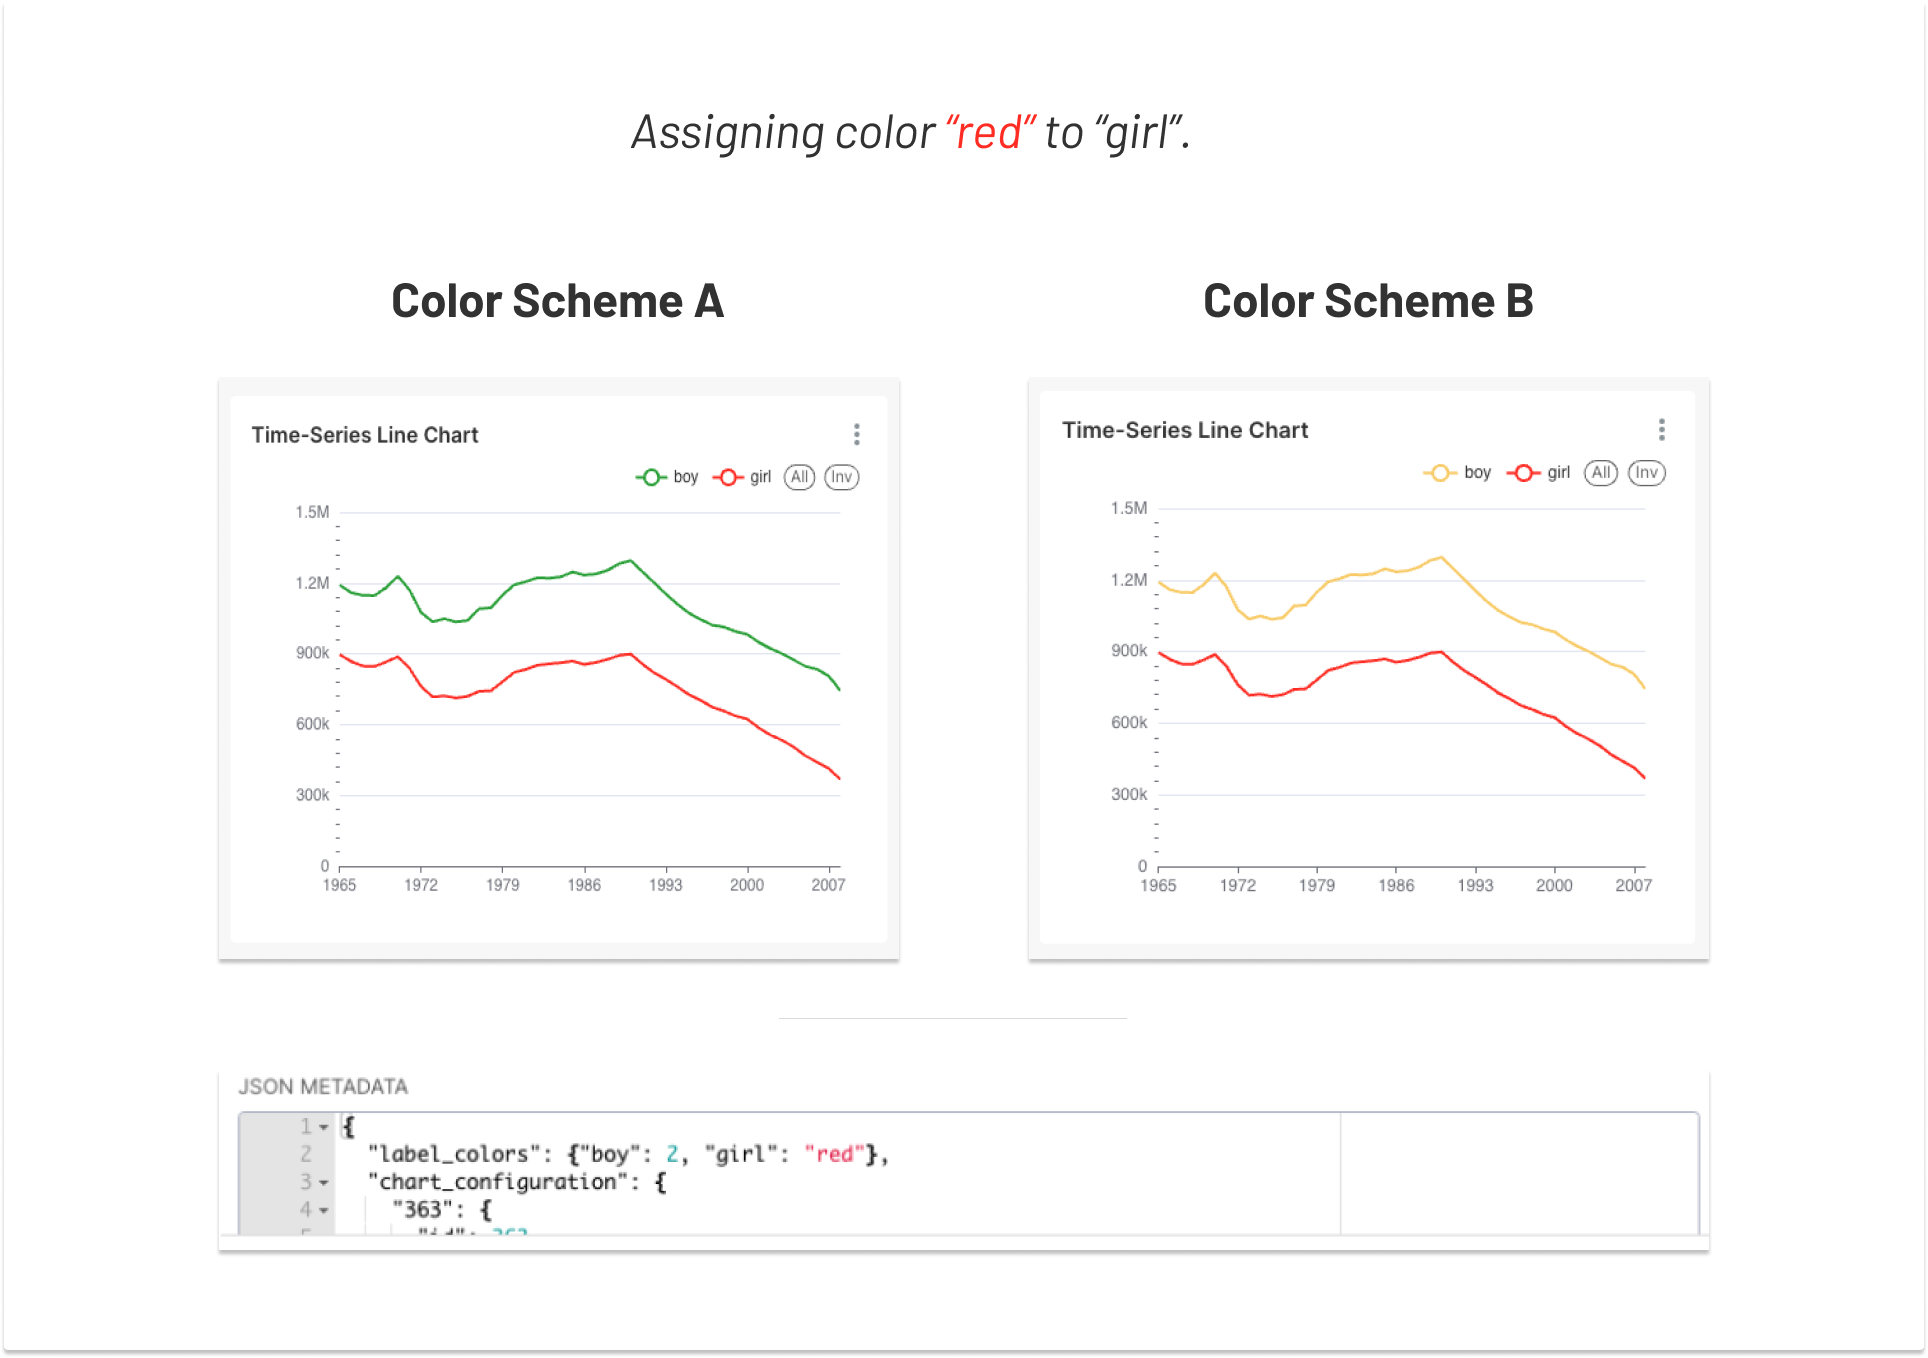
- (Dashboard) You can now assign specific colors to the series values based on the color scheme index, making it possible to maintain the assigned colors while changing color schemes.
- (Chart Builder) You can now export your chart data to Excel. The feature is available for most charts excluding “legacy” charts.
- (Admin) Usage metrics are available for all teams on the Enterprise plan by default, allowing Workspace Admins to track stats such as the volumes of active users and chart and dashboard assets created1.
Enhancements and fixes
- (SQL Lab) We added a loading spinner that appears in the the "Save or Overwrite Dataset" modal when overwriting existing datasets.
- (SQL Lab) When copying results to the clipboard from the query history, the header row is now included.
- (Chart Builder) The "Custom SQL" popover for ad-hoc columns is now resizable, making it easier to write SQL expressions.
- (Chart) We fixed an issue with the context menu crashing when there were no dimensions selected in some ECharts.
- (Chart) Bar totals now sort correctly when applying multi-series sorting on the categorical x-axis. You can also sort charts by total bar height, even when charts contain multiple metrics.
1 The feature is available to Preset teams on the Enterprise plan only.
To learn more about the features and enhancements included in this release, visit Apache Superset Pull Request.
April 20, 2023
Highlight
Dive into specific series values using the Legend Selector: The "Legend Selector" feature in Preset charts allows you to zoom into specific series values by selecting or inverting the selection of the legend items. This provides greater flexibility and is particularly useful when you want to compare a few series values among many.
New features
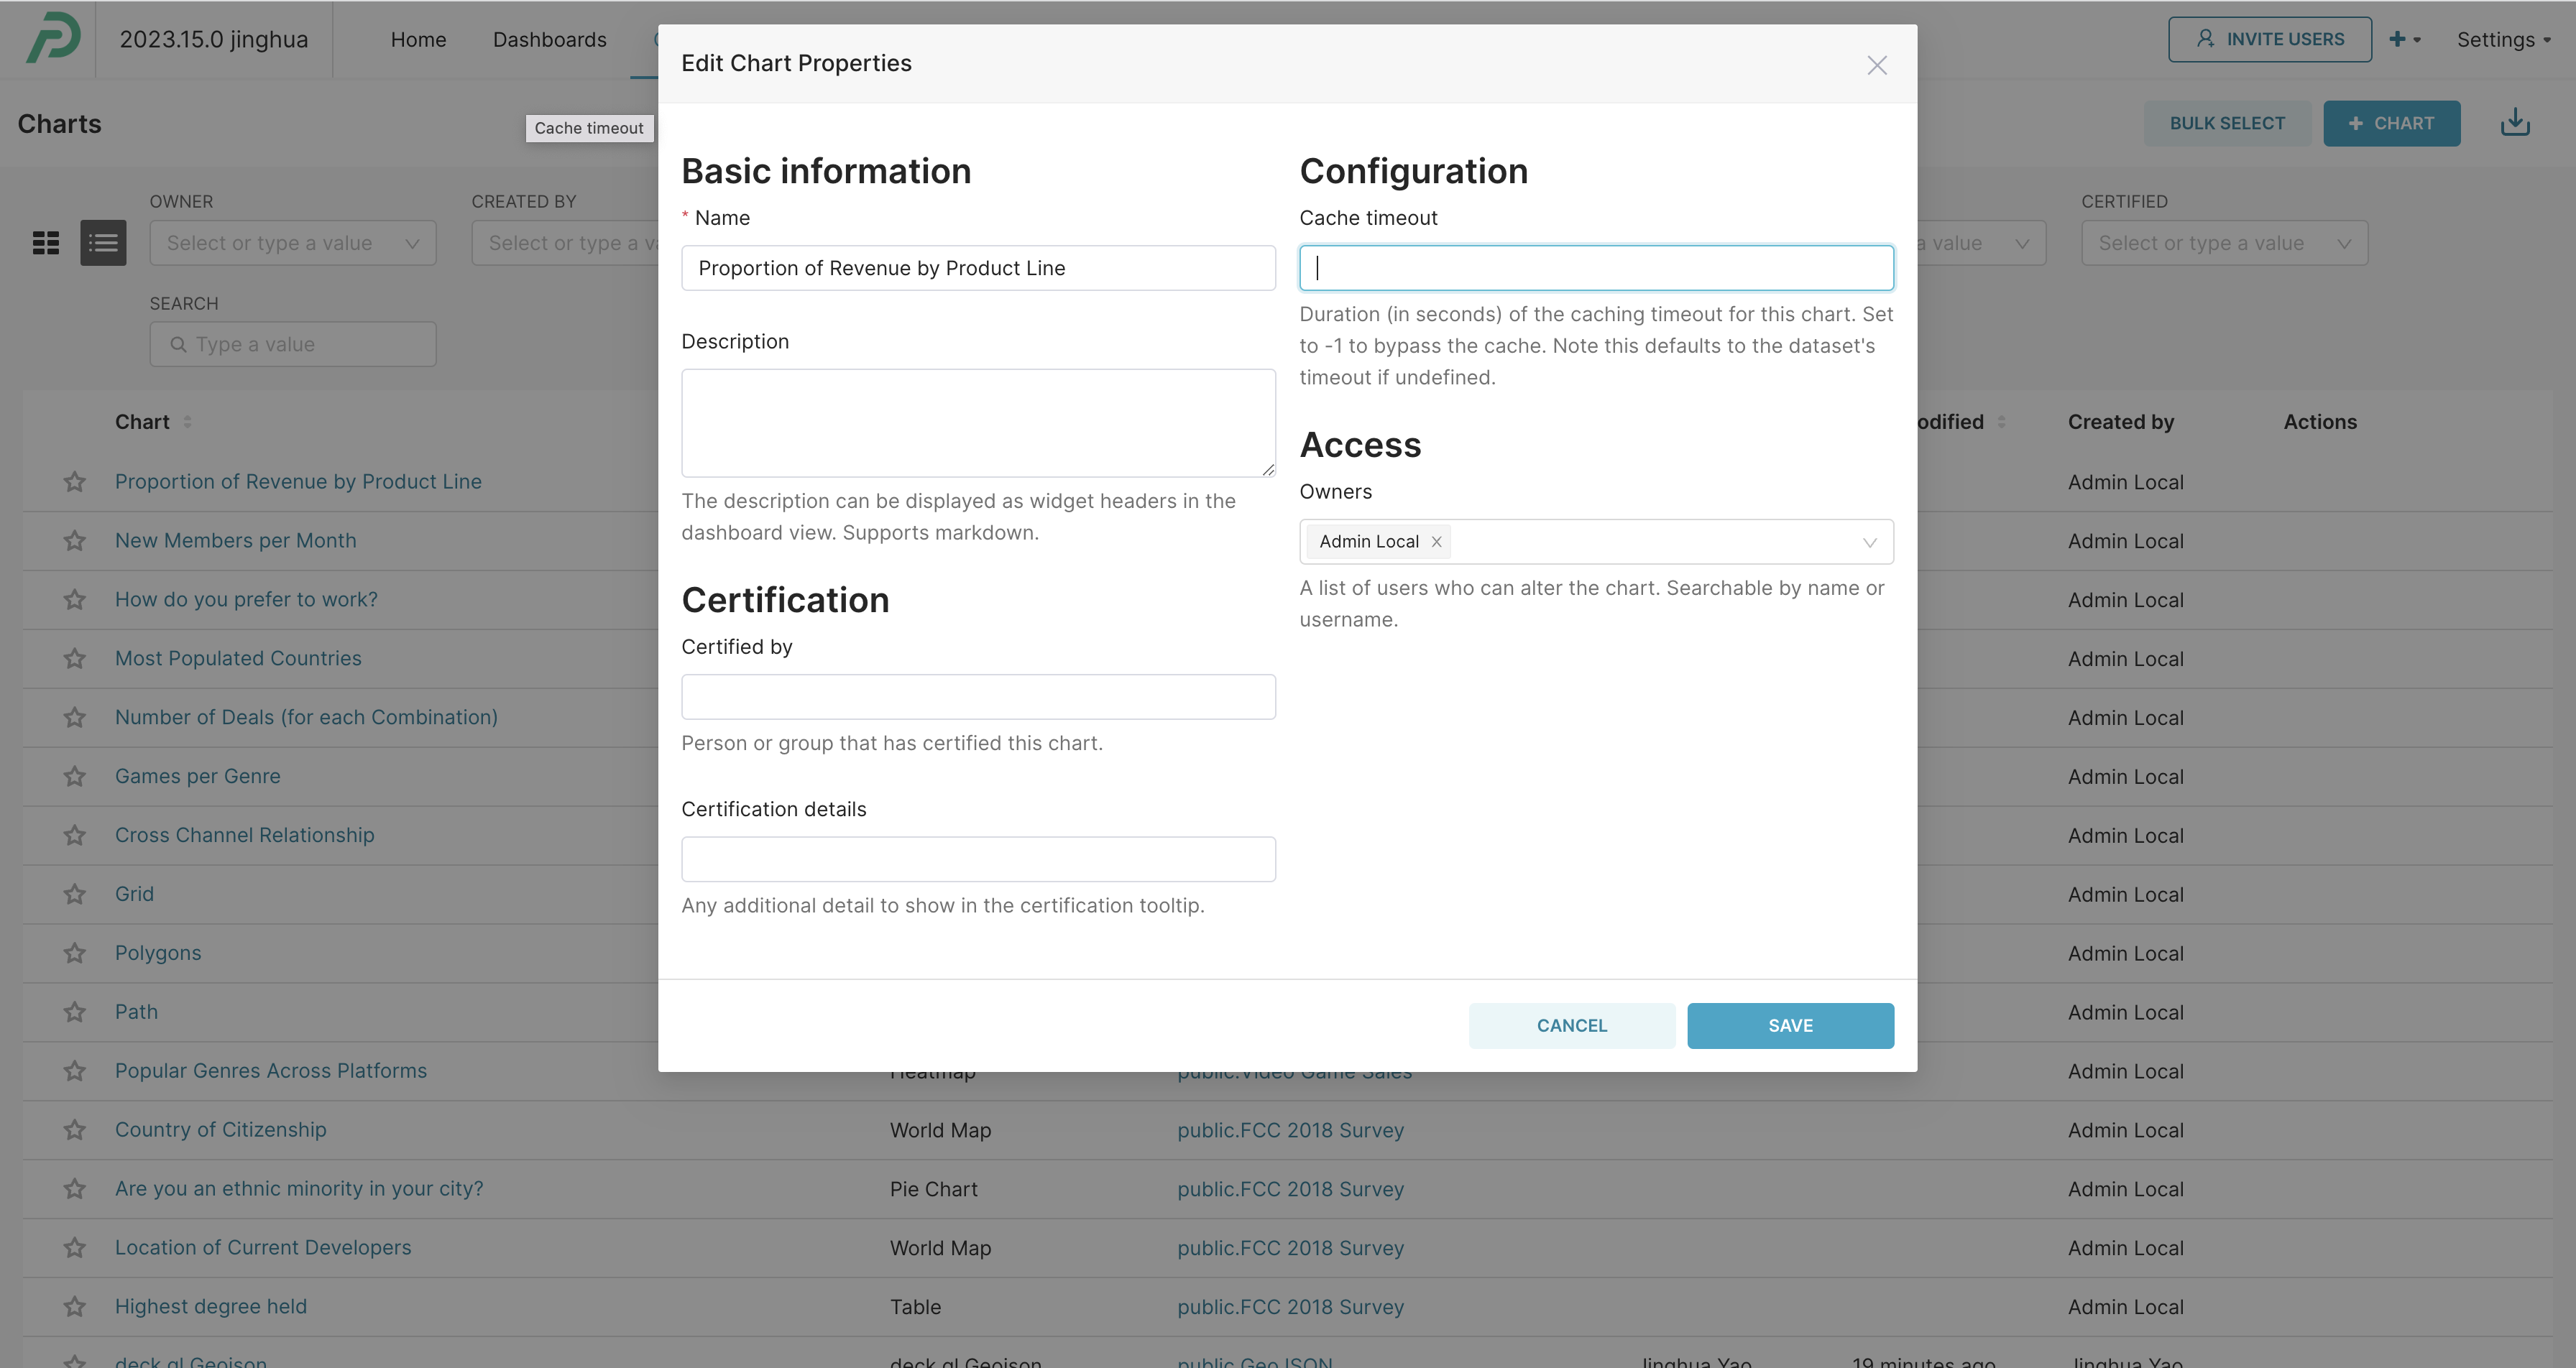
- (Chart) You can disable data caching on specific charts by implementing a chart "cache timeout" value of
-1.
Enhancements and fixes
- (Dashboard) You will now see only the charts you own or have created in the dashboard editor, making it easier to add them to your dashboard. You can still access charts created by others by unclicking the “Show only my charts” checkbox.
- (Dashboard) We fixed the false error message about loading databases that appeared when charts were imported via a dashboard import.
- (Dashboard) Dashboard time range filters correctly apply to charts and are saved without deleting chart-level time filters.
- (Dashboard) Column names are human-readable and easier to read in dashboard cross-filters.
- (Chart) You can now define up to 1,000 annotations in Chart Builder, giving teams more flexibility in how they add context to a chart.
- (Chart) We improved the Table chart’s configuration panel in Chart Builder to make time filter selection more intuitive and consistent with other chart types.
- (Chart) Time range filters are applied to Preset’s legacy charts only if there are no additional time filters applied in order to prevent the application of double time filters.
- (Chart) The labels for ad-hoc columns (custom columns / metrics defined in SQL Lab) render correctly in the tooltips of the plugin heatmap charts.
To learn more about the features and enhancements included in this release, visit Apache Superset Pull Request.
April 13, 2023
Highlights
Use Preset with CSV files without database connection: Sometimes waiting for your data team to connect a database to Preset can get in the way of using Preset. Now, anyone can create charts and dashboards immediately upon account sign up by uploading CSV files (without connecting to a database first). Learn more here.
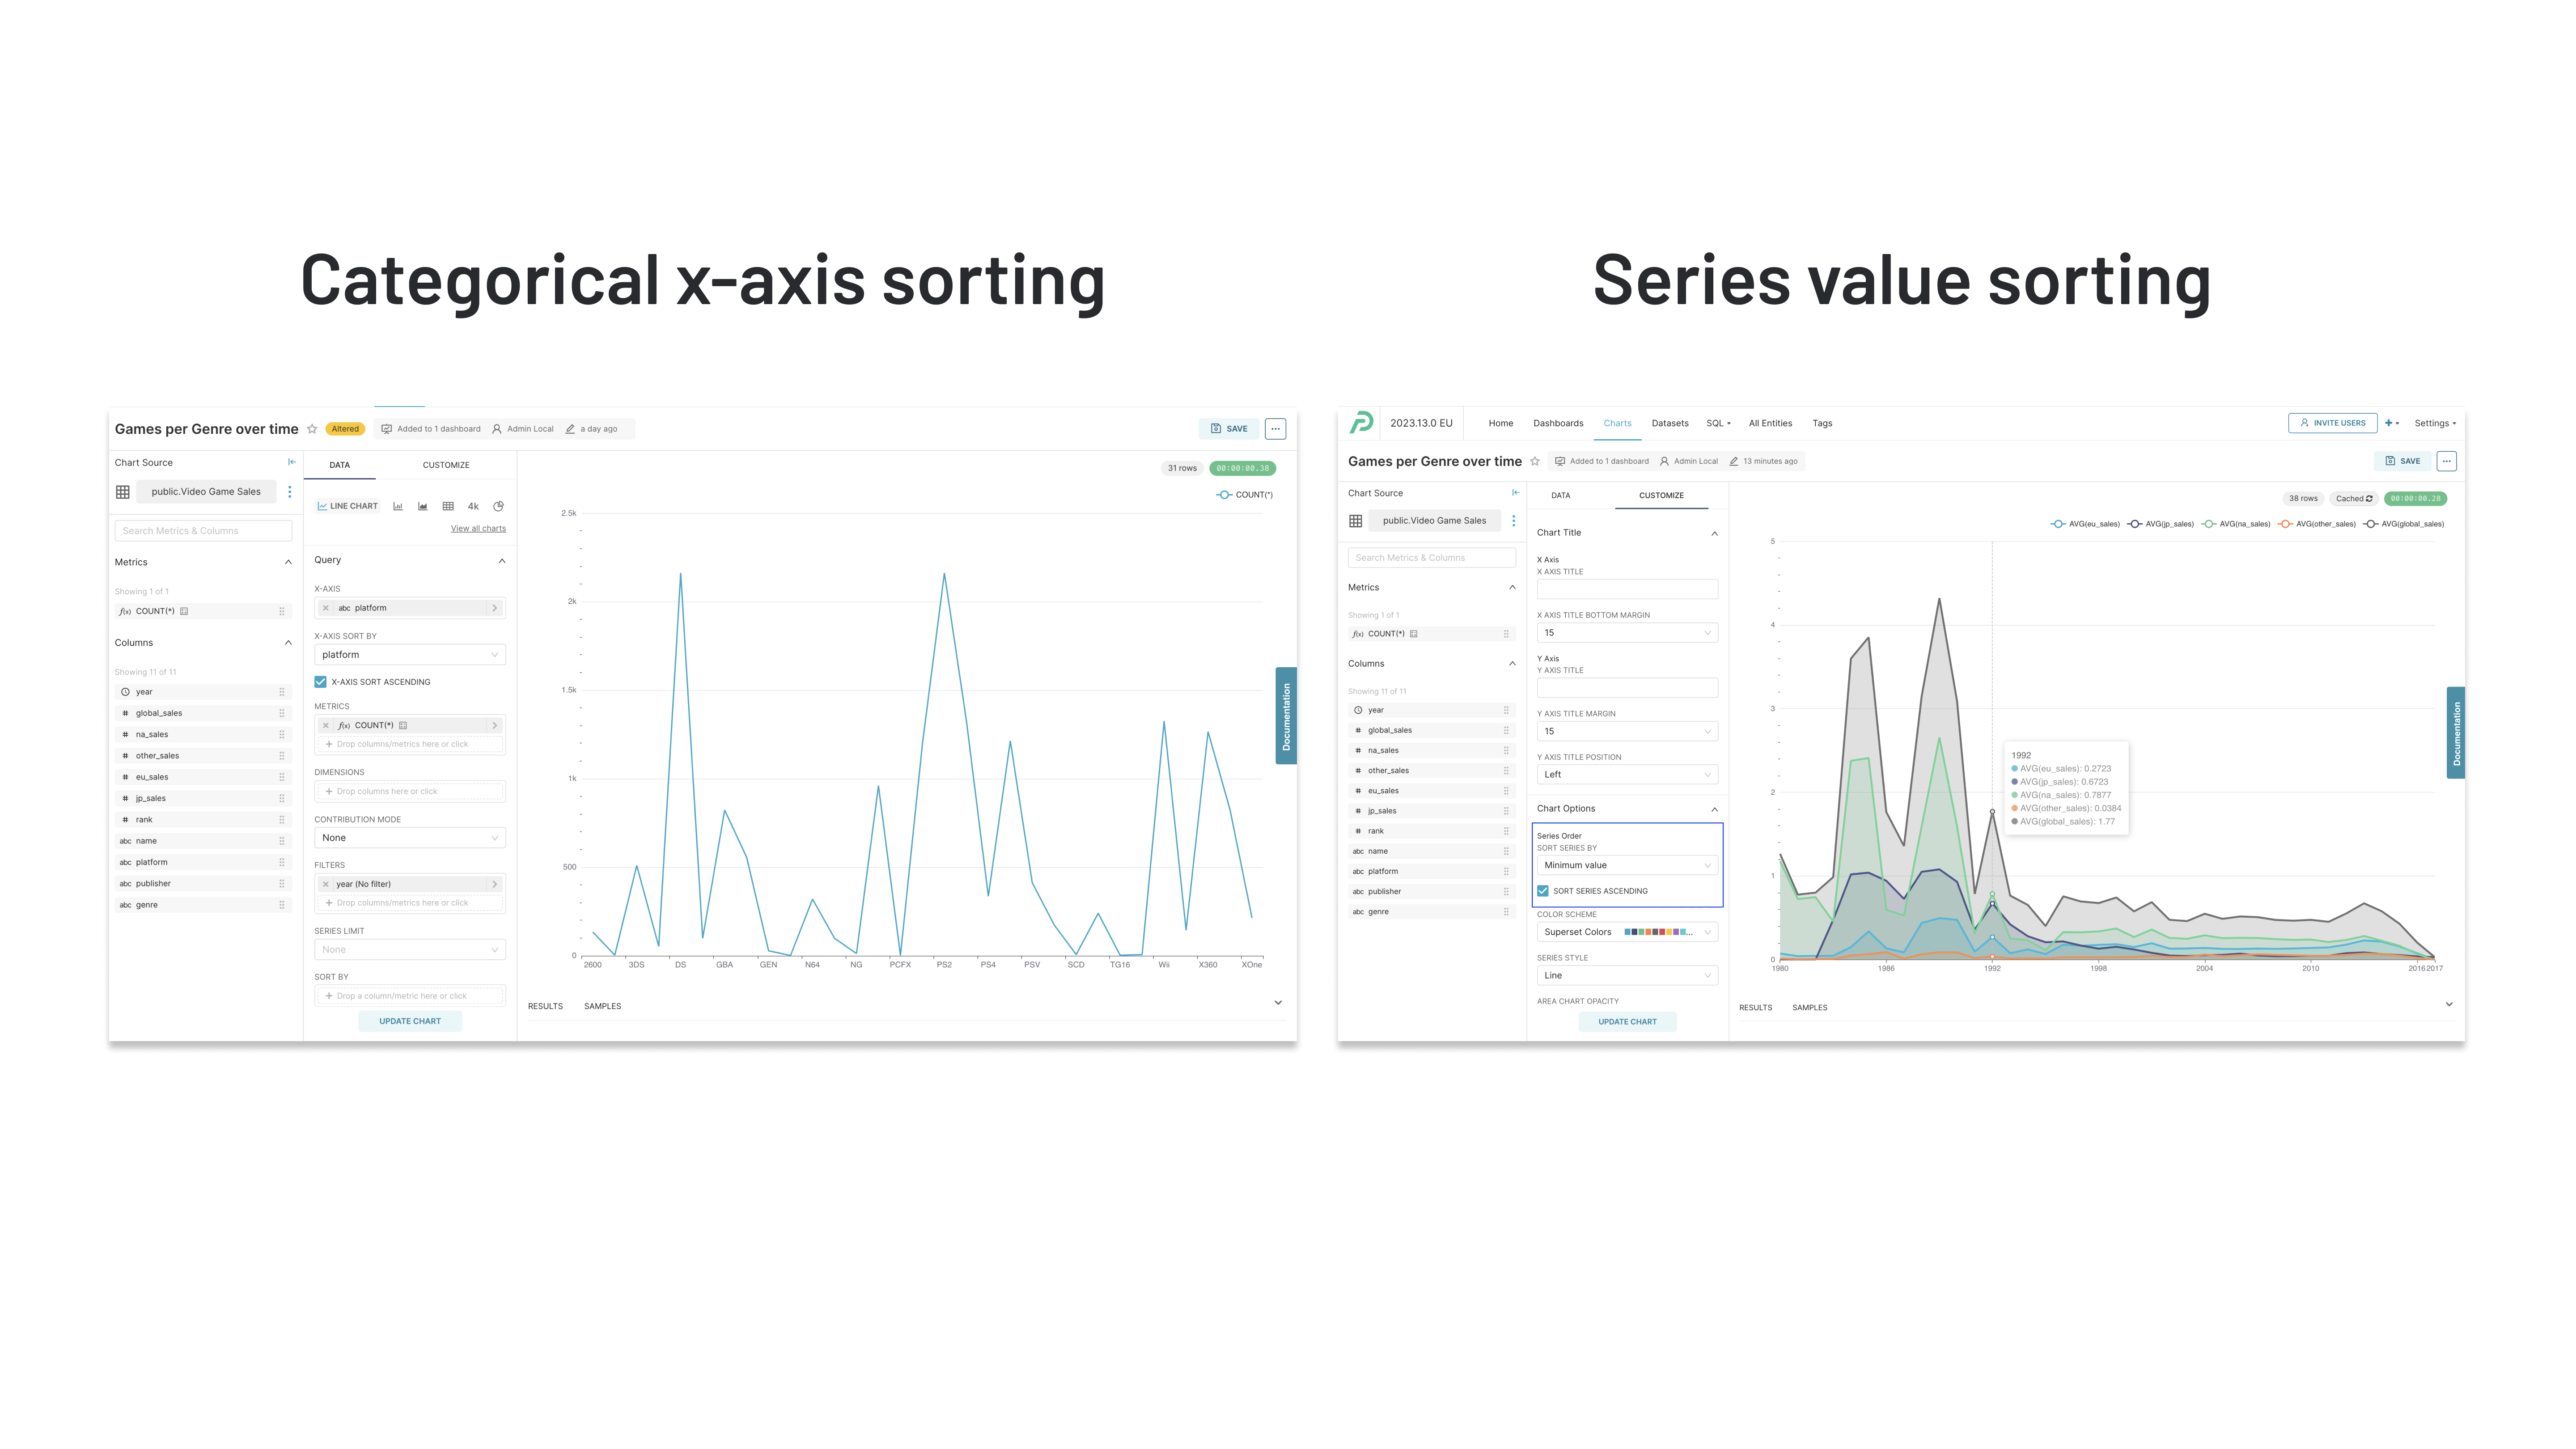
Customize your charts with more sorting options: Additional sorting features are now available in Chart Builder to help you visualize your data in the way you want. The new sorting configuration options include:
- The categorical x-axis can now be sorted in Bar Charts, Line Charts, Area Charts, Scatter Plots, Smooth Line Plots, and Stepped Line Charts.
- Series values can be sorted by "minimum", "maximum", "total", and "average".
- The sorting order can be switched between ascending and descending orders.
New features
- (Charts) You can now create a stream graph using Preset’s area and bar charts.
- (Charts) The Country Map chart supports a new country, Sri Lanka.
Enhancements and fixes
- (Database) The drop-down menu in the “Connect a database” modal properly shows database options when using the latest ClickHouse driver.
- (SQL Lab) You can use the
dataset()macro in Preset, which allows for querying physical and virtual datasets in SQL Lab. The macro is useful if you have defined computed columns and metrics on your datasets and want to reuse the definition in ad-hoc SQL Lab queries. - (SQL Lab) We fixed the issue where the "schedule query" option showed up in SQL Lab even when the option was not configured.
- (SQL Lab) We fixed the error message that occurred for undefined parameters that were not used in the query.
- (Dashboard) The time and numerical dashboard filters now support cascading, allowing the filter options to be dependent on the values selected in other filters.
- (Other) When using Preset through Safari browsers, Safari will no longer autocomplete irrelevant items by searching names from your address book where the label contains the word "name".
To learn more about the features and enhancements included in this release, visit Apache Superset Pull Request.
March 22, 2023
Highlights
Non-temporal X-axis is now generally available (GA). The updated X-axis allows you to visualize trends and patterns over variables beyond temporal dimensions in Preset charts (formally known as time-series charts). This feature was in beta and is generally available (GA), with chart names and the Chart Builder interactions updated in this release. Read our blog to discover what's changed in detail.
Enhancements and fixes
- (General) The “Explore” view has been renamed as the “Chart Builder” view to better reflect its functionality.
- (Dashboard) Users without the proper dashboard editing permission (i.e., Viewers) can no longer enable or disable cross-filters on the dashboard.
- (Dashboard) You can now select text in cells of the table charts and pivot table charts without triggering cross-filters.
- (Dashboard) You can now apply cross-filters to only the charts containing compatible datasets without causing database errors on the remaining charts with incompatible datasets.
- (Dashboard) The “Search” icon in the FiltersBadge, which indicates where the cross-filter is emitted from, is clearly visible on hover.
- (Dashboard) Cross-filters apply correctly when you create a new dashboard or add a new chart to an existing dashboard.
- (Dashboard) Cross-filters applied to time-shifted series return expected behaviors.
- (Dashboard) We fixed an issue that caused the dashboard to get stuck in the loading state when it contained an out-of-scope filter with the "Select first filter value by default" enabled.
- (Dashboard) Clicking the “cross-filter search” icon in the dashboard filter bar no longer grays out the entire dashboard.
- (Chart Builder) We fixed the blank state of the "Customize" panel issue in the Chart Builder view of the Heatmap charts.
- (Chart Builder) When exploring a chart in the Chart Builder view after applying a cross-filter on an ad-hoc column, the filter now correctly translates to the SQL ad-hoc filter.
- (Trino database) The table charts correctly display timestamps with timezones in Safari browsers when you query datasets created from the Trino SQL query engine.
To learn more about the features and enhancements included in this release, visit Apache Superset Pull Request.
March 9, 2023
Highlights
Cross-filtering is available to all users by default, enabling self-serve data exploration: Users with any workspace-level role can now apply cross-filters in dashboards, making it easier to understand the nuances of data and tell their story. Cross-filtering allows users to interact with a chart or a table and apply the same filters to other visualizations in the dashboard without having to set up persistent filters in the dashboard filter bar. Previously, cross-filtering needed to be enabled by Workspace Admins and Contributors through the Chart Builder view; now users with Viewer access can set up cross-filters and self-Chart Builder their data.
Key cross-filtering updates in this release include:
- You can immediately apply cross-filters in the dashboards. The chart creator no longer has to mark a chart as usable for cross-filtering.
- You can see applied cross-filters in the vertical and horizontal filter bars.
- Graph charts and world maps are eligible for cross-filtering.
- Cross-filtering is no longer accessible through the Chart Builder view.
Enhancements and fixes
- (RBAC) The data access role, Database Access, lets you see all dashboards, charts, and datasets associated with the databases you have access permissions for in their list views1.
- (Database) You can edit the SSH tunneling setting for existing databases connected to Preset using the dynamic form2.
To learn more about the features and enhancements included in this release, visit Apache Superset Pull Request.
1: This feature is available on the Professional and Enterprise subscriptions only.
2: This feature is available on the Enterprise subscription only.
February 28, 2023
Highlights
- UI support for SSH Tunneling1: Setting up secure connections via SSH Tunneling is made easier in this release. In addition to the API or SQL Alchemy forms announced earlier, you can now connect your database and Preset via an SSH tunnel using a dynamic form. SSH tunneling provides an additional layer of security by directing data traffic to flow inside an encrypted SSH connection, acting as an alternative to native data encryption.
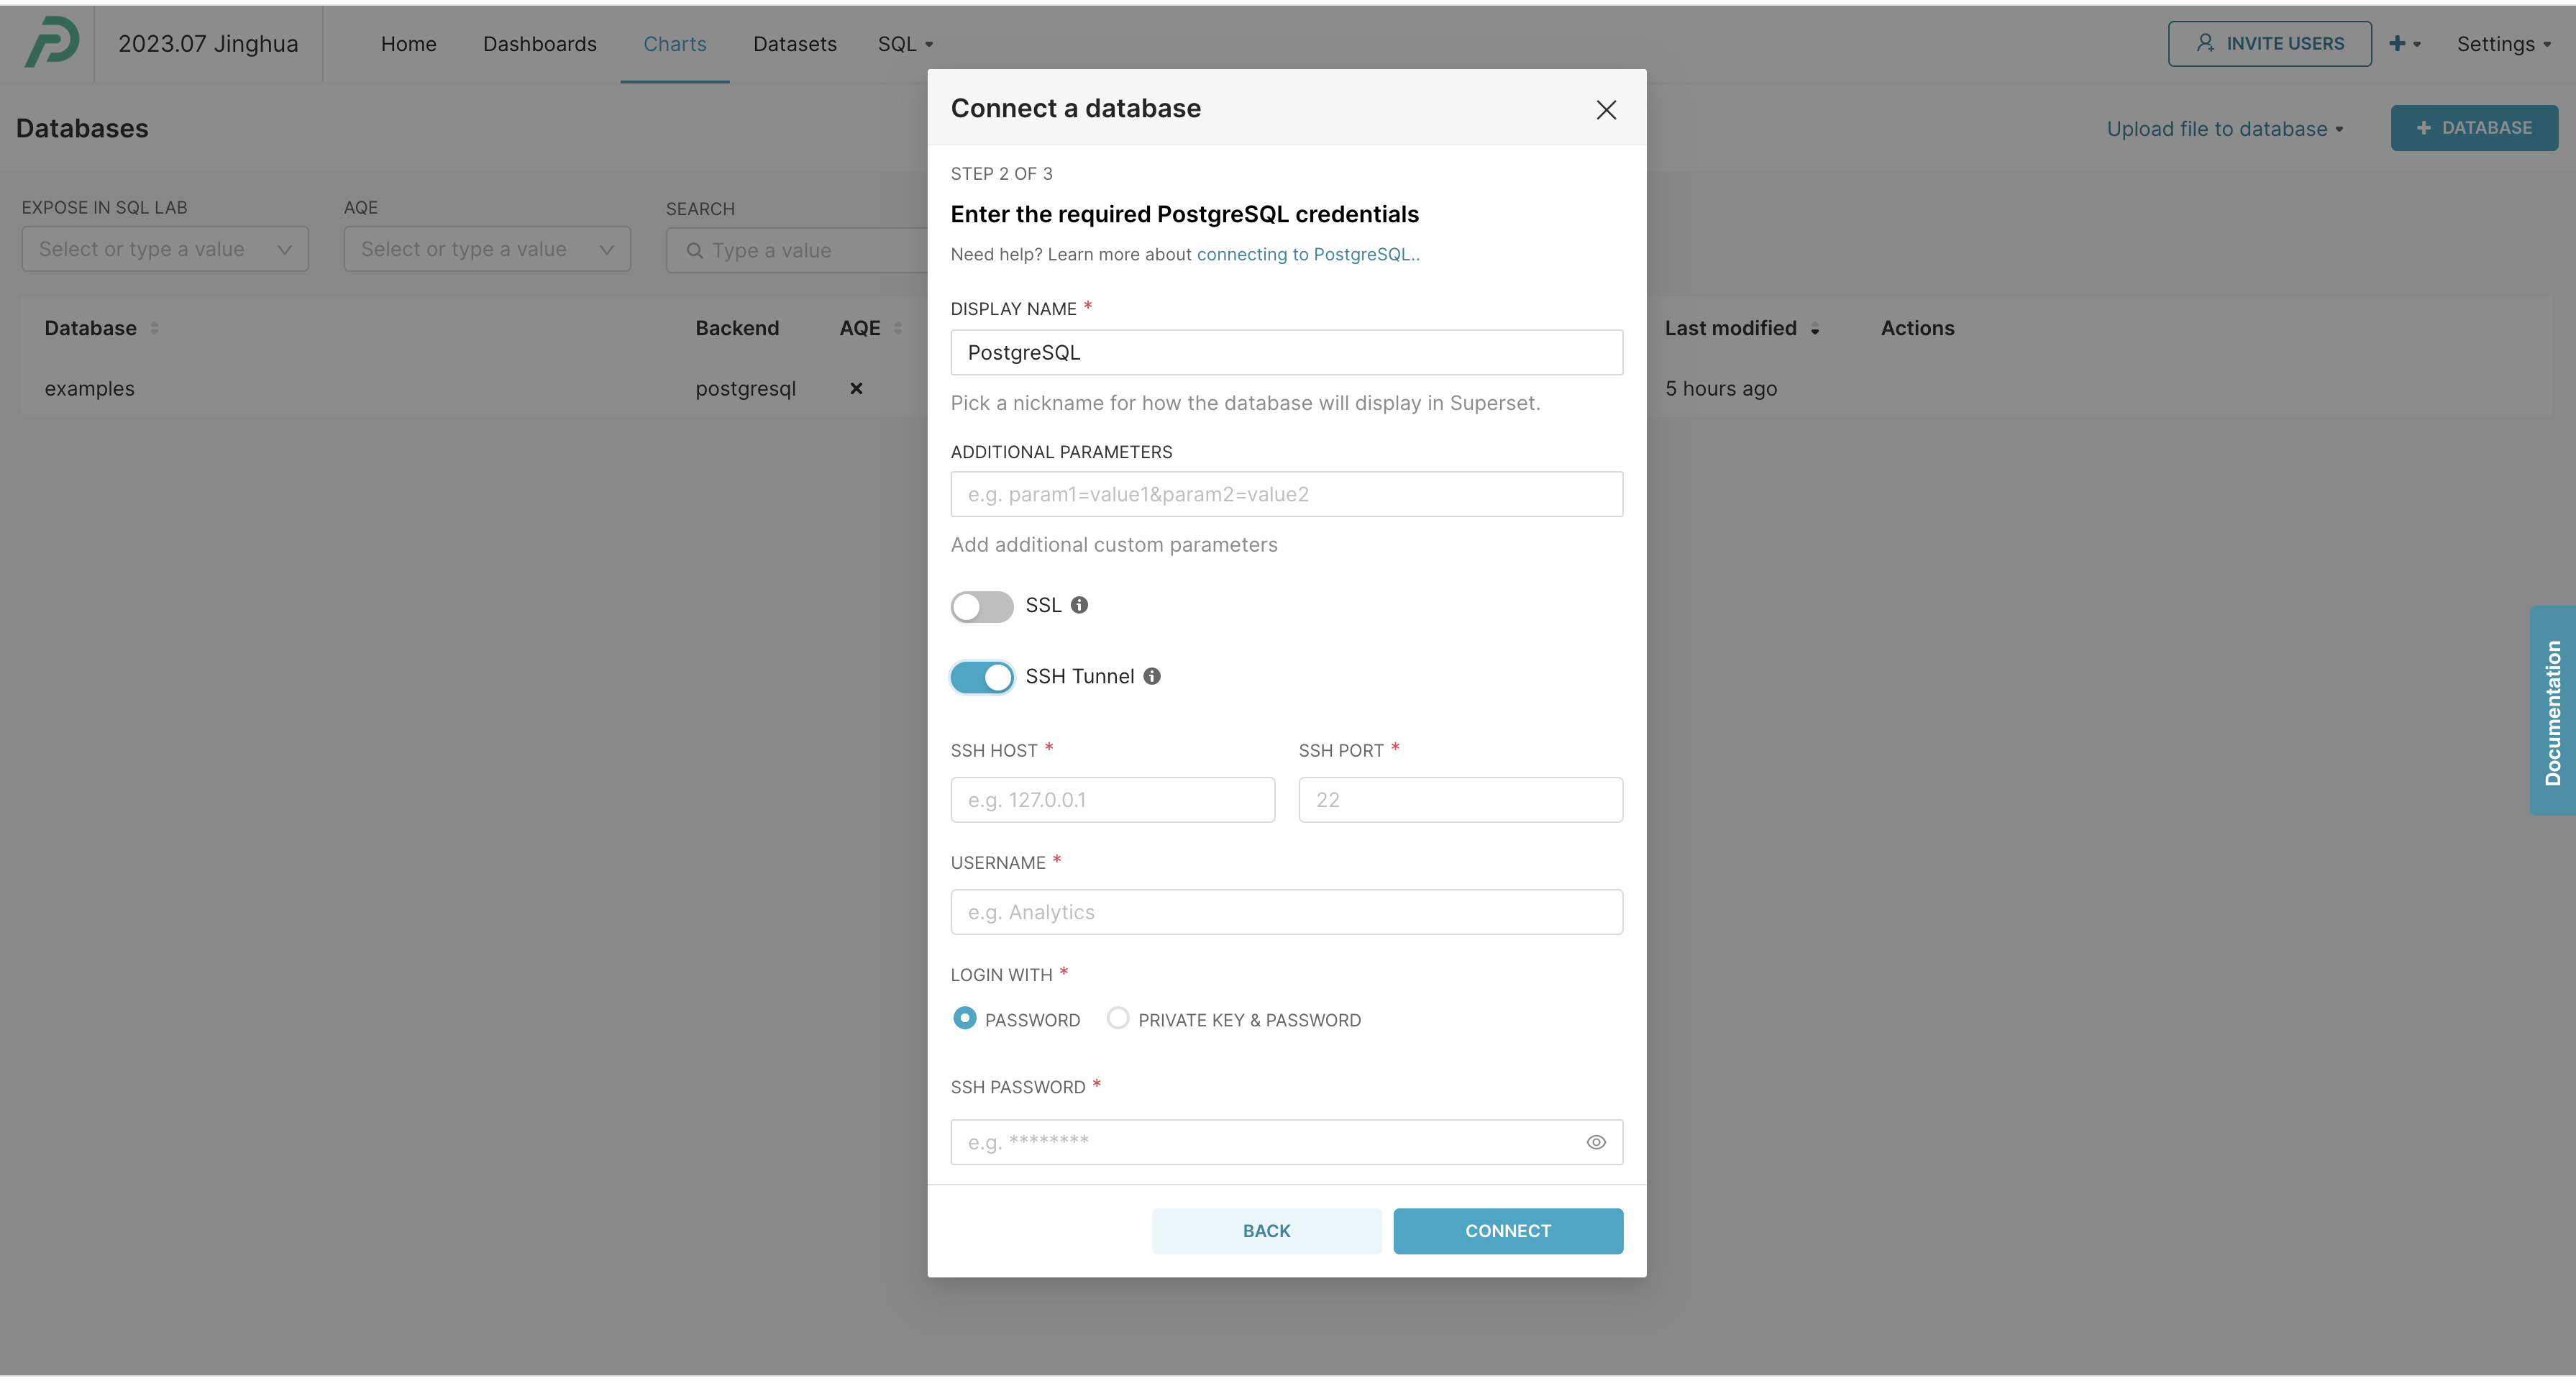
- More intuitive workflow for creating datasets: The new workflow for creating datasets allows users to have a better understanding of the hierarchy of a database, schema, and tables. Users can create a new dataset from a table that has no associated dataset, and they will be prompted to view the existing dataset if it has already been created for the table.
New features
- (Chart) Apache EChart’s Sunburst Chart is available in Preset.
Fixes and enhancements
- (Database) The
allow_dmlfield is included when a database is exported and is used when the database is imported. - (Database) A new configuration,
DATASET_IMPORT_ALLOWED_DATA_URLS, is available, allowing admins to define a list of regular expressions to allow URLs to import data. - (Dataset)
Expressionanddescriptionare passed to duplicated datasets to preserve calculated columns. - (Dataset) We clarified the error message for dataset import.
- (SQL Lab) We clarified database error messages for Databricks.
- (Dashboard) We updated
Selectto correctly handle disabled options on “Select All.” - (Dashboard) The time range filter now loses focus after closing its modal, removing the graying-out effect on charts that are not in scope.
- (Chart Builder) You can now edit and save the title of a custom metric.
- (Chart Builder) You can save a new metric when the
UX_BETAfeature flag is turned on. - (Chart Builder) We enhanced the filter logic to prevent the removal of the last temporal filter from a chart.
- (Chart) The dashboard owners are correctly removed from the chart owners after deleting the charts from the dashboard where they were inserted.
- (Chart) Tables now correctly handle emojis and accents.
- (Alerts & Reports) We updated the width of the reports to display them properly 2
- (Alerts & Reports) Reports are generated on
https. - (Other) We fixed the visual regression with the floating action button (FAB) dropdown menus.
To learn more about the features and enhancements included in this release, visit Apache Superset Pull Request.
1: This feature is available on the Enterprise subscription only.
2: This feature is available on the Professional and Enterprise subscriptions only.
February 6, 2023
New features
- (User Permissions) The new workspace role, “Secondary Contributor,” allows users to have full workspace contributor access (e.g., dataset creation/editing) subject to data restrictions as defined by the data access role. Learn more about the workspace roles.
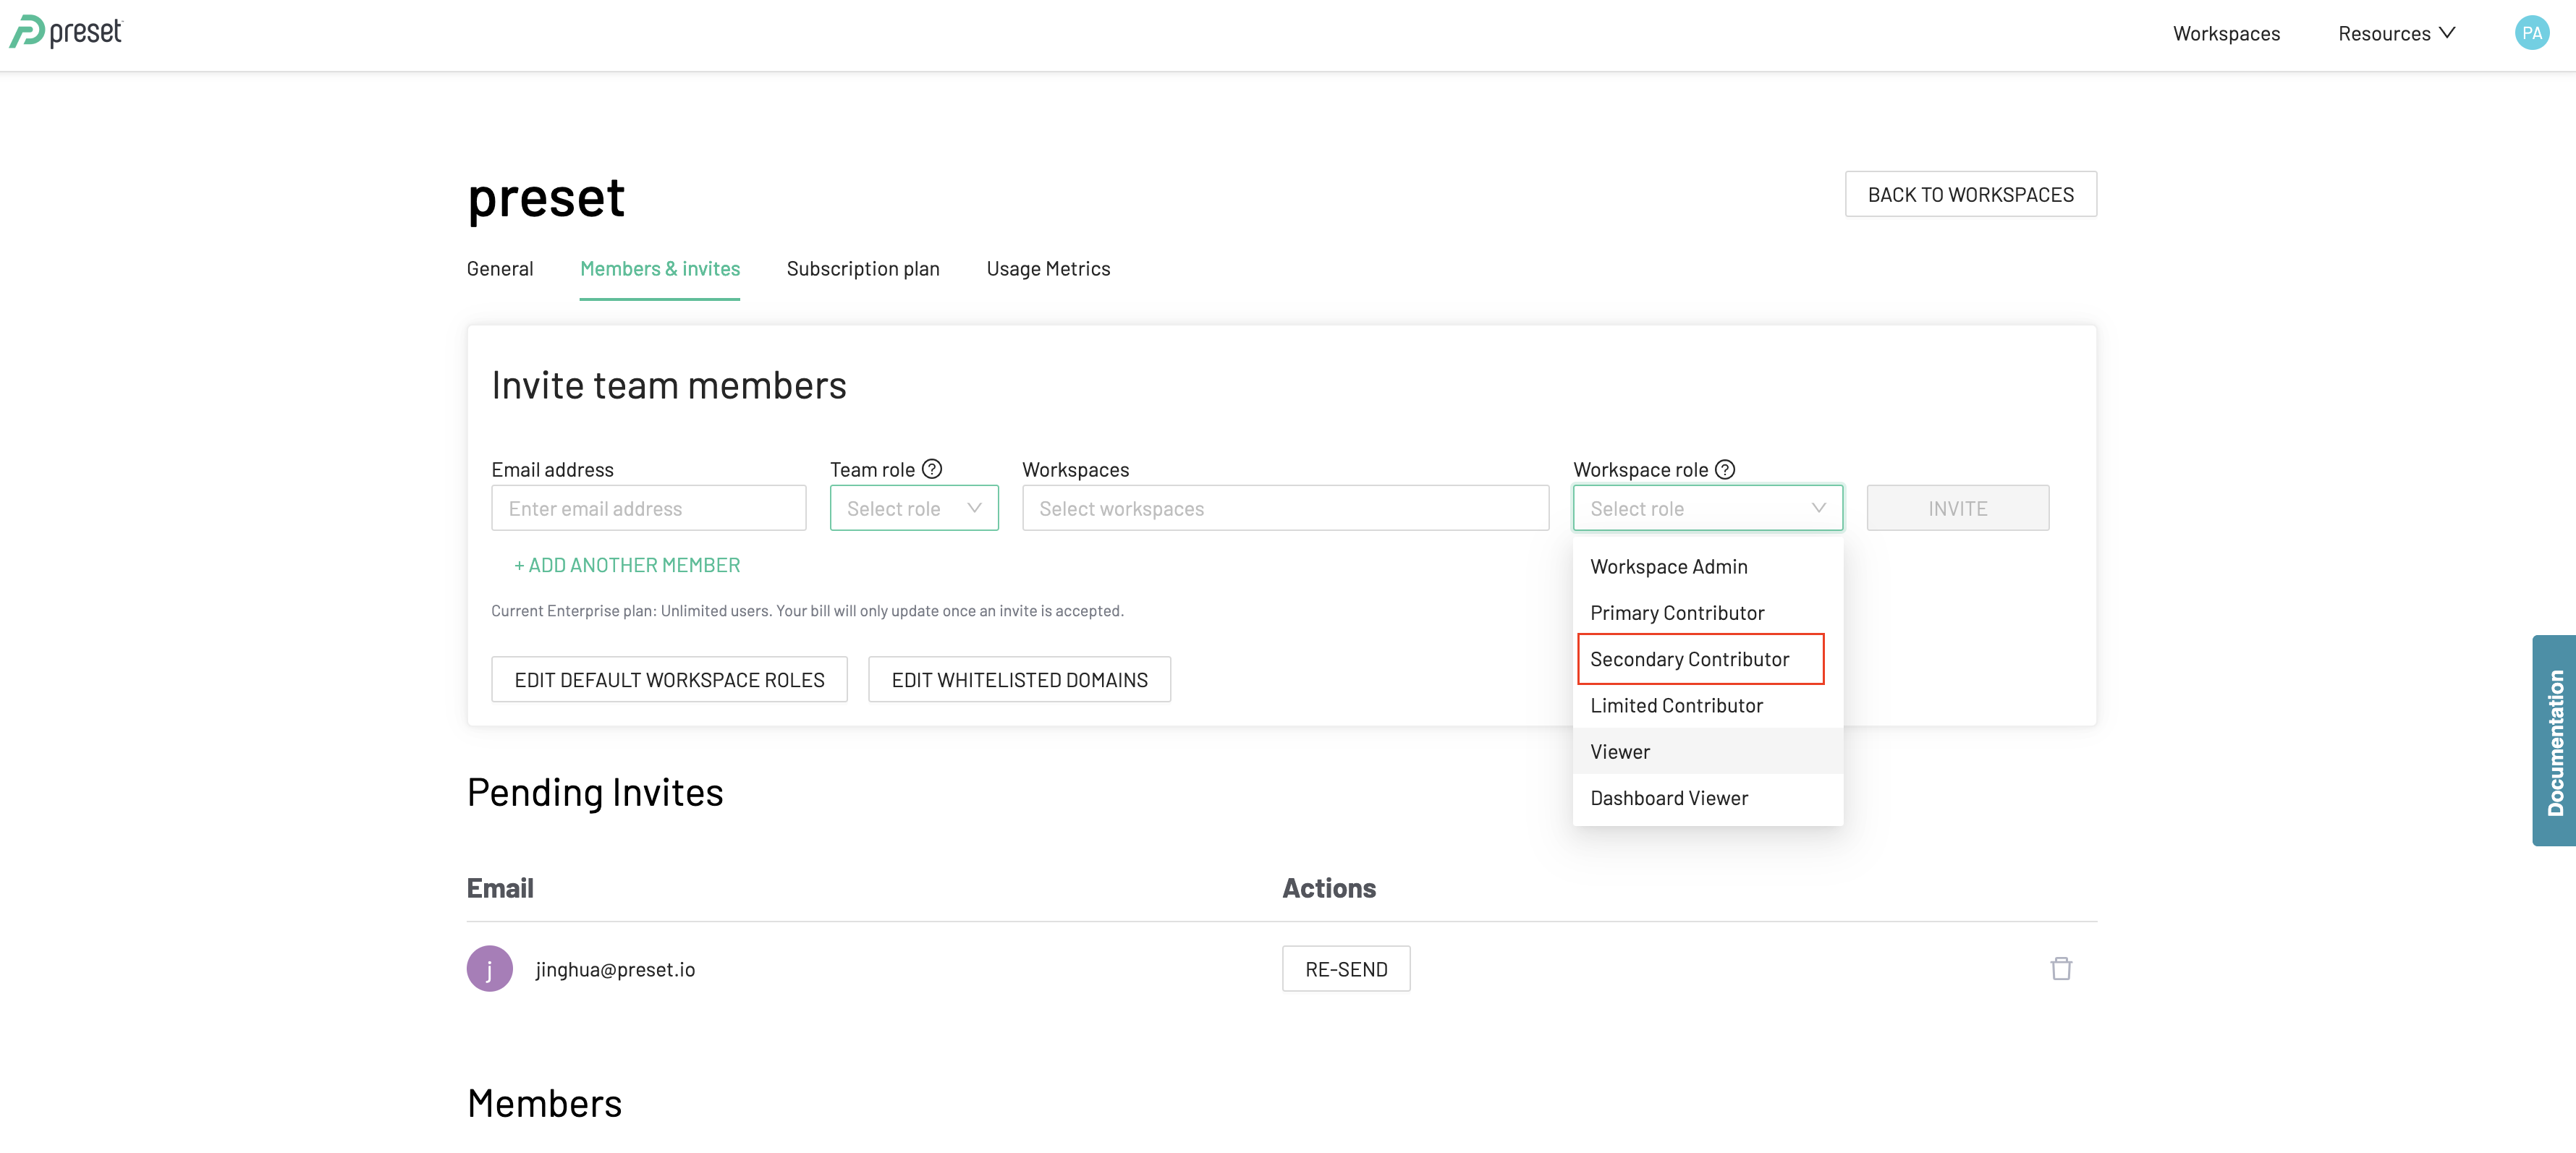
February 1, 2023
New features
- Secure database connections via SSH Tunneling1: Set up a secure connection between your database and Preset via API or SQL Alchemy forms. SSH tunneling provides an additional layer of security by directing data traffic to flow inside an encrypted SSH connection, acting as an alternative to native data encryption.
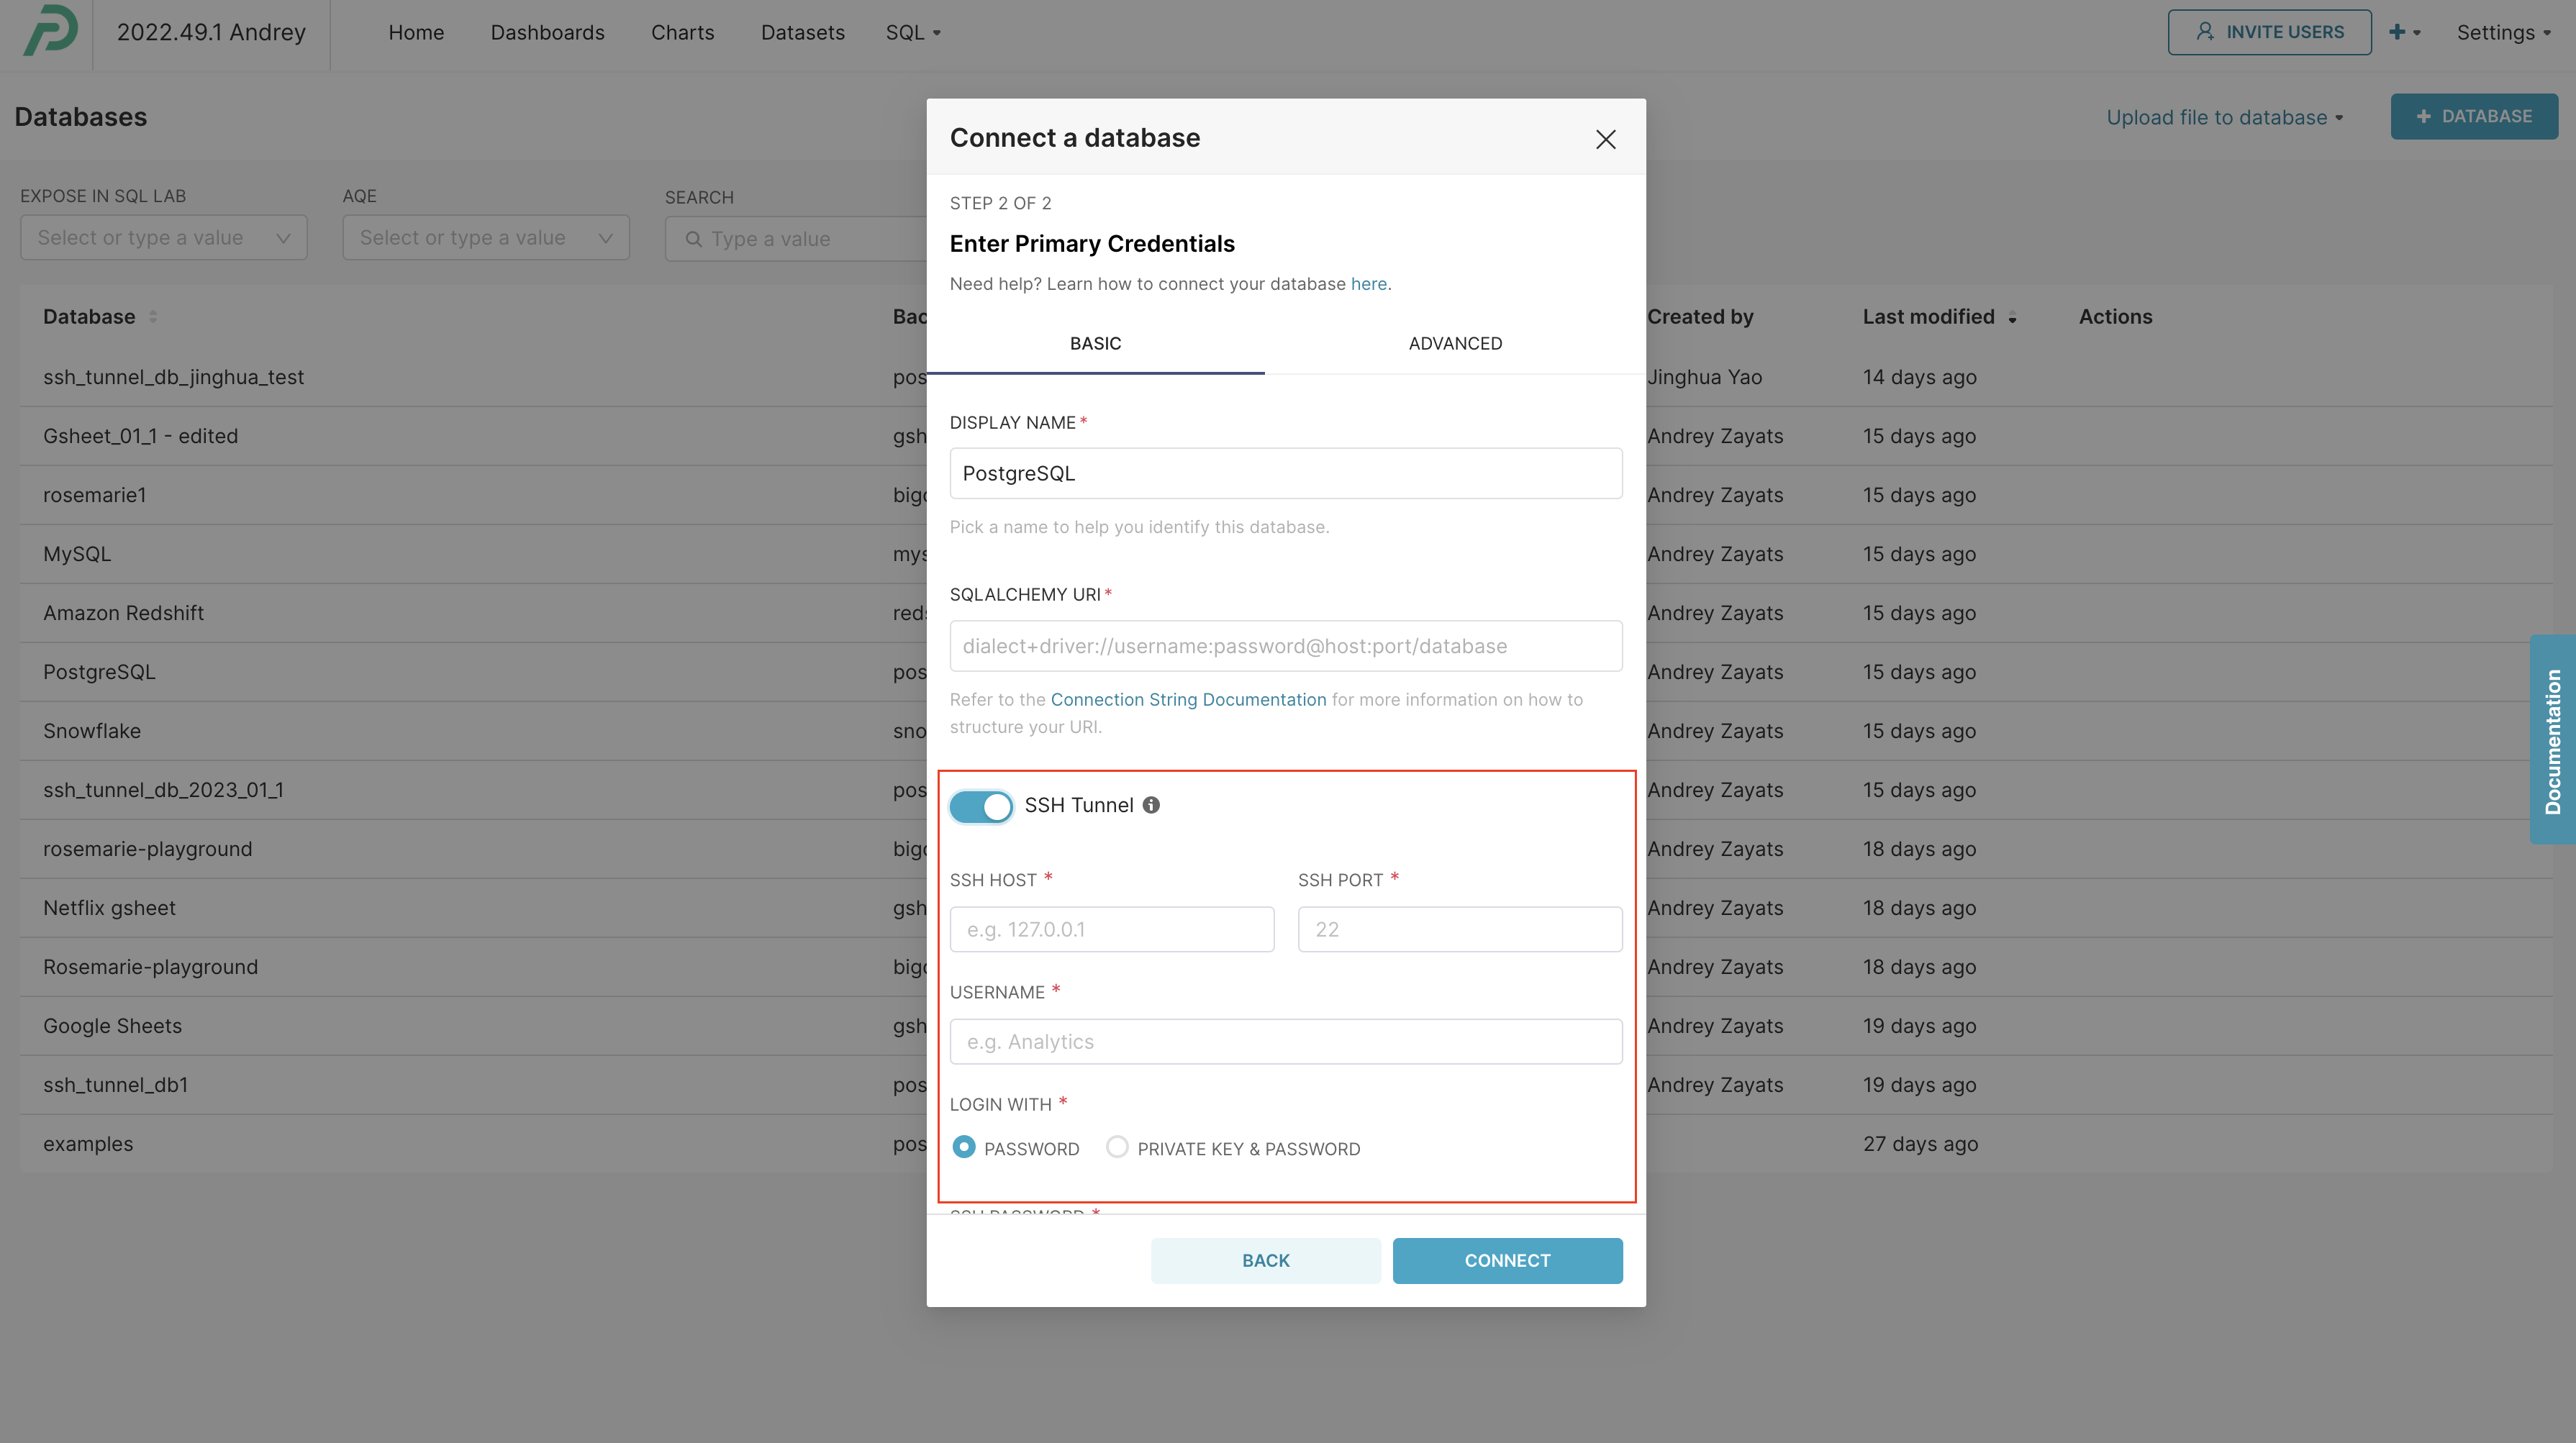
Enhancements and fixes
- (Alerts & Reports) The dropdown menu in the ”Alerts & Reports” modal correctly updates when a user switches from one alert option to another2.
- (Alerts & Reports) We made improvements to logging the Slack API errors3.
- (Database) We fixed the error related to the Databricks connector driver by removing whitespace in the
http_path. - (Database) You can now estimate the cost of running queries on the BigQuery database.
- (Dashboard, SQL Lab) You can now "Select All" items in the dashboard filter dropdown menus.
- (Dashboard) A loading animation (loading spinner) displays while a dashboard is being saved.
- (SQL Lab) We fixed the JSON SQL Lab displaying an incorrect value due to Javascript's max integer on 64-bit IDs.
- (Charts) The "View in SQL Lab" option in the “Chart Builder” view of the “Charts” page is only available to users with the necessary permissions to access the SQL Lab.
- (Charts) The "View in SQL Lab" and “Edit Dataset” options in the “Chart Builder” view of the “Charts” page are displayed only when a dataset is linked to a chart, and we clarified the error message.
To learn more about the features and enhancements included in this release, visit Apache Superset Pull Request.
1, 2, 3: These features are available on Professional and Enterprise subscriptions only.
January 11, 2023
New features
- (Chart) We added support for user-specific chart thumbnails, limiting the risk of sensitive data leakage in an environment where user impersonation is used.
Enhancements & fixes
- (Database) You can now import Snowflake’s
encrypted_extrafield for authentication. - (Database) We made enhancements to load the Google Sheets connection form.
- (SQL Lab) We display a clearer syntax error message for BigQuery databases.
- (Dashboard) You can now edit the filter selection directly from the filter cards in both vertical and horizontal filter bars through the Edit (pencil) icon.
- (Dashboard) We added a tooltip to the horizontal filter bar, allowing you to quickly see which filters are applied to the dashboard.
- (Dashboard) We made enhancements to the styling of the horizontal filter bar.
- (Dashboard) The “More Filters” dropdown in the horizontal filter bar shows additional filters in the correct order as specified by a user.
- (Dashboard) The “Owners” column on the Dashboard page shows the correct owners after editing.
- (Dashboard): We fixed the position and unintended closing of the time range filter’s popover screen in the horizontal filter bar.
- (Dashboard) We disabled button resizing in the horizontal filter bar to fixate the button position.
- (Chart) You can now save a Handlebar chart without CSS text. A tooltip containing the required HTML sanitization will also be displayed when using CSS.
- (Chart) We removed the “Dashboards added to” column on the Charts page to resolve occasional page crashing issues.
- (Chart) We fixed the overflowing of the header and footer in the table charts.
- (Other) We added an option to log errors on the server side to help debug issues.
- (Other) We removed timestamp precision for custom python datetime conversion to enable time range filters for Trino query engine.
To learn more about the features and enhancements included in this release, visit Apache Superset Pull Request.
Introducing Horizontal Filter Bar (December 20, 2022)
We’re excited to launch the horizontal filter bar, giving you more options to configure your Preset dashboards. If you're embedding Preset dashboards into a custom application, placing dashboard filters above the charts improves the usability and readability of the visualizations.
The horizontal filter bar functions just like the vertical filter bar (see Dashboard Filtering to learn more). To select the placement of the filter bar, click on the gear icon in the “Filters” column of the “Dashboard” tab.
December 14, 2022
Highlights
- Self-serve exploration with Drill to Detail: Explore the granular data that makes up specific values directly from the chart. As you filter down the dashboard for the data that meets your specific criteria, Drill to Detail will display the underlying data that corresponds to the applied filters in a tabular format. Follow Drilling to Chart Details for more details.
New features
- (Database) You can now connect your Preset instance to Databricks by providing the required credentials in a dynamic form, making it easier for non-technical users to connect to the database. Connection through SQLAlechemy URI is still supported.
Enhancements & fixes
- (Dataset) We resolved an infinite rendering loop issue that occurred occasionally on the Chart Builder page during dataset editing.
- (Database) We organized the CSV file upload form with an expandable and collapsable grouping feature, making it easier to navigate.
- (Database) An error message for database connection is properly displayed in the basic tab of the “Connect a Database” modal.
- (Database) We clarified the “con” field by renaming it to “database” in the Columnar and Excel upload forms.
- (SQL Lab) Autocomplete options are properly displayed when you write queries in a new tab.
- (Dashboard) Chart content resizes properly when you switch between tabs.
- (Charts) The “Columns” section is added back to the side menu of the Preset Chart Builder when you open it on saved datasets.
- (Charts) Tooltips stay displayed correctly when they overflow out of the chart box.
- (Charts) A pointer no longer hovers over a tooltip.
- (Chart Builder) We fixed an error that occurred when you updated a chart by changing the underlying dataset and the visualization type on the Chart Builder page.
- (Alerts & reports) We fixed text alignment in the CRON Schedule selector1.
- (API) Permission API allows
INVITEEto be added as a grantee for a Data Access Role (DAR) permission2.
To learn more about the features and enhancements included in this release, visit Apache Superset Pull Request.
1 The feature is only available for the Preset Professional and Enterprise plan users.
2 The feature is only available for the Preset Enterprise plan users.
December 5, 2022
Enhancements & fixes
- (Database) We updated the form for uploading CSV files to improve user navigation.
- (Database) A schema is auto-selected when choosing a database with a single schema.
- (Database) ClickHouse's official driver, ClickHouse Connect, is supported.
- (Dashboard) Users are now prompted to confirm overwrite when updating values in the "CSS Editor" and "Configuring Filter Scopes" to prevent unintended changes.
- (Dashboard API) We added the "Chart ID" field to the result payload of the
/api/v1/dashboard/<pk>/chartsendpoint in accordance with the OpenAPI Specification1. - (Chart) Chart files with empty
chart_slugcan now be exported. - (SQL Lab) We added the template parameters in KVStore to make it easier to share queries.
To learn more about the features and enhancements included in this release, visit Apache Superset Pull Request.
1: This feature is available on the Preset Enterprise plan.
November 16, 2022
Highlights
- Enhanced experience for Preset Professional trials1: We improved the product experience to help new teams plan their free trial of the Preset Professional plan. Features exclusive to the Professional plan (i.e., not included in the Starter plan) are marked with the "sparkle" icon, making it easier to prioritize which features to test during the 14-day trial period.
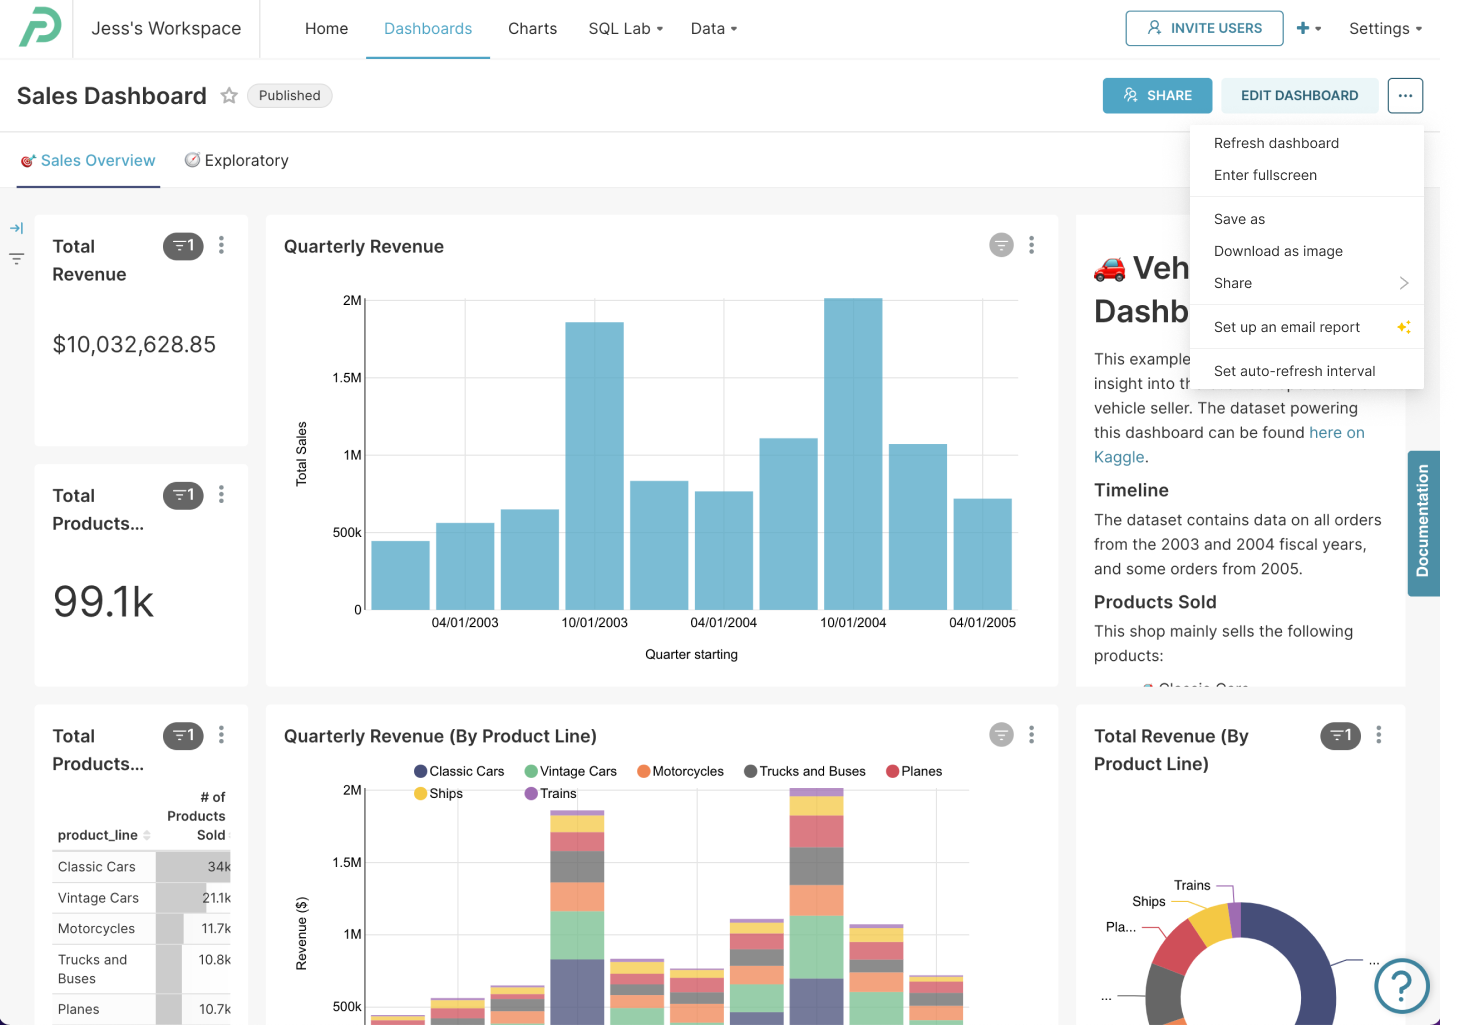
Enhancements and fixes
- (Database) We allow only JSON files to be selected in the file dialog for selecting credentials for BigQuery.
- (Database) We improved the BigQuery database connection error message related to the service account's roles and permissions.
- (Database) We added pre-load validation to the schema used for databases CRUD to support old payload with
encrypted_extra. - (Dataset) We improved data validation on Datasource save and sanitized the default endpoint on datasets.
- (Dataset) We fixed an issue for which the default temporal column wasn't picked up correctly.
- (Chart Builder) We improved the metadata language and tooltip placement.
- (Chart Builder) A modal for saving charts displays an error message instead of failing silently.
- (Dashboard) The background color of a chart when you "download (it) as image" matches Superset's theme color.
- (Dashboard) Auto refresh intervals are no longer hard-coded and can be properly configured.
- (Native filters) The panels stay expanded in native filters when you switch between the filters.
- (SQL Lab) We fixed the erroneous message about missing parameters that appeared when saving a dataset created from charts powered by SQL queries.
- (Alerts and reports) We bumped Gecko and Mozilla in the Dockerfile to resolve an error that users saw with alerts and reports.
- (Other) We deprecated
approveandrequest_accessendpoints. - (Other) We added logging for SPA route navigation with React router to fix an issue with LoggerMiddleware sending malformed log payloads.
- (Other) We put in control to check that imported files are ZIP files.
To learn more about the features and enhancements included in this release, visit Apache Superset Pull Request.
1 The feature is available for new users using Preset during the trial period.
November 4, 2022
Highlights
We built additional logic in the navigation to create and find your datasets, charts, and dashboards easier.
-
Creating datasets from the menu button: You will now see the option to create a dataset upon clicking "+" menu in the navigation bar after connecting a database.
-
Cross-referencing between charts and dashboards: You can now confidently edit charts and datasets while understanding which dashboards or charts may be impacted. You will see which charts are on which dashboards and what datasets power which charts, improving the ability to understand how changing individual objects impacts other aspects of the workspace.
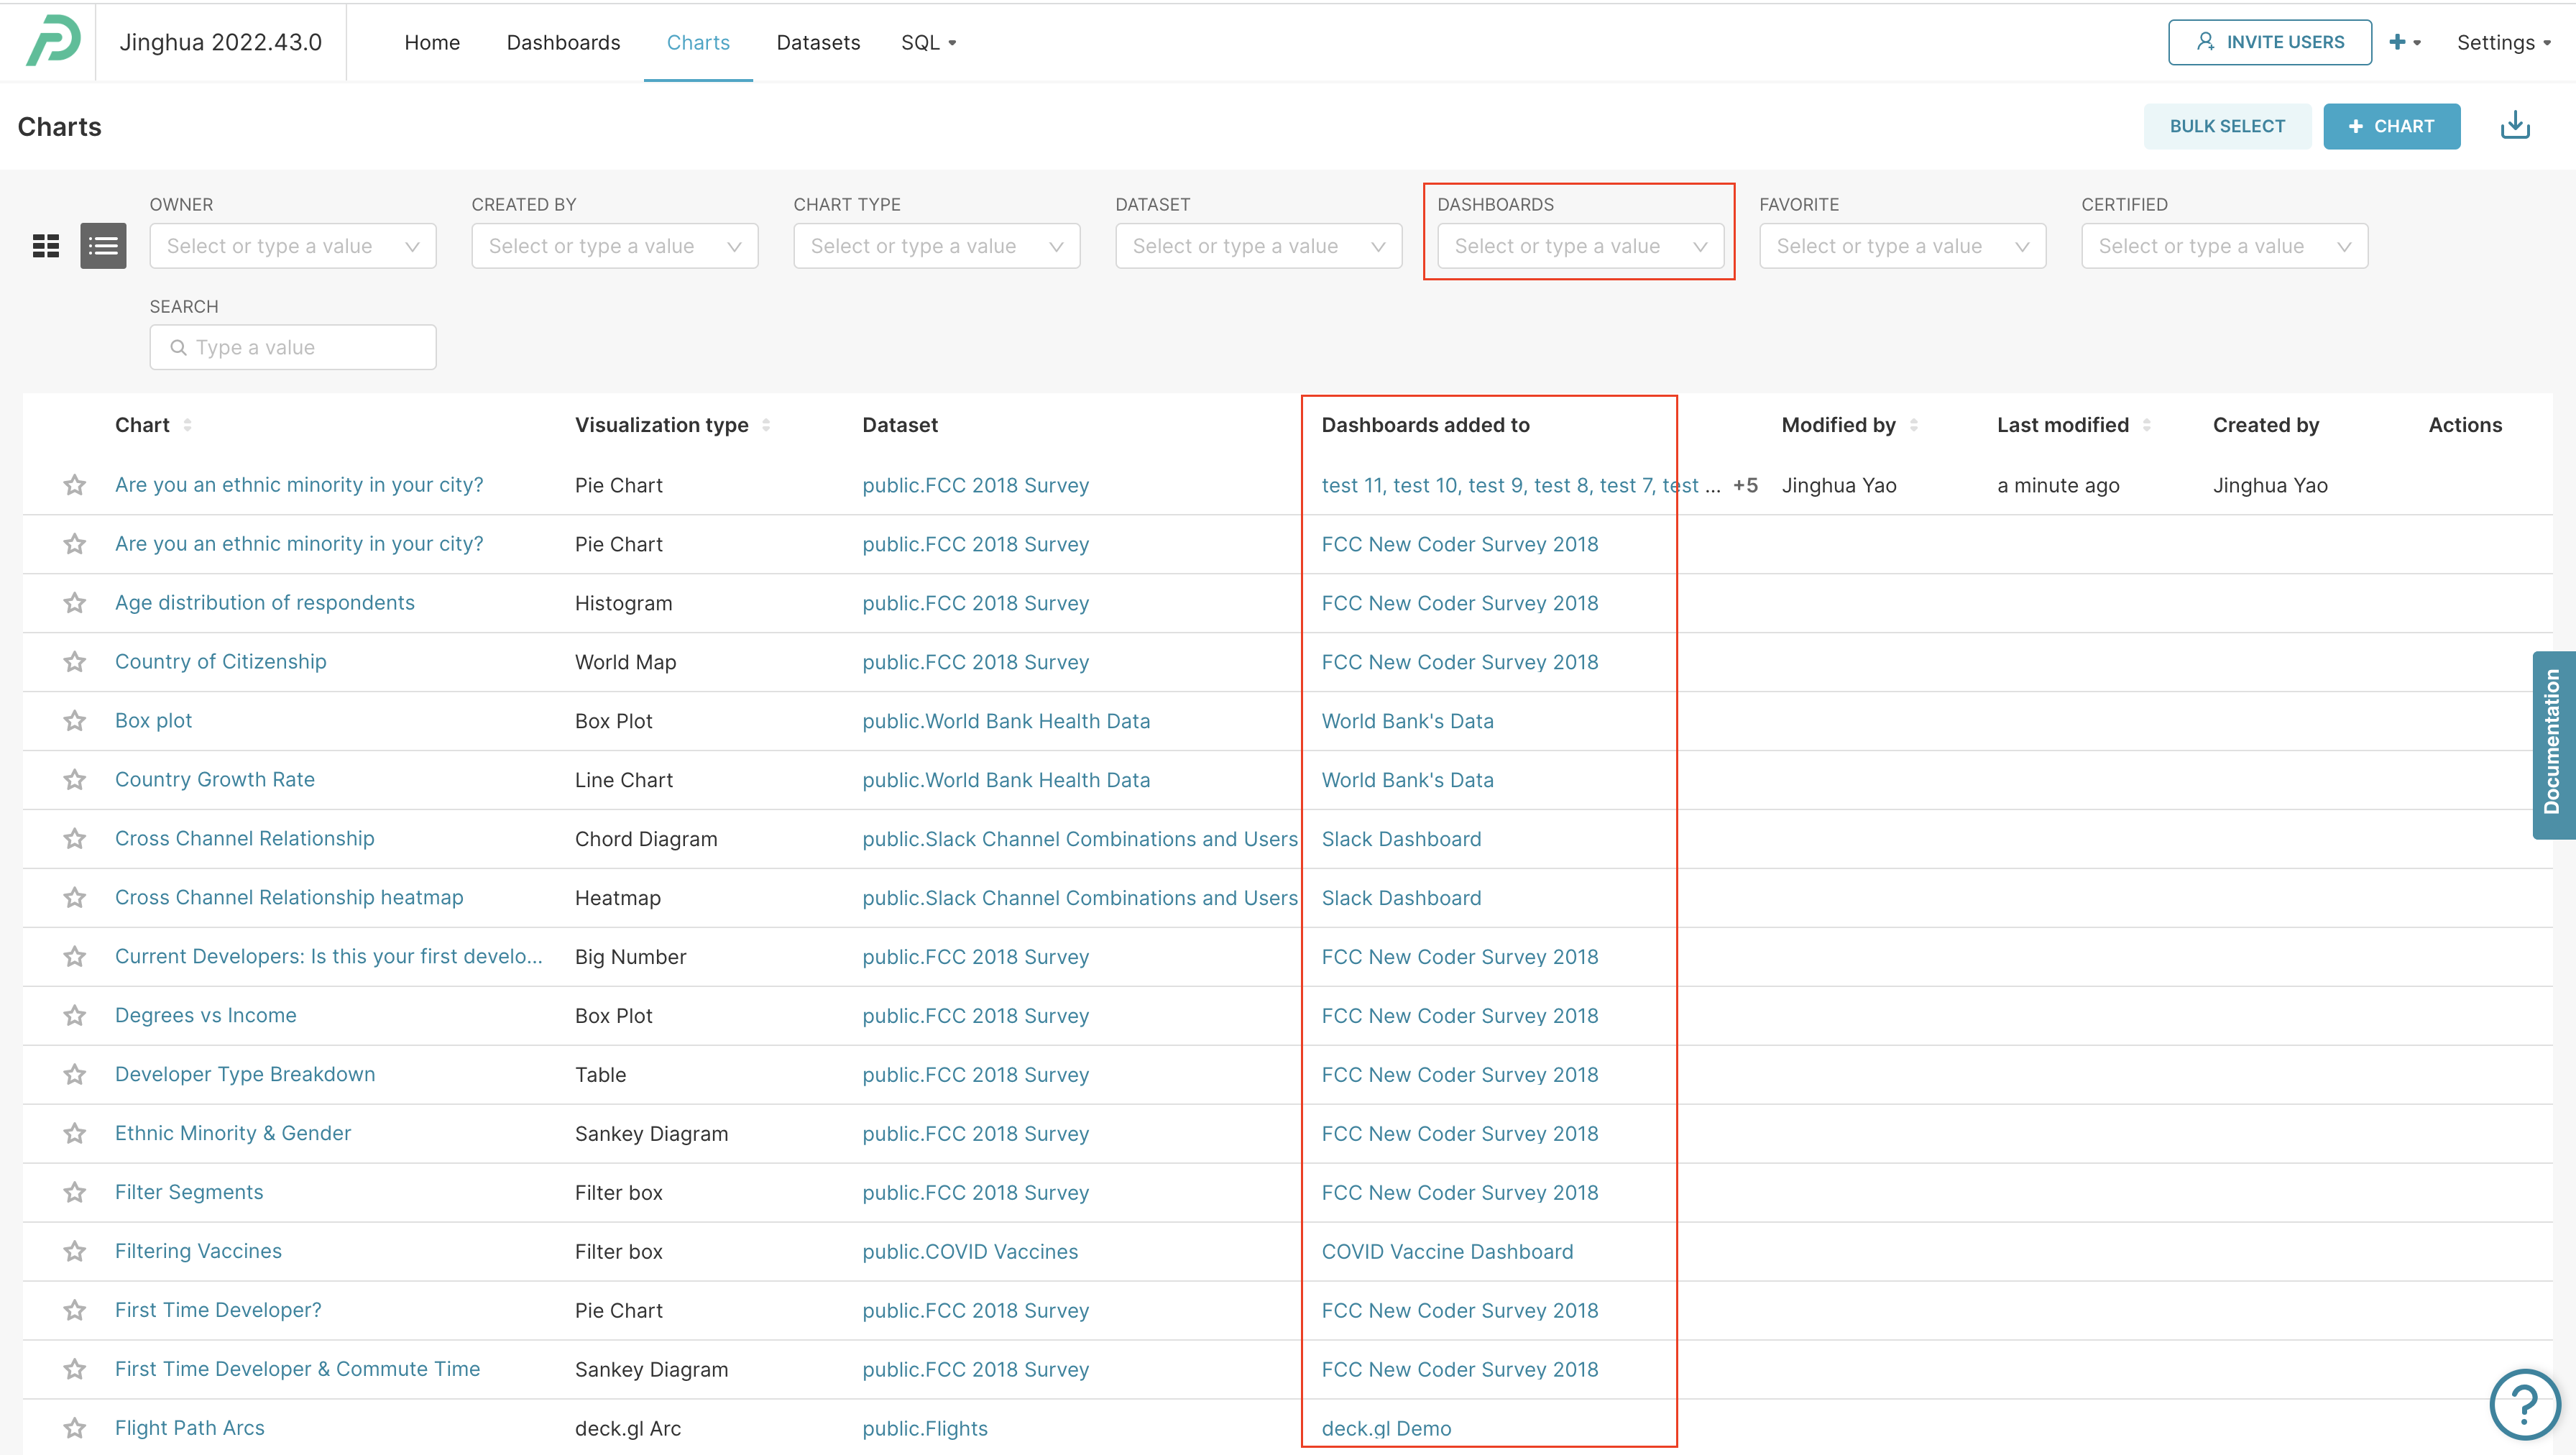
New features
- Added layer of security with content security policy check: The new Content Security Policy (CSP) check verifies if a policy is defined or not to help detect and mitigate Cross-Site Scripting (XSS) and data injection attacks. If the policy is not defined, you will see a warning message. For deployments that manage CSP with other software, this check can be disabled using the
CONTENT_SECURITY_POLICY_WARNINGconfiguration.
Enhancements and fixes
- (SQL Lab) We updated the timer to use a monospace font so its width doesn't change.
- (SQL Lab) We fixed a bug where "Ctrl+X" would not properly stop querying in the "SQL Lab."
- (Chart Builder) We show a warning about breaking a chart with custom SQL when a user changes the database.
- (Chart Builder) Commas have been enabled in number format to make reading easier.
- (Chart Builder) We ensured that unknown URL parameters would be preserved in the URL.
- (Chart Builder) We fixed a regression in which the URL parameters were not persisted to the form data.
- (Chart Builder) We resolved the issue where the date range in "Chart Builder" resulted in runtime errors.
- (Plugin) We fixed build and runtime errors associated with the Handlebars viz plugin.
- (Other) We disabled HTML rendering in the error pop-up notification by default.
- (Other) We enhanced color consistency across charts.
- (Other) We added CRLF line separators for Windows.
To learn more about the features and enhancements included in this release, visit Apache Superset Pull Request.