Overview
A waterfall chart is a powerful visualization tool commonly used in finance, project management, and data analysis to display the incremental effect of different positive and negative values on a cumulative total. It helps you understand the flow of data, such as financial changes or project progress, from one point to another. We will walk you through the process of creating a waterfall chart.
Reference Content
The following articles may be useful resources as you build your chart:
- Creating a Chart: A walkthrough of the overall process of chart selection and creation.
- Using Preset Chart Builder: How to work with the Chart Builder page, the primary interface used when creating a chart.
Creating a Waterfall Chart
To create a waterfall chart, your data needs to resemble the following shape:
| Dimension | Value |
|---|---|
| Dimension A | Metric 1 |
| Dimension B | Metric 2 |
| Dimension C | Metric 3 |
| Dimension D | Metric 4 |
Dimensions are the core way you want your metric to be grouped. Each value in a dimension will be a new "fall" in the waterfall chart.
Preset supports one additional grouping, called "Breakdowns" to further add additional segmentation and "falls" to the chart. To include Breakdowns, your data needs to resemble the following shape:
| Dimension | Breakdown | Value |
|---|---|---|
| Dimension A | Breakdown X | Metric 1 |
| Dimension B | Breakdown X | Metric 2 |
| Dimension A | Breakdown Y | Metric 3 |
| Dimension B | Breakdown Y | Metric 4 |
Waterfall Chart in Preset
If your data is already aggregated by stage, then you can select an aggregation that results in the values you want to show for each "fall"
 | Dimensions
Metric
Breakdowns (Optional)
|
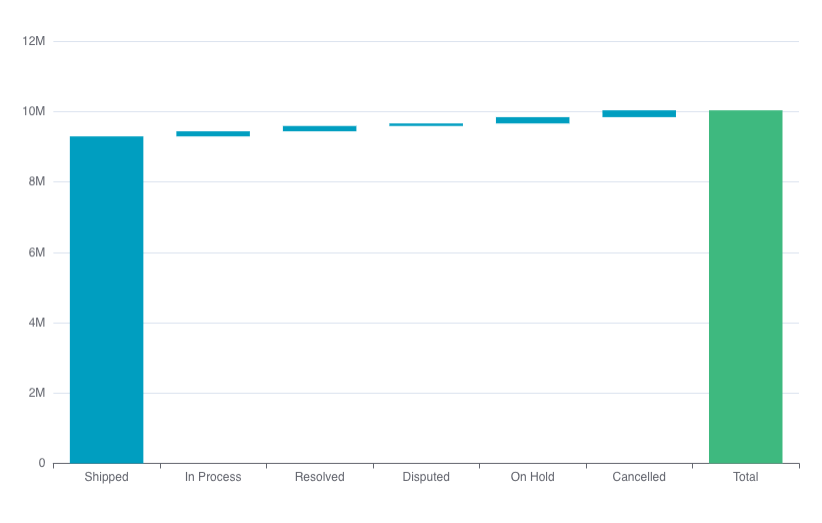
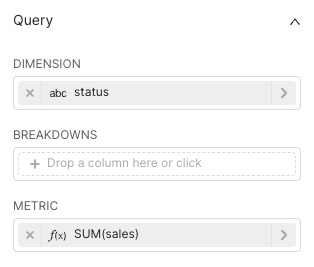
Example chart
Using status as my dimension and sales as my metric, I can see visualize how the sales numbers with different statuses contributed to my total sales.