Virtual Datasets: Views on your Database
A virtual dataset is a view of data that is created within Preset using SQL Lab. This means you can use JOIN and any other SQL operation to build your dataset.
Start by constructing your own unique SQL query that retrieves and organizes data based on your specifications, and then run your query.
After running the query, send the results to the Chart Builder page to see your query as a visualization. When doing so, you'll be prompted to save your data view into its own virtual dataset.
Accessing Virtual Datasets
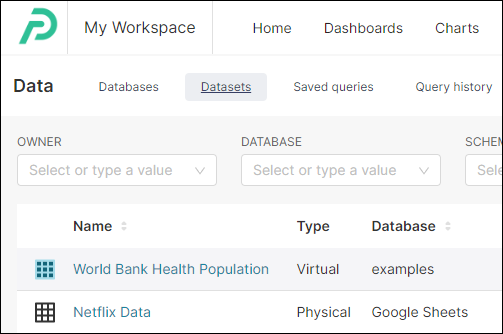
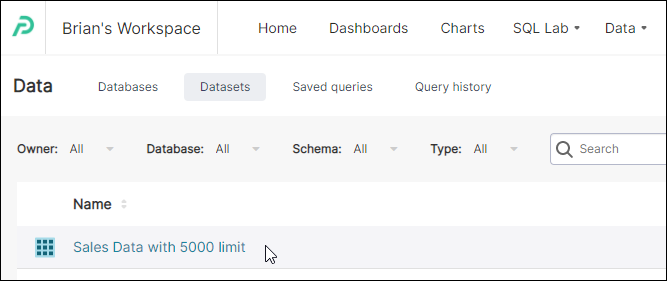
Virtual datasets are indicated by blue grid icons on the Datasets screen and are also designated as "Virtual" under the Type column. From here, you can manage, explore, delete, and view virtual datasets just like a physical dataset.
In the graphic below, the highlighted entry "World Bank Health Population" is the virtual dataset.
Detailed Walkthrough: Create a Virtual Dataset
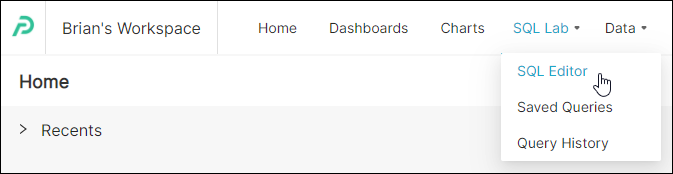
In the Toolbar, hover your cursor over SQL Lab and then, in the drop-down menu, select SQL Editor.
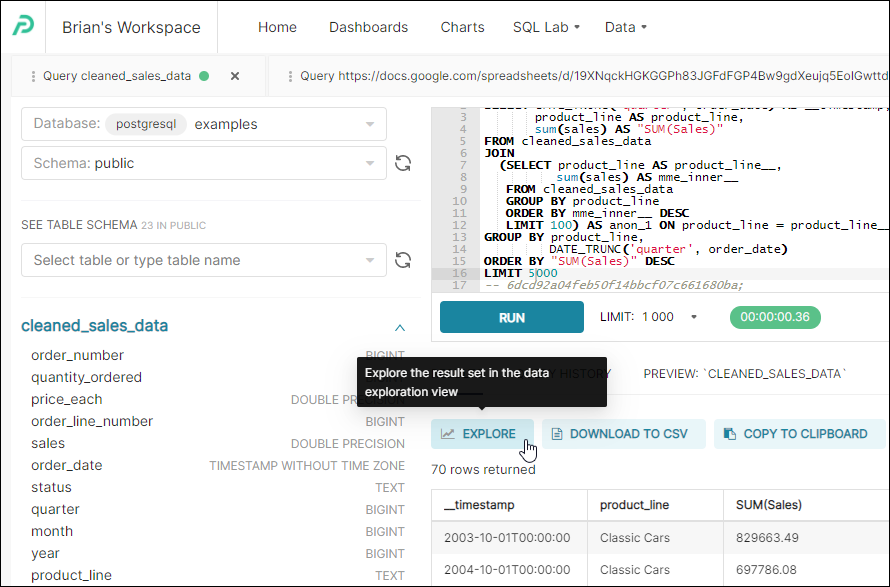
Compose a query and, when done, select Run.
In the Results tab, select Explore to view your query on the Chart Builder page.
The Save or Overwrite Dataset panel appears.
To save your new virtual dataset, select Save as new and, in the text-entry field, enter a name for your new virtual dataset.
If you are overwriting an existing virtual dataset, then select Overwrite existing and, in the field, enter or select a dataset name.
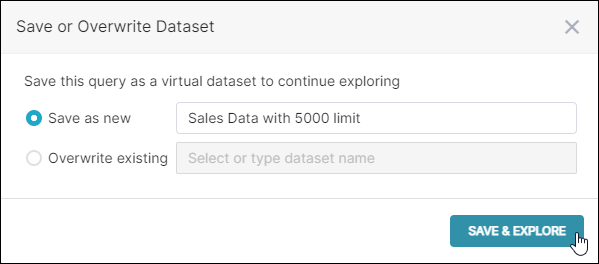
Select Save & Explore. The Chart Builder page appears featuring your virtual dataset.
At any time, you can browse to Data → Datasets to access your dataset.
Cross-dataset Joins
Preset runs all queries directly on your database. No extractions or data dumps are being stored on Preset, which could lead to stale data, limited scale and speed, and security issues. Security and governance are stronger as raw data never leaves your database and it is easy to control permissions via a single point of access.
Because raw data never leaves your database, cross database or cross dataset joins are not supported. Preset recommends that a robust semantic layer is built outside of the Business Intelligence tool for centralized governance and performance.
While cross-datasets joins are not support, scoping a filter allows one dataset to be filtered based on values from another dataset, as long as there's a column name.
Virtual Dataset Performance
Preset leverages the power and the speed of your existing backend, which means lighting fast results if your database is configured properly. Because virtual dataset are created from SQL queries (which might be complex and combine multiple tables) and Preset does not extract and store any raw data from your database, a virtual dataset's performance is dependent on the database processing speed.
When a dashboard loads, Preset first checks for cached results, and if none exists, processes each chart's underlying query. Any chart using a virtual dataset will execute both the chart's SQL query and the virtual dataset's SQL query during the dashboard / chart load. Overusing complex virtual datasets may create bottlenecks while loading a dashboard, resulting in a poor user experience.
See more information on maximizing performance.
Where Do I Go From Here?
Now that you have created a virtual dataset, you can proceed with creating and configuring a chart. Simply select your newly-created virtual dataset when asked to choose a dataset.
Here are some useful articles relating to charts: