Using this Information
Please read Semantic Layer to learn how to customize metrics, columns, and calculated columns.
Overview
Preset offers a wide variety of ways to use metrics and calculated columns, many of which are designed to save you time and effort when querying charts. This article discusses best practices for using metrics, how to efficiently use metrics (e.g., grouping, conditional percentages), using custom SQL in a metric, and real-world use cases for creating useful calculated columns.
Metrics Best Practices
- Remember to cast values to their proper format. Examples:
- INT / INT = INT → 1/10 = 0
- Decimal / Decimal or Decimal / INT or INT / Decimal = Decimal = 1.0/10 = 0.1
- Before implementation, be sure to test the metric in SQL Editor to validate a correct return.
- Provide a description of your metrics so that colleagues and other users can understand their purpose and usage.
- Use the D3 formatting correctly. Examples:
- Given a value of 1234.567
- .2% = 123456.7%
- .2k = 1K
- ,.2r = 1,200
- Given a value of 1234.567
- Metrics are SQL-specific and are translated when the query is executed, so it has to be SQL-compliant with the data source's Query Engine.
Using Metrics to Group Data
In order to save time continuously defining Group and Filter options when running a chart query, you can create a metric with grouped data.
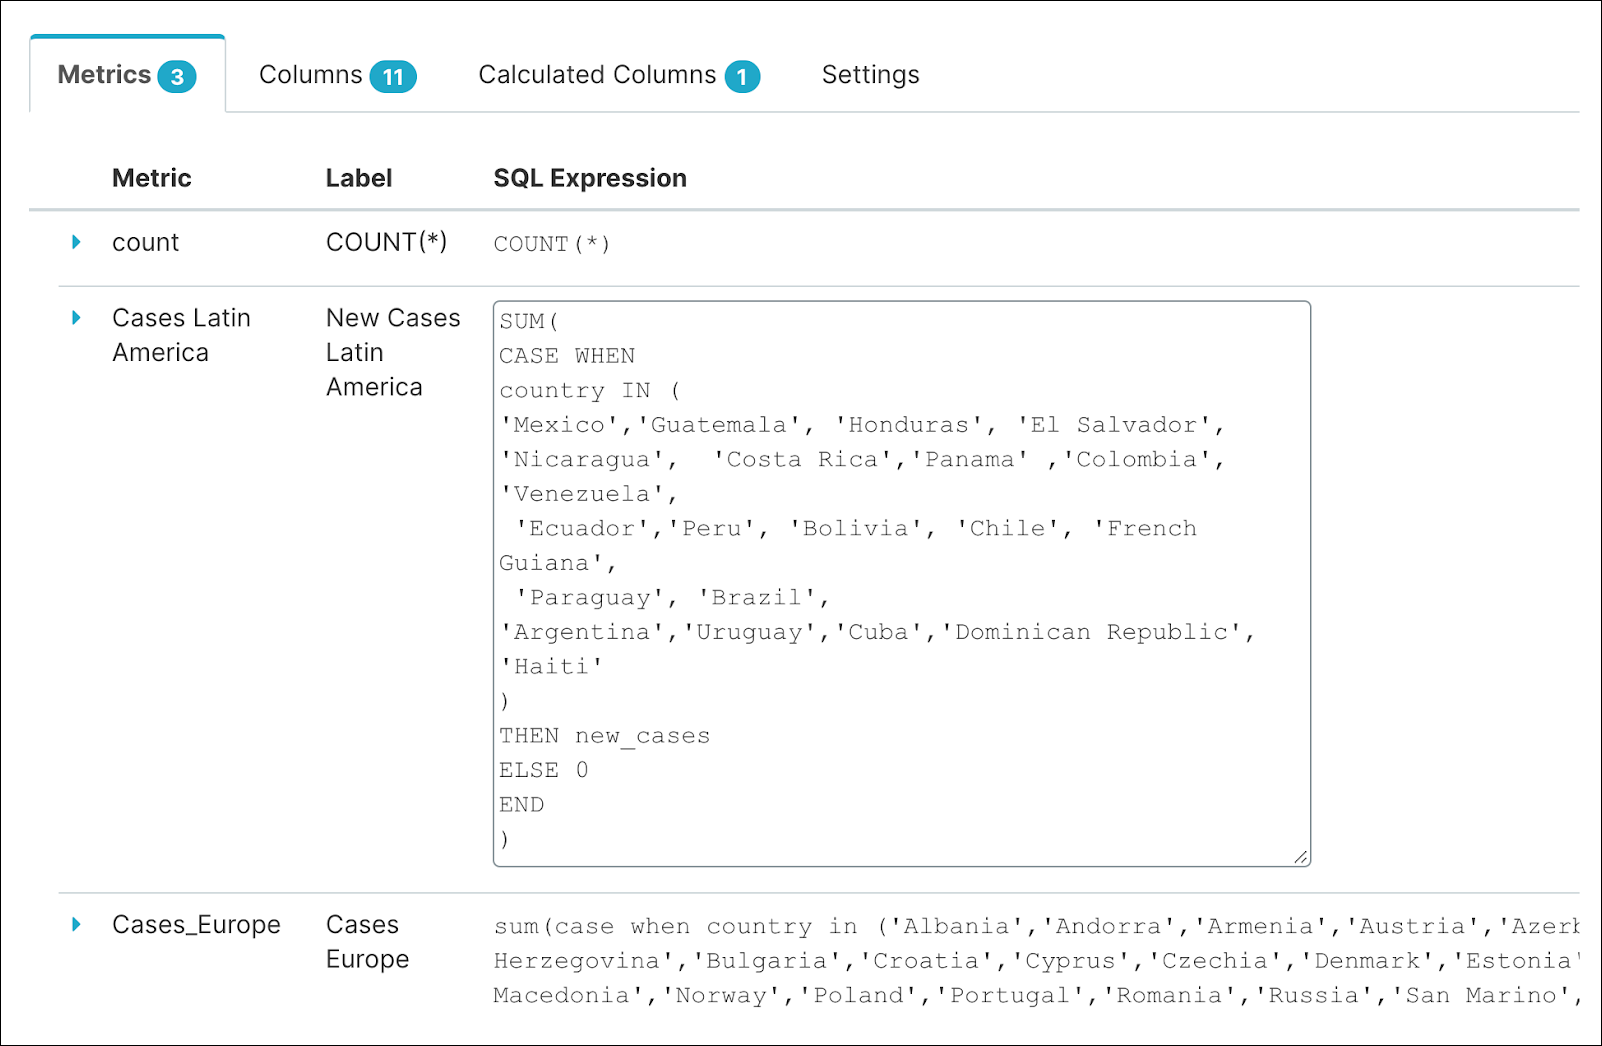
For example, if we are using a dataset based on Netflix data, we can create a variant of the "COUNT" metric to produce a grouped metric comprised of multiple countries in a specific region.
When adding such a metric, this is what the configuration settings might look like:
After the grouped metric is added, it appears in the datasource panel;
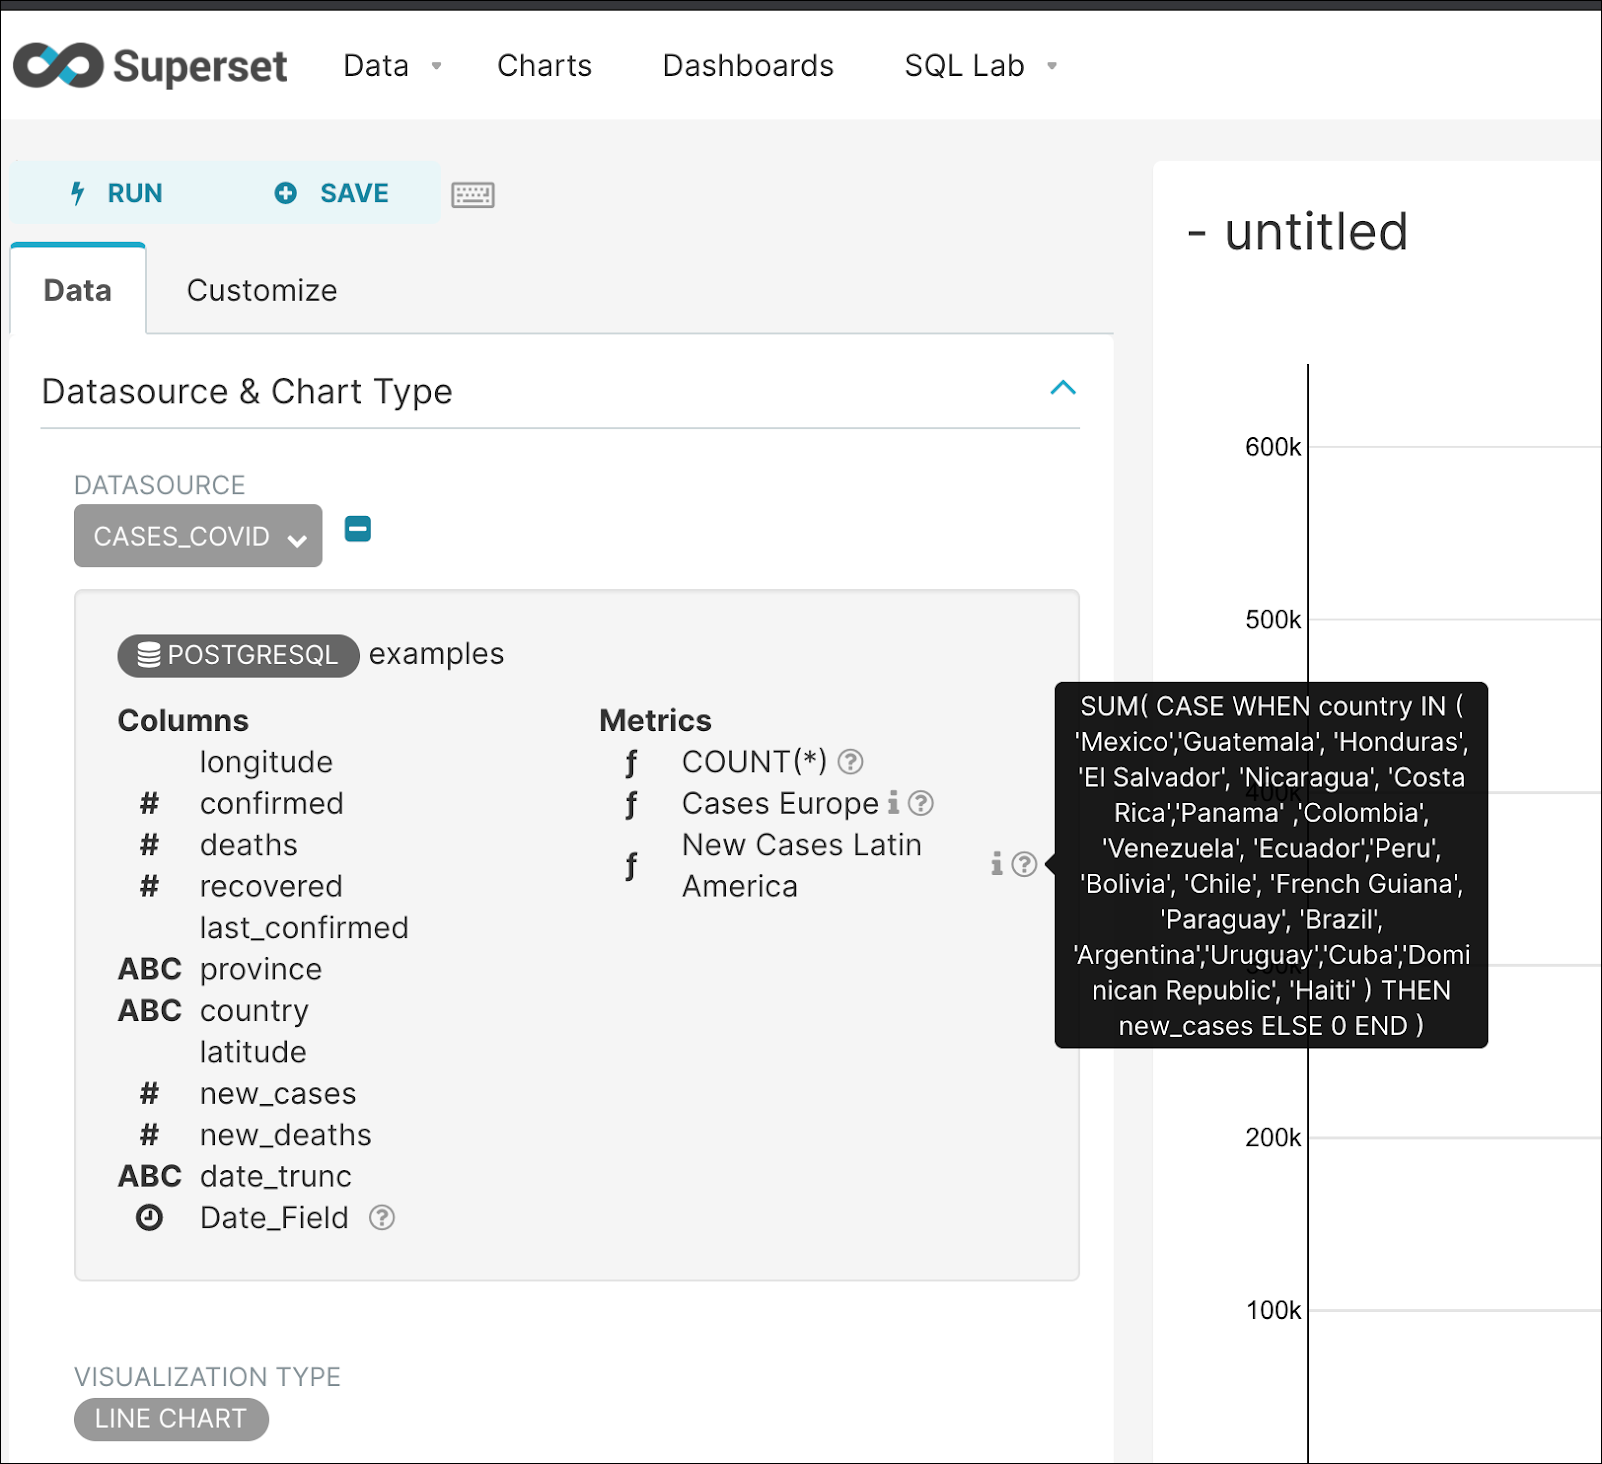
You now select the New Cases Latin America metric when building a chart...
...and viewing the entire query shows how the grouped query was inserted:
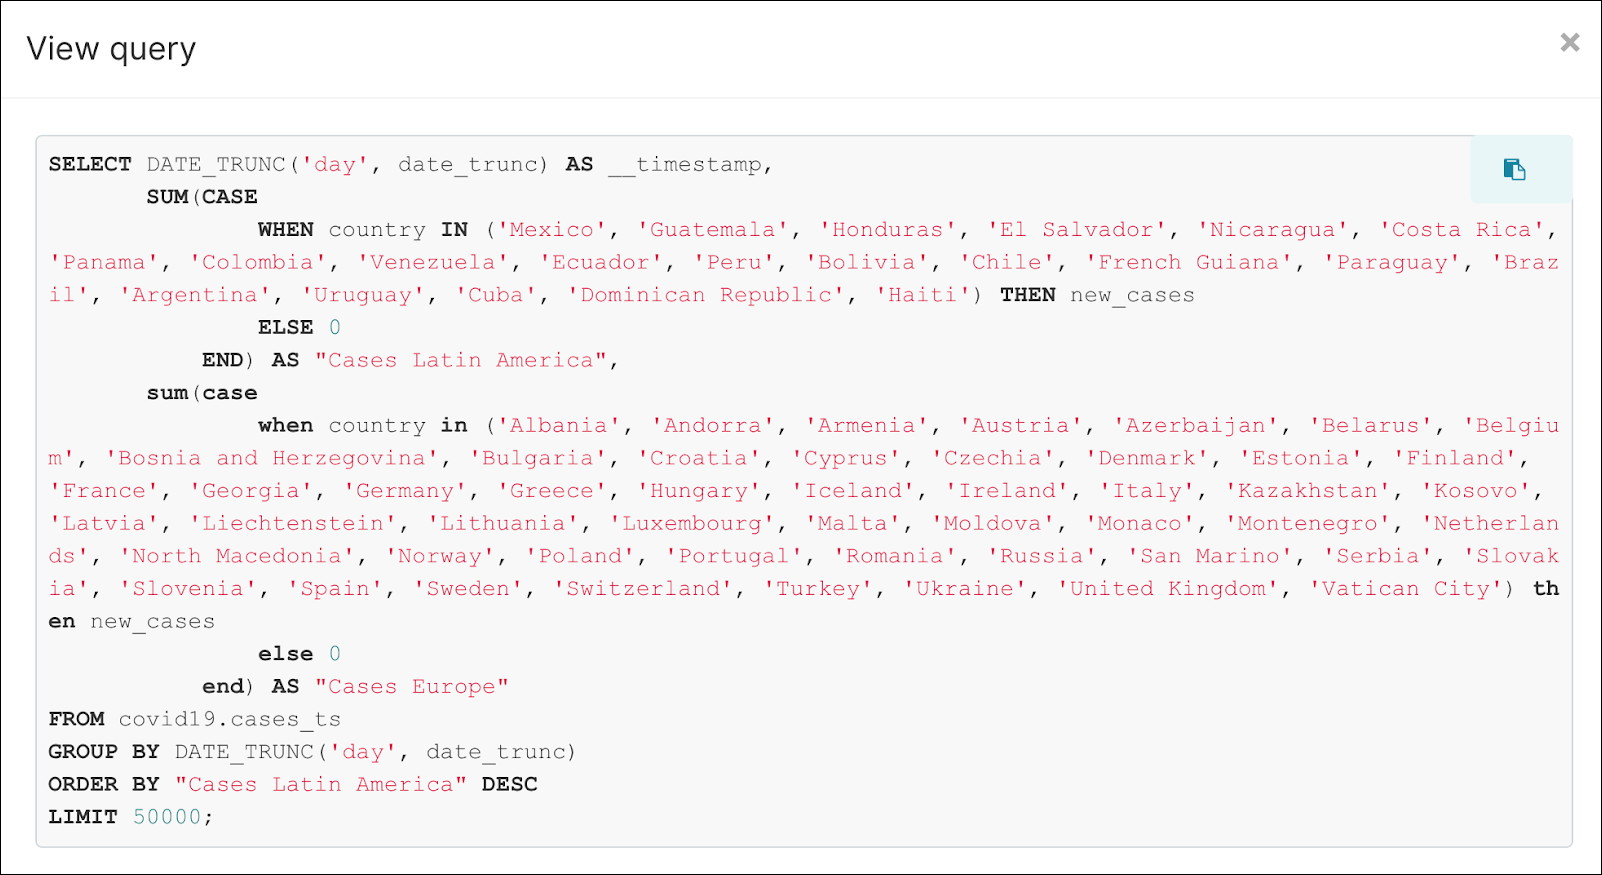
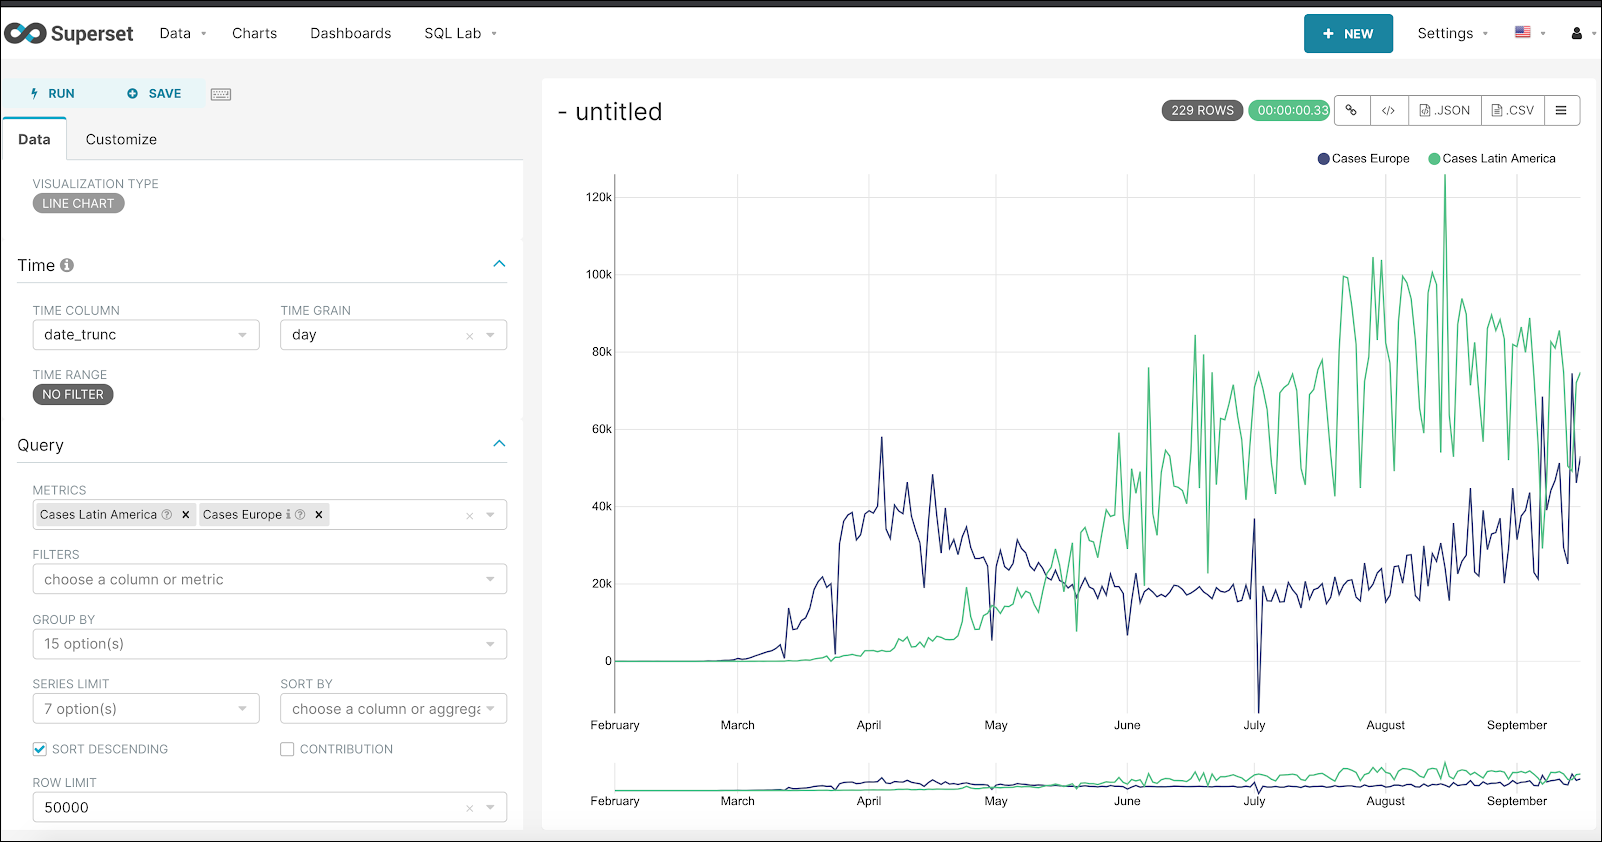
If you look closely, you'll notice that another grouped metric—Cases Europe—was also used in the same manner.
Metrics for Conditional Percentage
You can also create metrics that convey a conditional percentage value; meaning, a value that changes based on an outside factor.
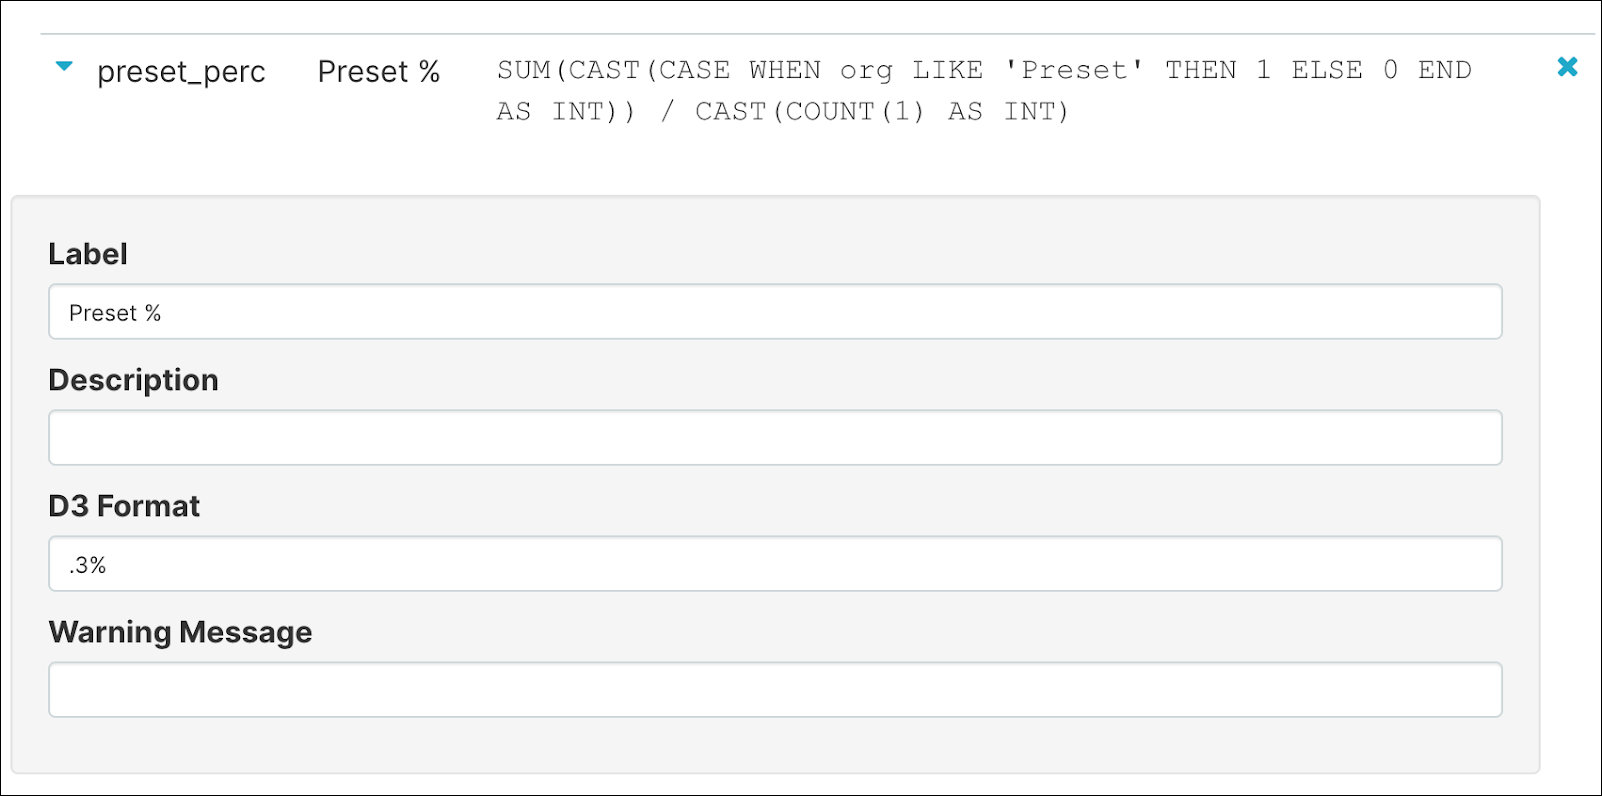
For example, we can create a metric that shows a resource processing percentage for the 'Preset' organization. This can be done by using 2 aggregates that count how many rows have org = 'Preset' divided by the total count of rows processed.
The SQL would look as follows:
SUM(CAST(CASE WHEN org LIKE 'Preset' THEN 1 ELSE 0 END AS INT))
/ CAST(COUNT(1) AS INT)
...and the new metric created from this would look as follows:
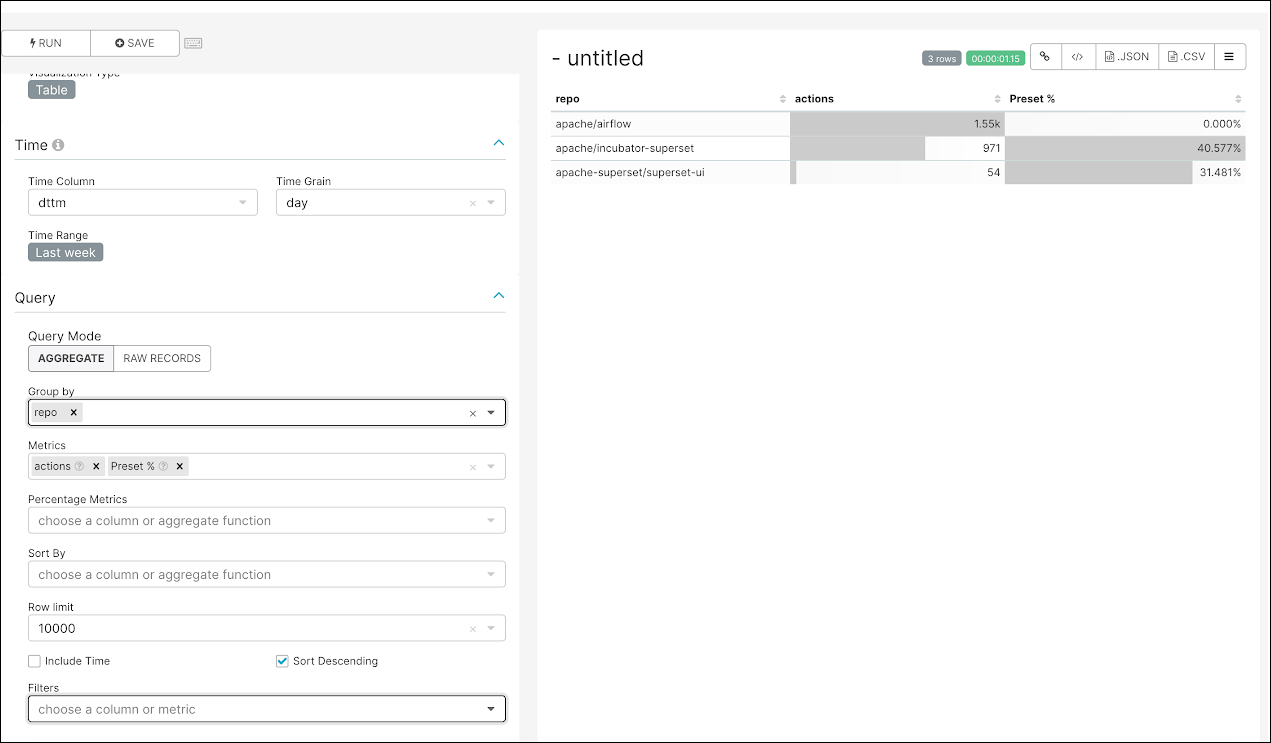
In the table chart below, we have selected the newly-made metric: Preset %. Notice the "Preset %" column and how it displays different percentile values based on the repository being used.
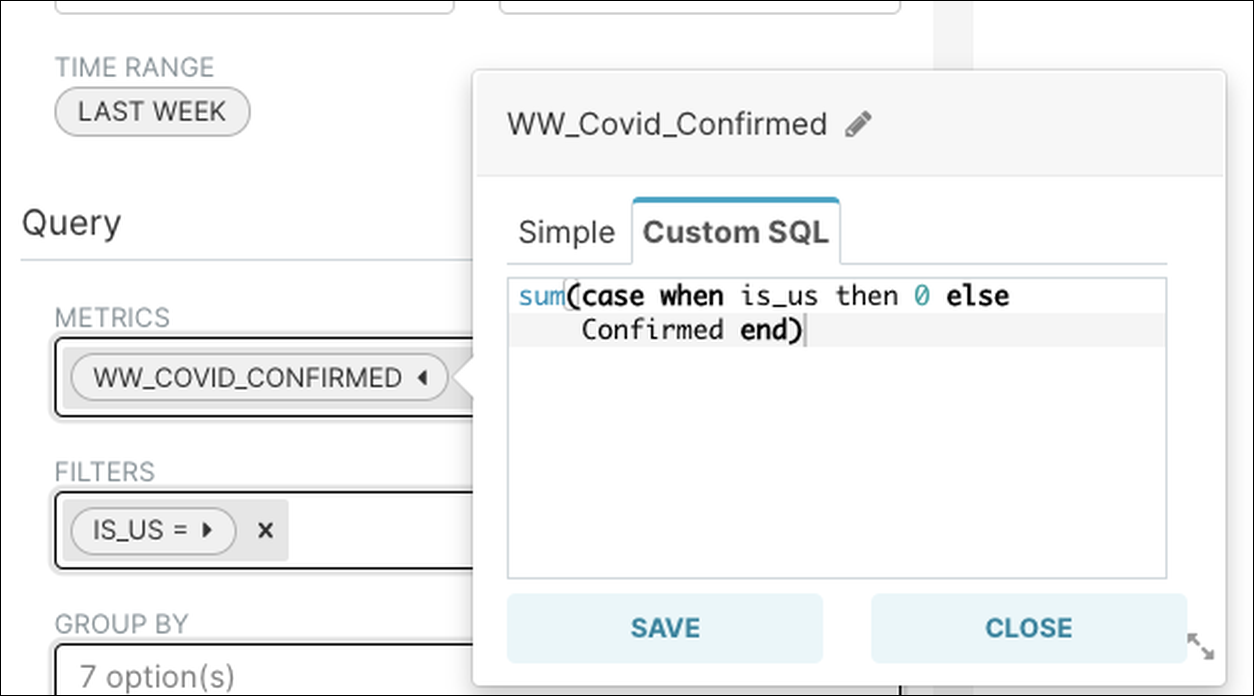
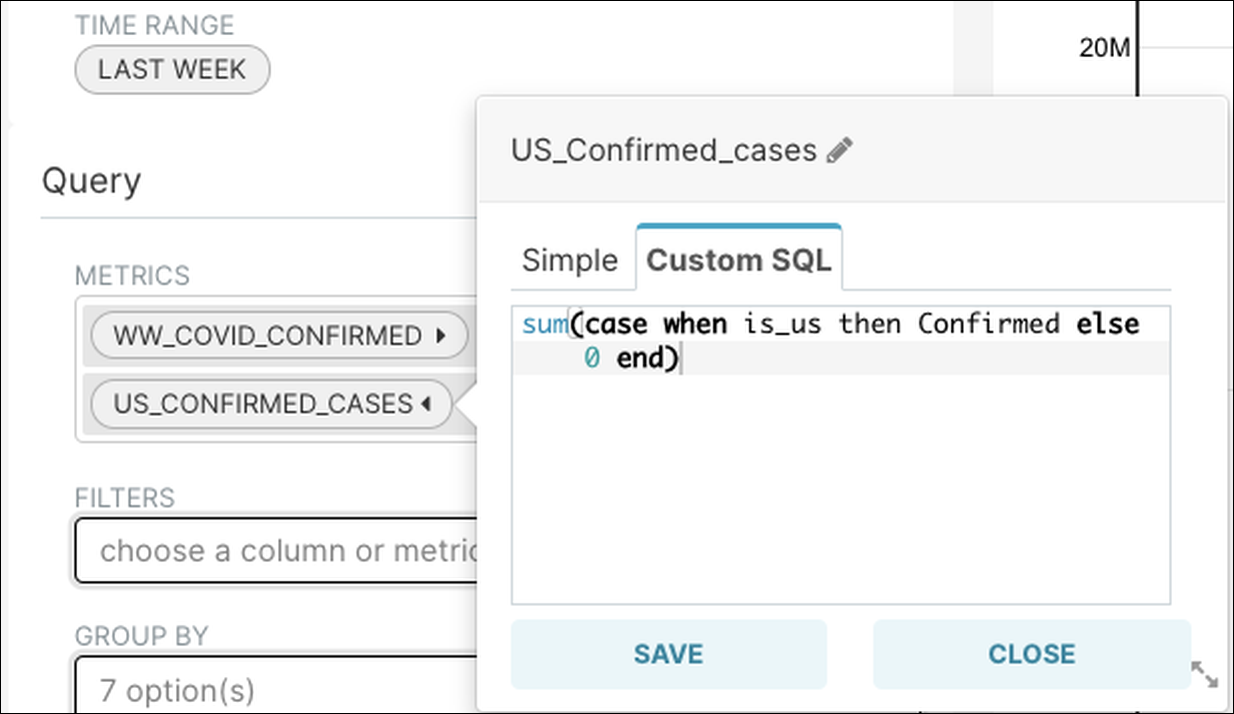
Metric in Charts Using Custom SQL
If you need to apply an ad-hoc usage of a SQL expression, you can include it in the Custom SQL tab when a metric is selected.
Calculated Columns - Data Transformation
Example 1: Integer to Date Casting
- Goal: Date format of 20201223
- Calculated Column: to_date(date::varchar(10),'YYYYMMDD')
Example 2: Dates Calculation
- Goal: Columns that can calculate the difference between dates
- Calculated Column: datediff(day, date_trunc, sysdate())
Example 3: Bucketing Numbers
- Goal: Bucketing numbers makes it easier to represent and group data in different charts. The histogram chart performs number bucketing automatically, but other charts require a calculated column.
- Given: Field1 = Numeric Field
- Calculated Column:
Case When Field1 < 100 then 'a.Less 100'
	   When Field1 between 101 and 200 then 'b.100-200'
	   When Field1 between 201 and 500 then 'c.201-500'
	   When field1 > 500 then 'd.More than 500'
End
Calculated Column - Data Enrichment
Example 1: Build a Github Ticket Link
- Goal: Use a calculated column to define the syntax for a Github ticket link.
- Sample End Link: https://github.com/apache/incubator-superset/issues/10767
- Database Data:
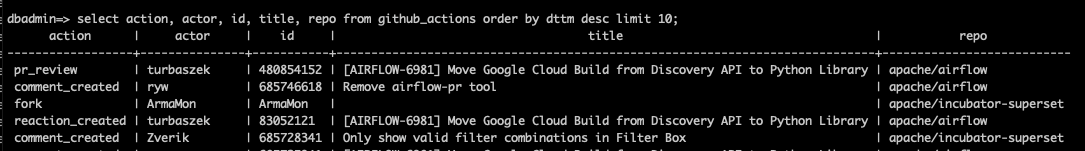
- Calculated Column:
'<a href="https://github.com/' || repo || '/issues/' || parent_id || '">' || title || '</a>'
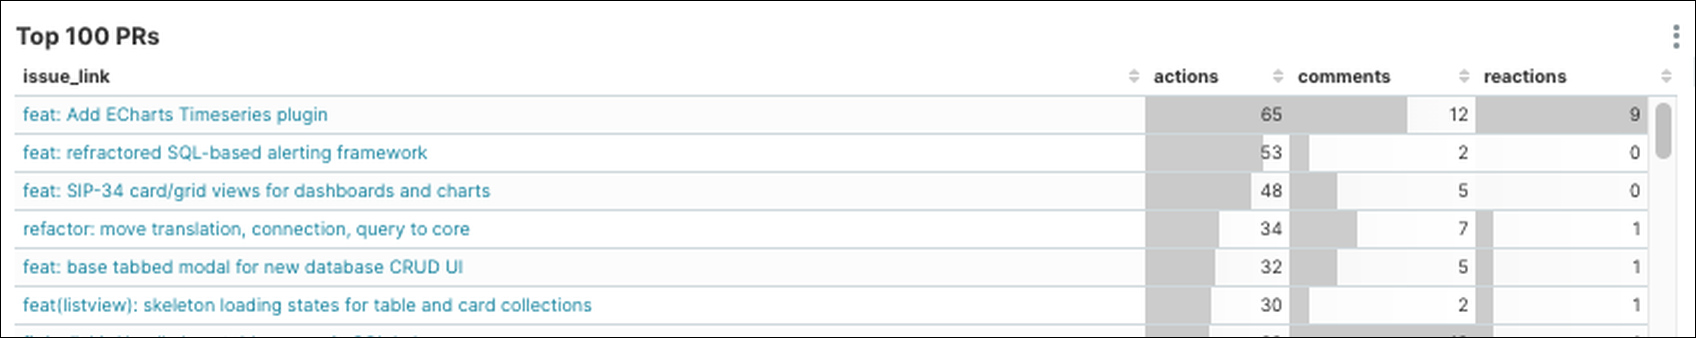
- End Result:
Example 2: Calculate Rate Between Two Columns
- Goal: Calculate a rate between the values of two columns → Field1 and Field2
- Calculated Column:
Case
    When Field1 > 0 then Field2/Field1
    Else 1
End
Example 3: Create a Boolean Converter Field
- Goal: Converter Field1 that is boolean to YES or NO.
- Calculated Column:
Case
    When Field1 is 0 then 'No'
    When Field1 is 1 then 'Yes'
    Else 'N/A’
End