Overview
This article covers how to use Jinja Templating to dynamically change a Chart's aggregated column:
You can download a ZIP file to import this example dashboard on your Workspace — choose the option according to your Workspace location:
The Process
This process consists of 3 steps:
Creating a calculated column on the dataset, that will be used to fetch the dashboard filter value
Creating a dataset with options to populate our dashboard filter
Configuring the dashboard
Let's have a closer look at each step.
Step 1: Create a Calculated Column on the Dataset
For this example, we’ll use an aggregated Table Chart (connected to the Vehicle Sales dataset from the examples database) to calculate the sum of price values, aggregated based on a dynamic dimension controlled via a dashboard filter.
In the Chart Builder view, create an aggregated Table Chart using SUM(price_each) as your metric. Let's use Jinja to create a calculated column to be used as our dynamic dimension. To do so:
Click on the three ellipsis (...) next the dataset name > Edit dataset.
Navigate to the CALCULATED COLUMNS tab.
Create a calculated column using below syntax:
{% if filter_values('aggregation')|length %}
	{{ filter_values('aggregation')[0] }}
{% else %}
	month
{% endif %}
The syntax has an if statement, checking if there's any value applied to a dashboard filter powered by the aggregation column:
If so, the filter value will be added to the SQL syntax, as the actual column to be used.
If not,
monthwill be used as a default column.
This is the final result:
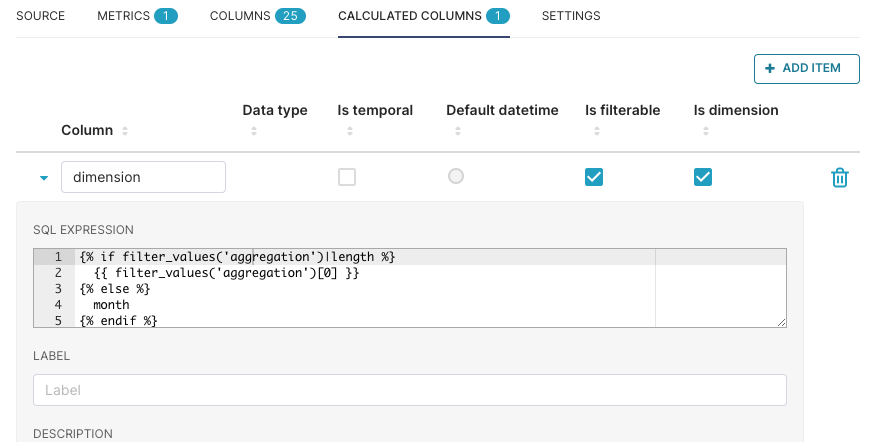
Save your changes, and the dimension column should now be available to be used in the Chart Builder. Add it as a dimension to the chart:
.png")
Save your chart and add it to a dashboard.
Step 2: Create a Dataset to Populate the Dashboard Filter
There are different ways to achieve this goal:
Creating a table/view on the database level: could be useful so that you can manipulate the table values directly on your database;
Using a Google Sheets file: useful when you don't want to handle this on the database level. Further details on connecting Google Sheets as a database to Preset on this article.
Using an ad-hoc SQL query: fast approach that can be very useful when creating just a few options.
We'll use the last approach for this example, creating a virtual dataset with the following query:
select 'product_line' as aggregation
union all
select 'country' as aggregation
To create a virtual dataset powered by this SQL query:
Access your Workspace.
Navigate to SQL > SQL Lab.
Make sure the examples connection is selected.
Paste the query and click on RUN.
To save it as a dataset, click on the SAVE dropdown and choose Save dataset.
Provide a name for your dataset and click on SAVE & EXPLORE.
Note that the column name (in this case defined as aggregation), is used on the Jinja syntax, by the filter_values() macro. Make sure to update your Jinja syntax if using a different column name.
Depending on your database engine, you can also query the information schema to list all column values - for example, this query can be used on a Postgres database:
SELECT column_name
FROM information_schema.columns
WHERE table_schema = '{{SchemaName}}'
AND table_name   = '{{TableName}}';
Step 3: Configure the Dashboard
Access the dashboard created with your chart and create a new filter - use the dataset/column created on the previous step:
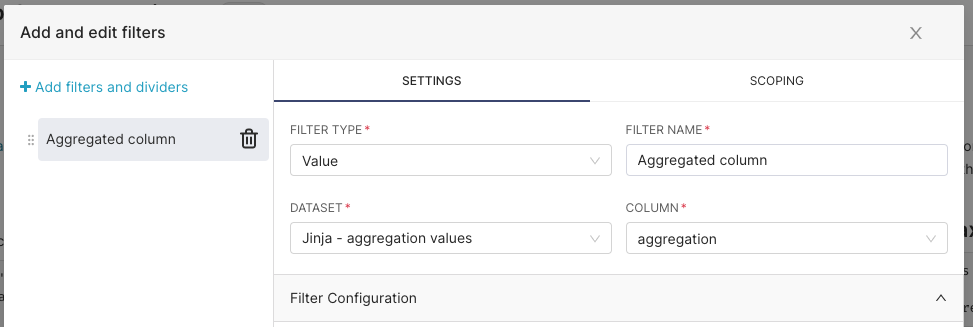
Important details:
Since the chart is using another dataset, this filter won't be automatically mapped to it. Access the SCOPING tab, and map the filter to the chart.
Disable Can select multiple values, since we won't use multiple values for this example.
You should now be able to interact with the chart's custom SQL filter using a dashboard filter.