Overview
In this article, we will learn how to use Jinja Templating to retrieve filter selections that can be used directly in your Virtual Dataset's SQL query:
You can download a ZIP file to import this example dashboard on your Workspace:
The Process
This process consists of 3 steps:
- Create a Virtual Dataset.
- Create a Chart from the Virtual Dataset and add it to a Dashboard.
- Configure the Dashboard filters.
Let's have a closer look at each step.
Step 1: Create a Virtual Dataset
For this example, we'll use the Vehicle Sales table from the examples database.
Consider the query below:
WITH calculation as (
	SELECT count(*) as count, country
	FROM "Vehicle Sales"
	WHERE product_line in ('Classic Cars', 'Motorcycles')
	GROUP BY country
)
SELECT * FROM calculation
If you create a Virtual Dataset using this query, it will have only two columns: count and country. As a consequence, you won't be able to create a native dashboard filter to control the product_line options. This is just a simple example use-case in which your dashboard filter should be applied to the inner query (instead of the outer dataset query).
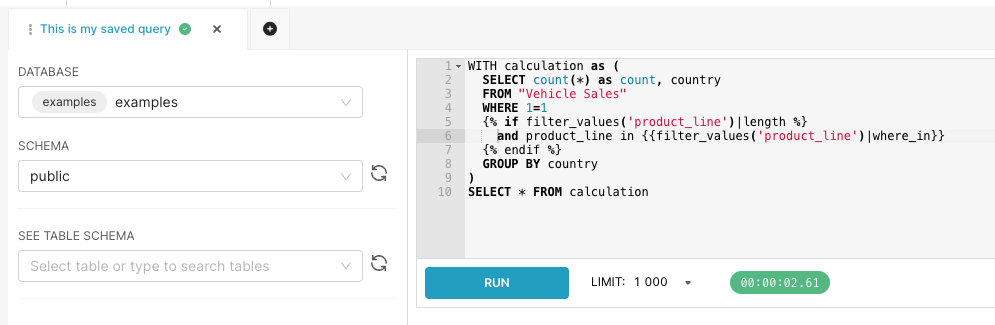
To achieve this implementation, we'll use logical statements and the filter_values() Jinja macro. Here's the updated SQL query:
WITH calculation as (
	SELECT count(*) as count, country
	FROM "Vehicle Sales"
	WHERE 1=1
	{% if filter_values('product_line')|length %}
		and product_line in {{filter_values('product_line')|where_in}}
  	{% endif %}
	GROUP BY country
)
SELECT * FROM calculation- The
filter_values()macro returns an array of all options selected in a dashboard filter.product_lineparameter is used to specify the column that's powering the filter we'll be using. - The
ifstatement is checking if this returned array has a length set (if0is returned, the statement condition is not met). - The
|where_inoperator automatically formats this array into a SQL-compatible format (["Classic Cars", "Vintage Cars"]becomes('Classic Cars', 'Vintage Cars')).
To execute this query in SQL Lab:
- Access your Workspace.
- Navigate to SQL > SQL Lab.
- Make sure the examples connection is selected.
- Paste the query and click on RUN.
This is the produced SQL query:
-- 6dcd92a04feb50f14bbcf07c661680ba
WITH calculation as (
	SELECT count(*) as count, country
	FROM "Vehicle Sales"
	WHERE 1=1
	GROUP BY country
)
SELECT * FROM calculation
LIMIT 100001
-- 6dcd92a04feb50f14bbcf07c661680ba
Click on CREATE CHART to build a chart from this query.
Step 2: Create a Chart from the Virtual Dataset and add it to a Dashboard
You should have been redirected to the Chart Builder view. For this example, we can use the table chart with the default configurations:
- Click on SAVE in the top right corner.
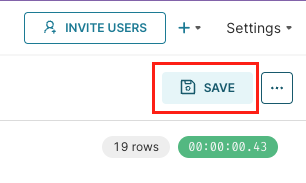
- Name your dataset, chart and also create a dashboard to it:
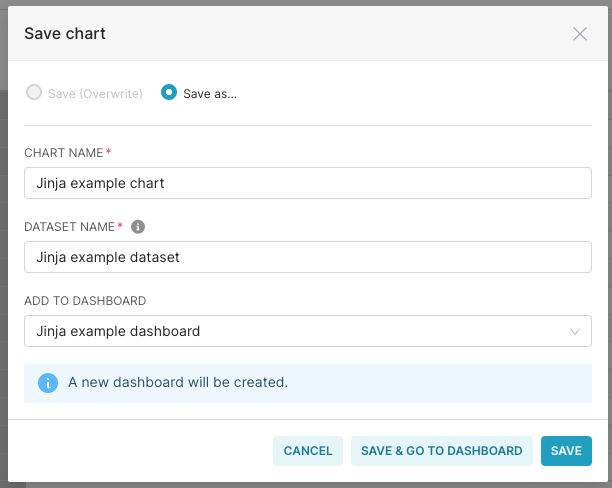
- Click on the SAVE & GO TO DASHBOARD button.
Step 3: Configure the Dashboard filters
The dashboard will launch in your browser. To configure the filter:
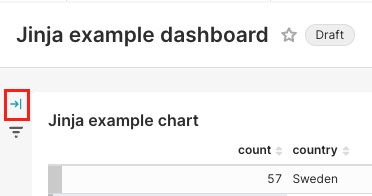
- Click on the right arrow to expand the Filter menu.
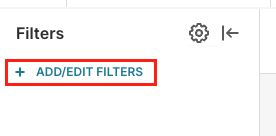
- Click on + Add/Edit Filters.
- The Filter modal is launched. In the Filter Name field, enter a name for your filter.
- In the Dataset field, select the dataset that actually contains the column with the desired options (in this case, the Vehicle Sales dataset).
- In the Column field, select the column that contains the desired options (in this case,
product_line).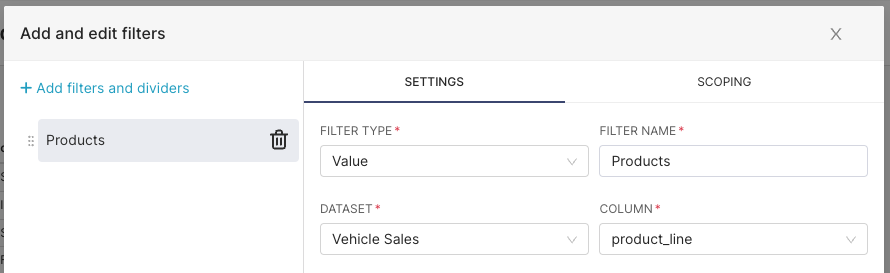
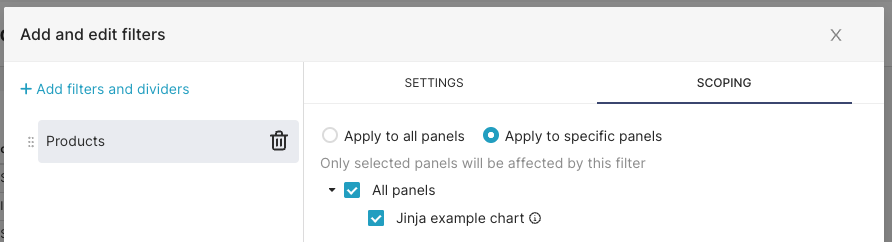
- Next, navigate to the Scoping tab, and map the filter to your chart. This process didn't happen automatically because the dataset powering the filter is different than the dataset powering the chart.
- Click on Save.
Great work! Now let's see the filter in action: