Usage Metrics Availability
The Admin Dashboards containing usage metrics are only available to teams on the Enterprise plan.
Overview
This article discusses how Team Admins can view usage metrics such as the volumes of active users, connected databases, and dashboards and charts that have been created.
Available Metrics
The following usage metrics are available to teams on the Enterprise plan today.
| Usage Metric | Definition |
|---|---|
| Monthly active users | The number of users who have visited a workspace in the previous 28 days. |
| Weekly active users | The number of users who have visited a workspace in the previous 7 days. |
| Daily active users | The number of users who have visited a workspace in the previous 24 hours. |
| Dashboard: Last 28 day member count | The number of unique users who have accessed a dashboard in the previous 28 days. |
| Dashboard: Last 28 day view count | The number of times a dashboard was viewed in the previous 28 days. |
| Active dashboards over time | The number of dashboards with at least one view in the previous month, week, or day. |
| Chart: Last 28 day member count | The number of users who have accessed a chart in the previous 28 days |
| Chart: Last 28 day view count | The number of times a chart was viewed in the previous 28 days. |
| Active charts over time | The number of charts with at least one view in the previous 28 days, 7 days, or 24 hours. |
Access the Admin Dashboard
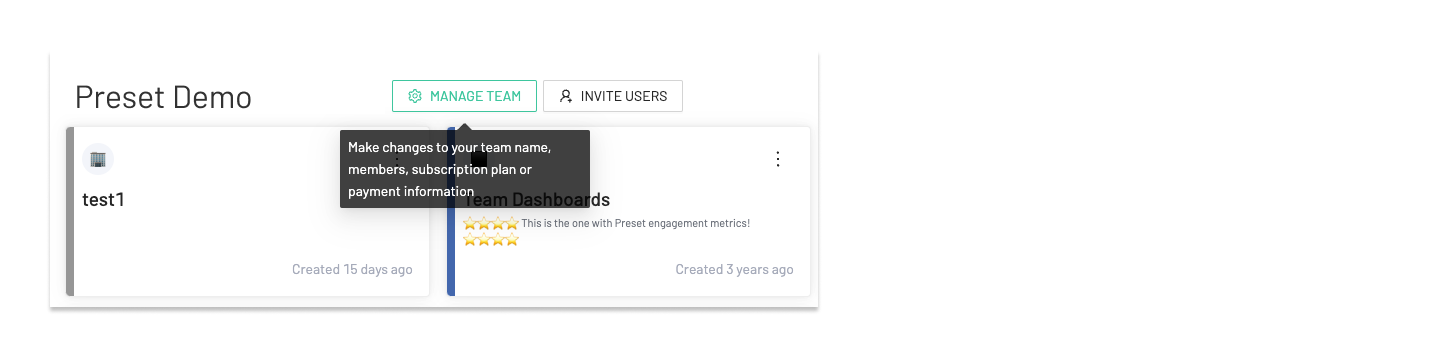
From Preset Manager, select Manage Team and click on Usage Metrics.
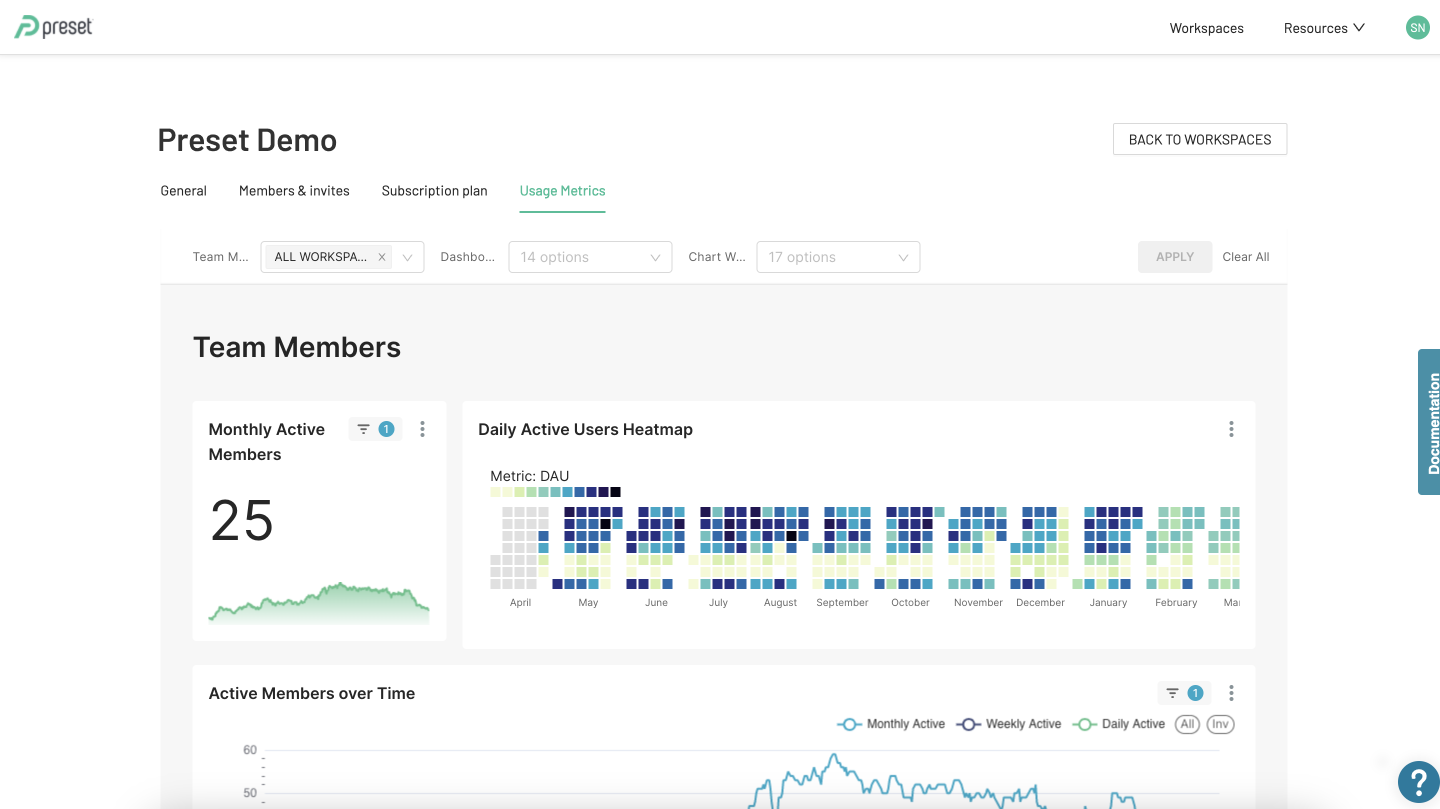
Apply Filters
You can filter to view usage metrics for specific workspaces, dashboards, and/or charts. Select the corresponding filters in the "Dashboard filter bar".
Dashboard filters are specific to the visualizations!
Filtering on "Team Member Workspace" filters down the visualizations in the "Team Members" section, but not those in the "Dashboards" and "Charts" sections.