
Jul 23, 2026 (v6.0.0.21)
New Features
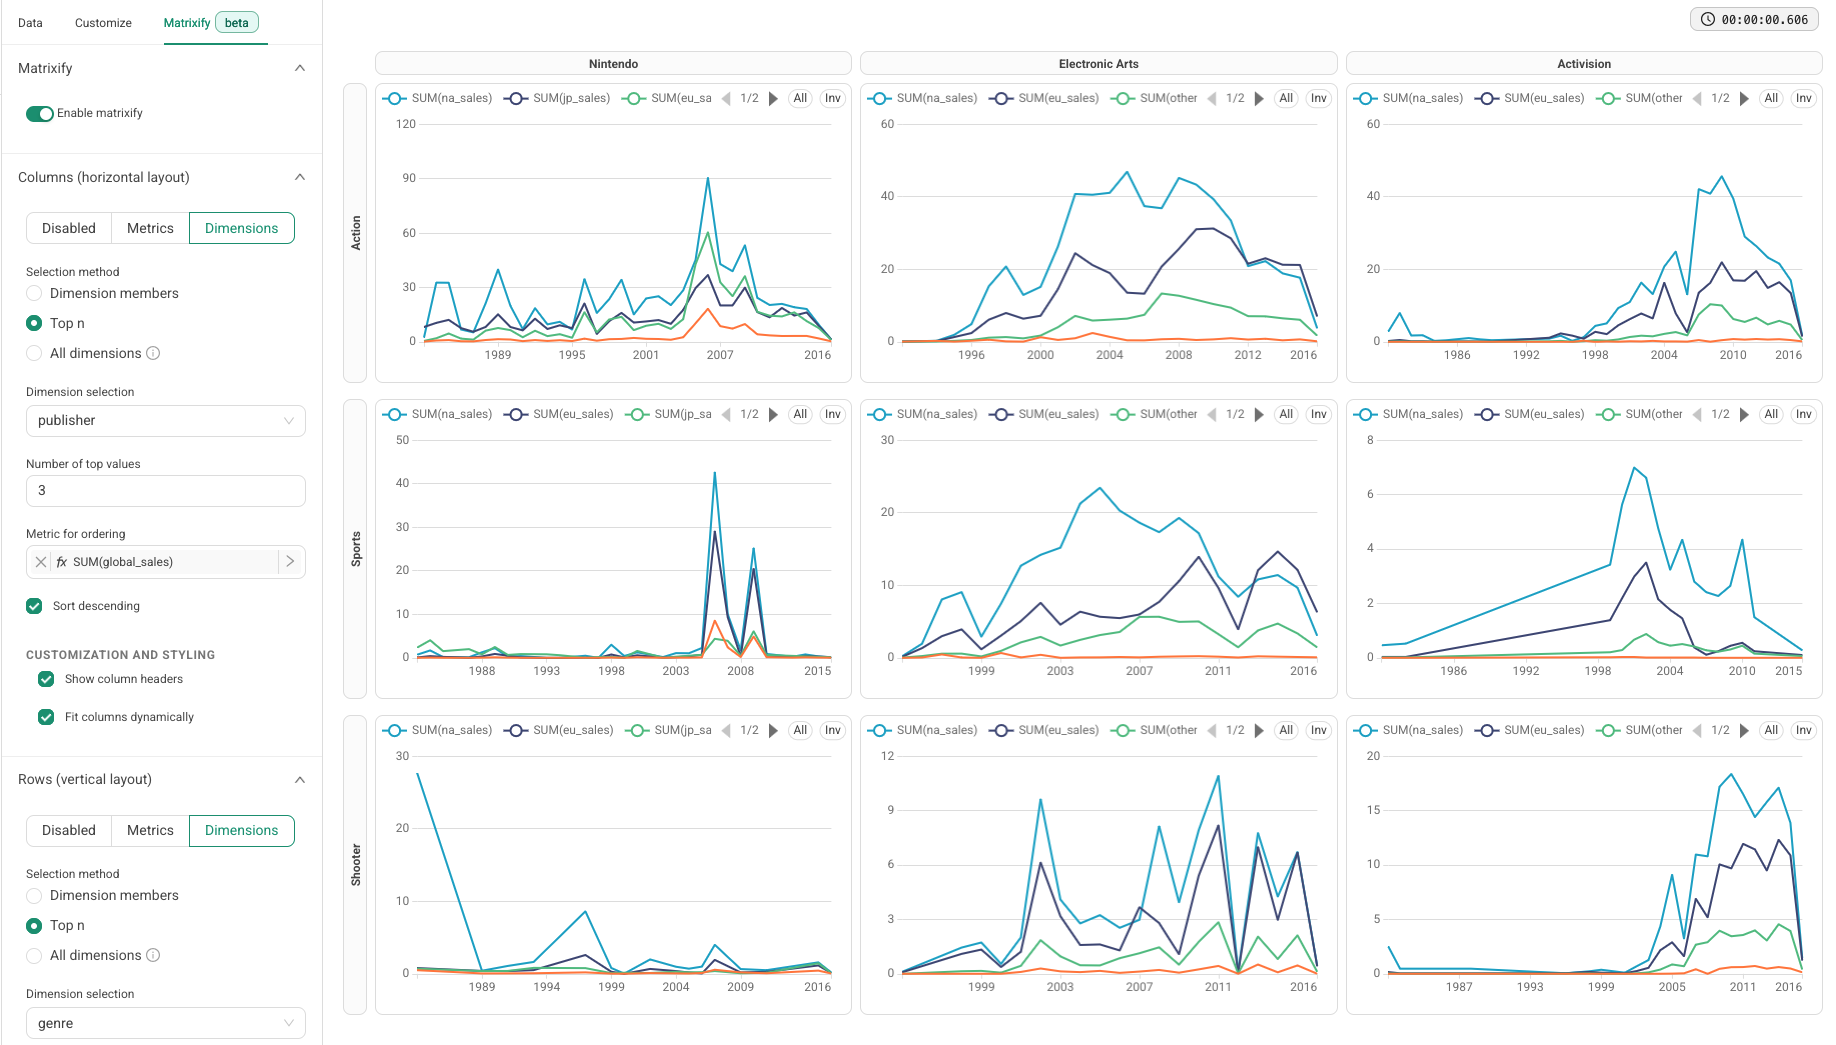
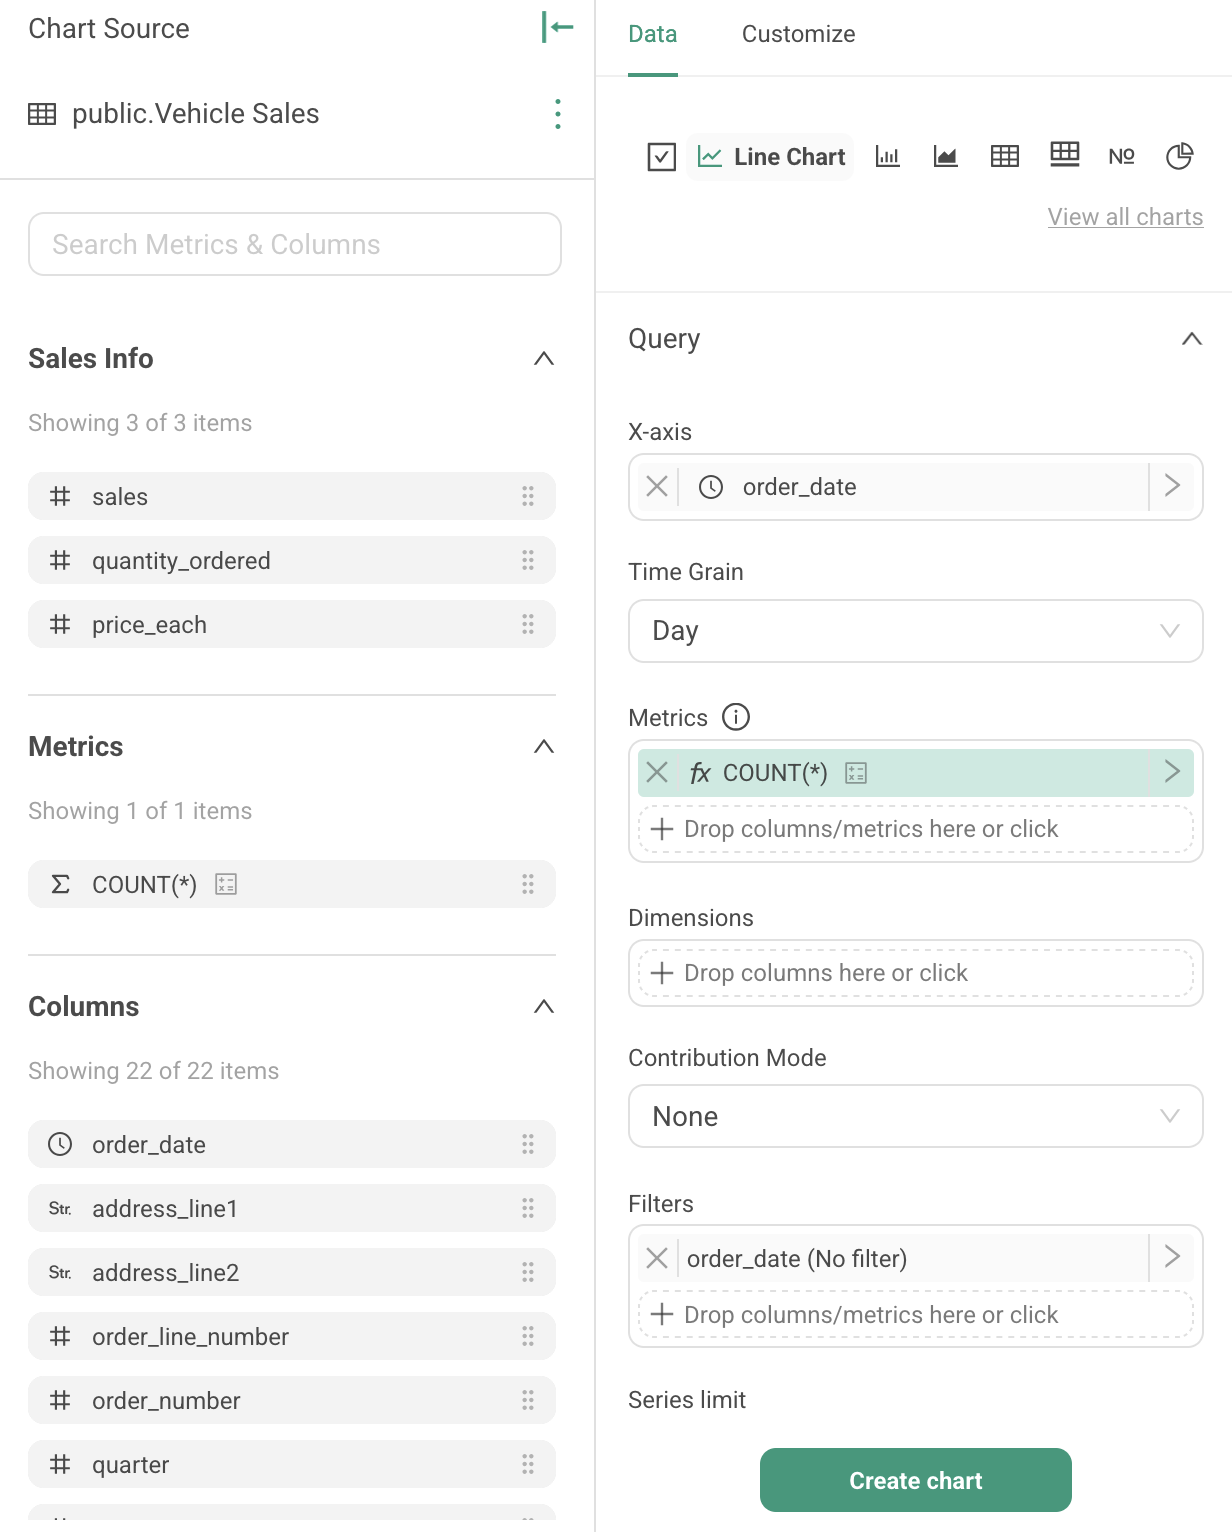
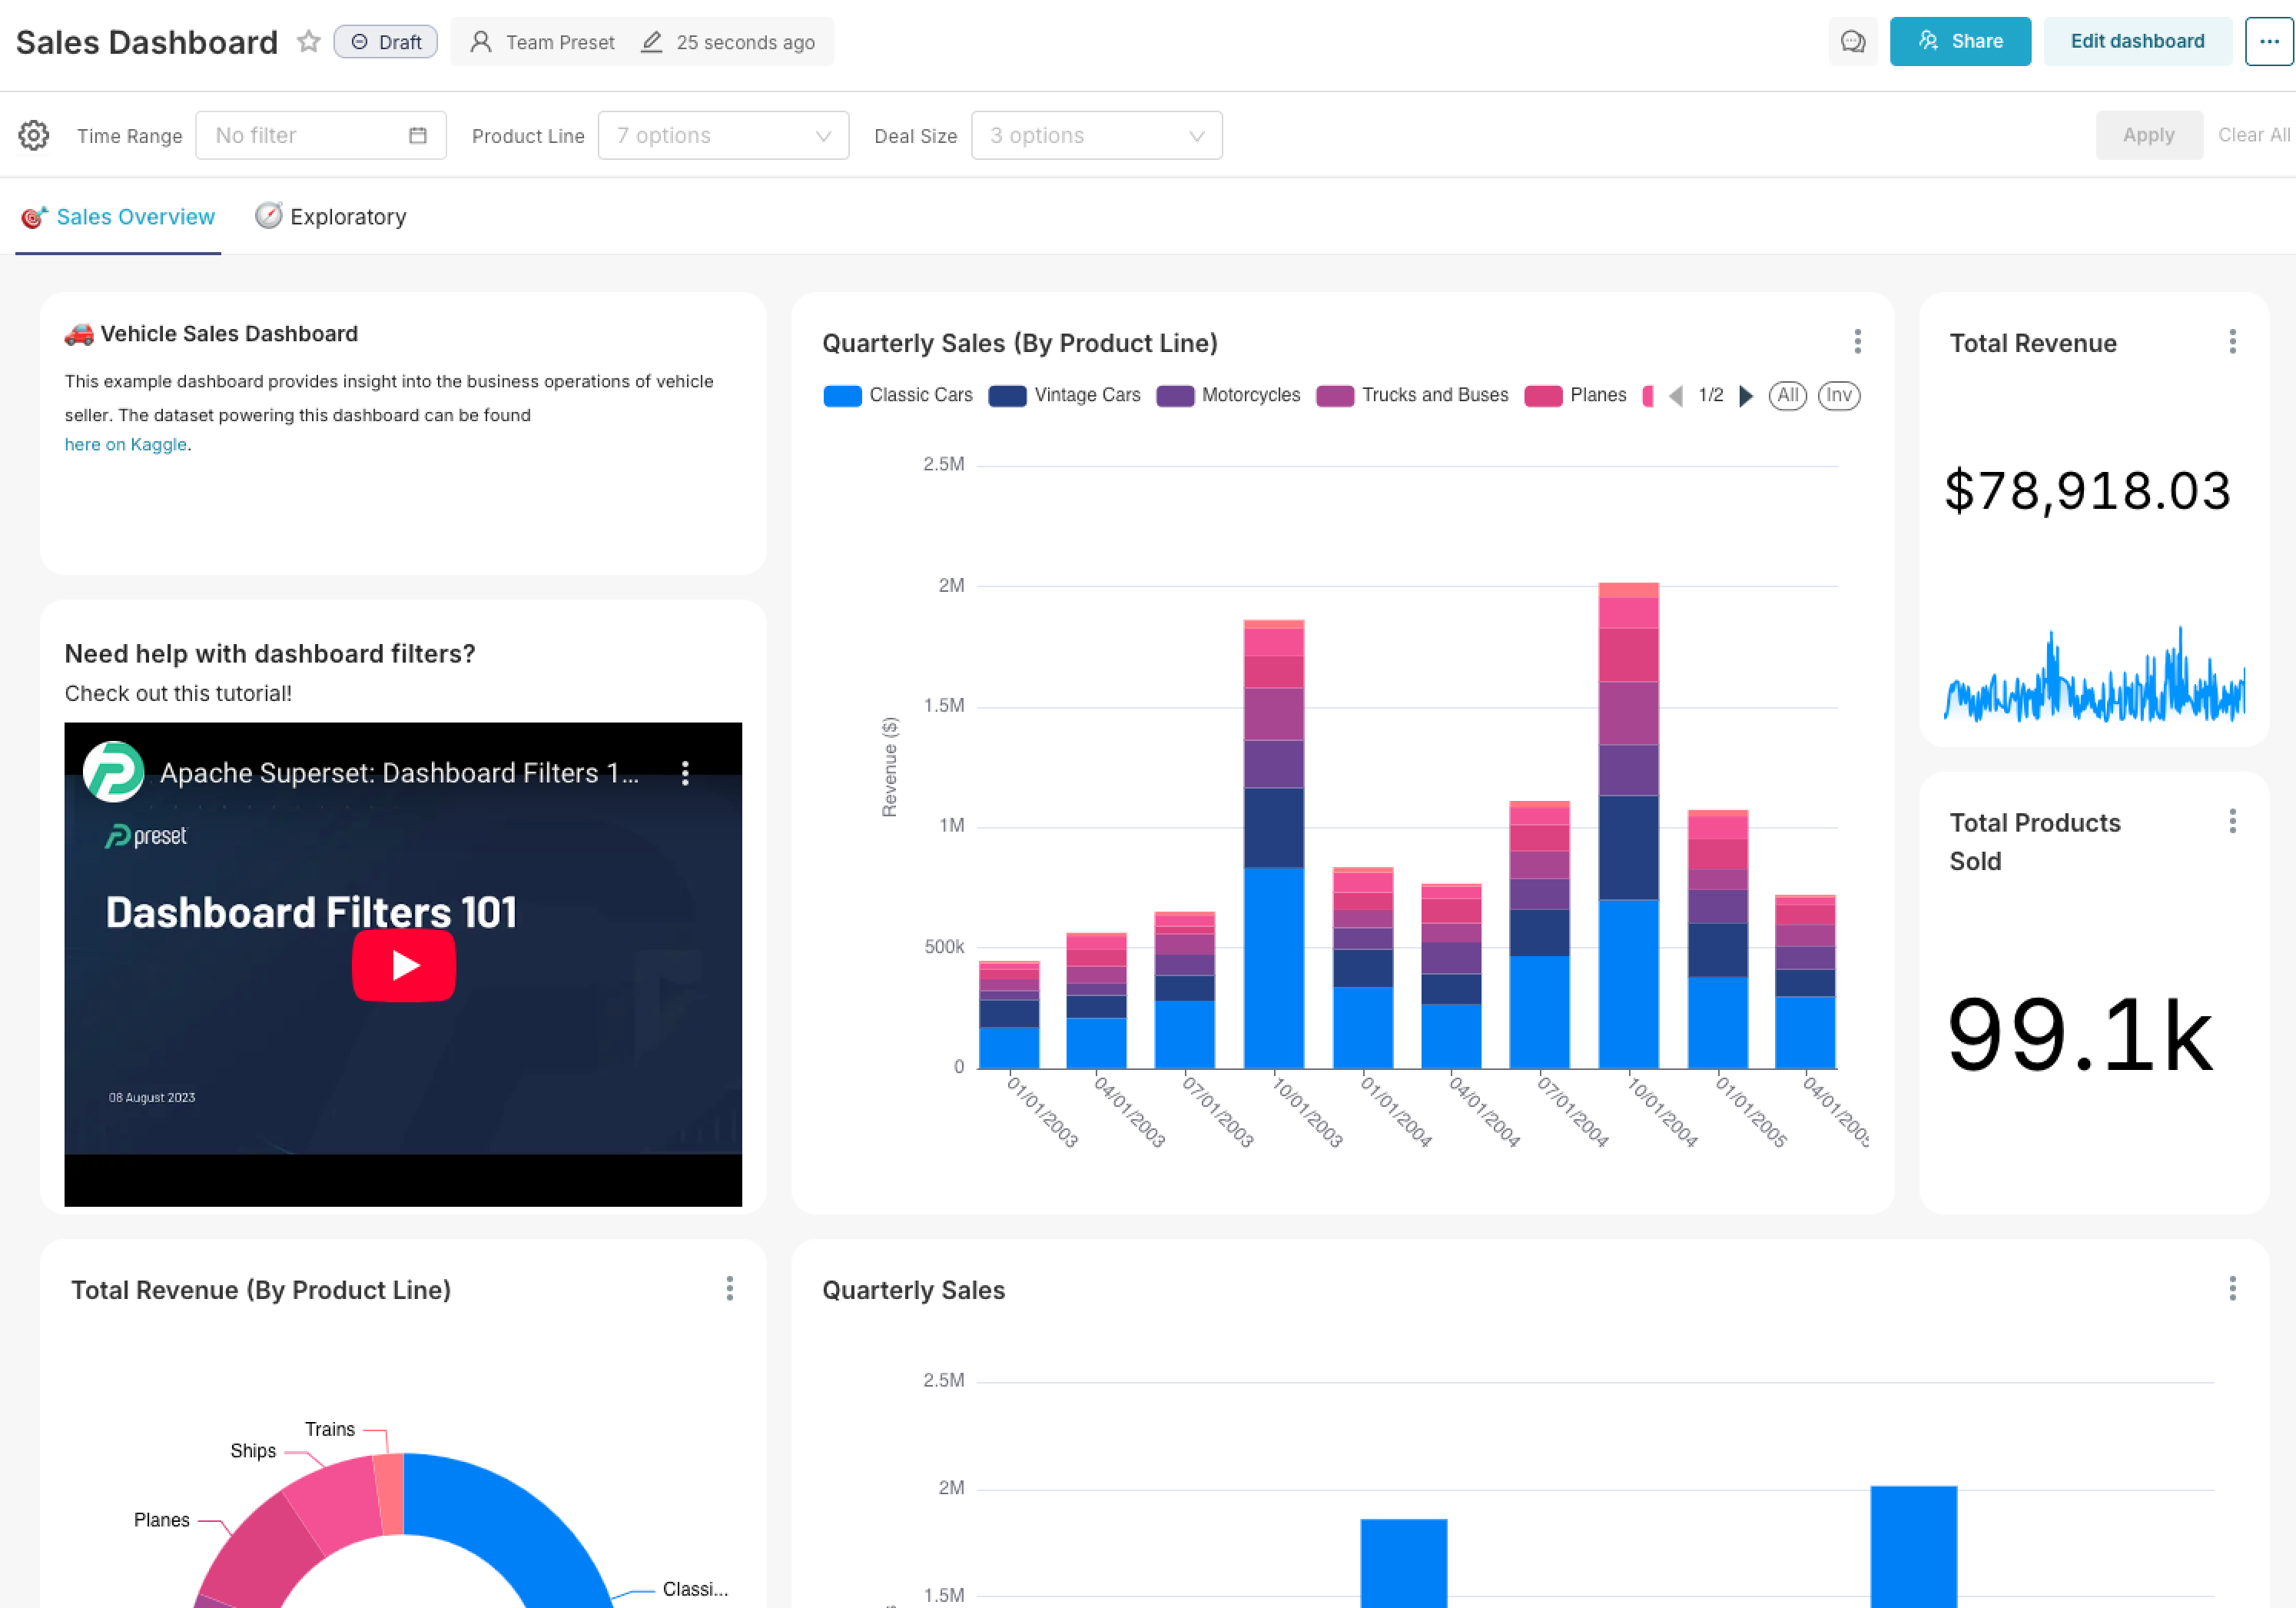
- (Charts) Matrixify, now available on all plan tiers, lets you expand any chart into a grid of charts broken down by the dimensions or metrics you choose as rows and columns.
- (Databases) Added support for MongoDB as a database engine.
- (Charts) Added "Export to pivoted .CSV" and "Export to pivoted Excel" options to the Interactive Pivot Table menu in both Explore and dashboards.
- (Chatbot) Added thumbs up/down ratings on chatbot responses, with an optional feedback form for thumbs down ratings.
- (MCP) Added an update_dataset_metric tool for editing saved dataset metrics.
- (MCP) Added a get_dashboard_datasets tool that lists the datasets powering a dashboard.
- (MCP) Added support for confidential OAuth clients, enabling Gemini Enterprise to connect to the Preset MCP server.
Fixes & Enhancements
- (Dashboards) Prevented native filter configurations from being lost when saving chart customizations.
- (Dashboards) Resolved dashboards opening to the wrong tab on first load.
- (Dashboards) Prevented the filter dropdown button from disappearing while the dashboard layout recalculates.
- (Dashboards) Dependent filters now wait for a "Default to first item" parent filter to make its selection before fetching values.
- (Dashboards) Persisted default values that were typed or pasted into select filters.
- (Dashboards) Corrected a deleted display setting reappearing after applying filters.
- (Charts) Restored time comparison rendering when no time grain is selected.
- (Charts) Restored rendering of charts with a temporal x-axis that were failing to draw their axis labels.
- (Charts) Preserved the time filter when an axis uses a custom SQL expression.
- (Charts) Prevented a crash in time comparisons when offsets share a numeric prefix.
- (Charts) Corrected Bubble charts showing every series as empty when the dimension or series uses a Custom SQL column.
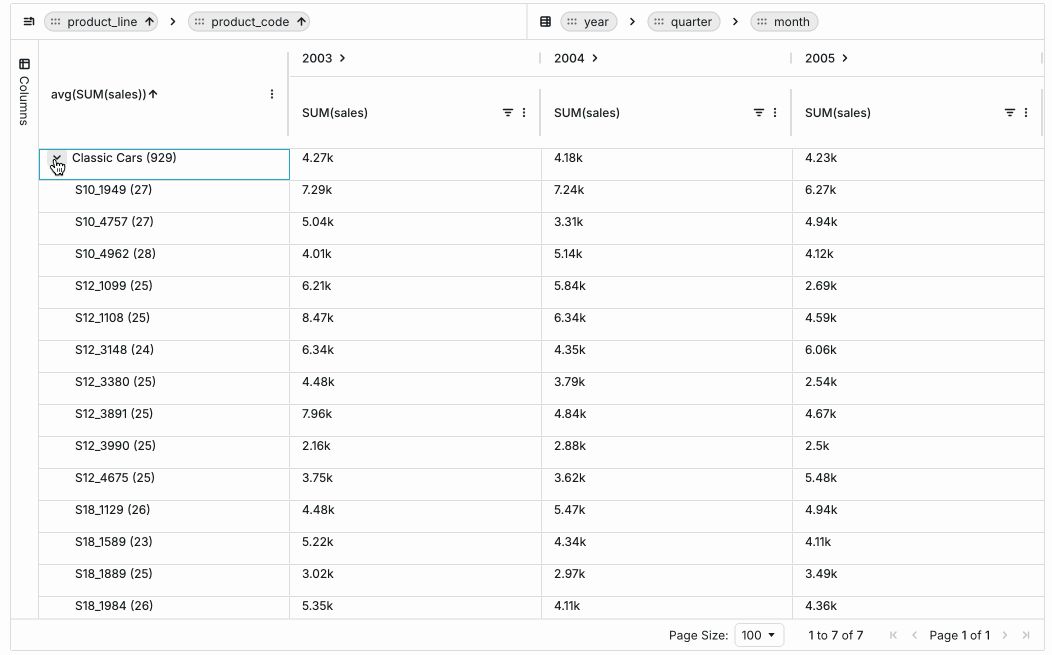
- (Charts) Group and subtotal rows in the Interactive Pivot Table now use each metric's own aggregation (for example AVG) instead of always summing.
- (Charts) Corrected percent metric totals in the Interactive Table summary row.
- (Charts) Kept conditional formatting aligned with its rows after sorting in the Interactive Table.
- (Charts) Time range filters in the Interactive Table now honor the dataset's hour offset.
- (Charts) Clicking a cell in the Interactive Table now selects the cell instead of its text.
- (Charts) Persisted the "None" aggregation selection in the Interactive Table.
- (Charts) Preserved sort order and series limit settings in Mixed Charts.
- (Charts) Resolved an issue in Explore where the cursor would jump to the results panel's search box while editing chart settings.
- (Charts) The save dialog now correctly defaults to "Save as new chart" for charts that have not been saved yet.
- (Charts) Clarified the "Sort by metric" setting description for stacked charts.
- (Datasets) Duplicating a BigQuery dataset now copies its catalog field.
- (SQL Lab) Deleting a query from history now updates the list without a page refresh.
- (SQL Lab) Preserved saved query descriptions when editing a query.
- (SQL Lab) Resolved the Query History pane appearing empty after running a query in a newly created tab.
- (SQL Lab) Restored navigation when clicking a saved query card on the home page.
- (Databases) Resolved the "Import database from file" modal getting stuck after an invalid file was uploaded, so a corrected file can be selected without reopening the modal.
- (Databases) After completing a database OAuth flow, unsaved charts in Explore now re-run automatically and schema lists in SQL Lab and the dataset editor reload without a refresh.
- (Databases) Corrected broken documentation links in database connection settings.
- (Databases) Resolved ClickHouse charts using ad-hoc SQL expressions failing with a column-not-found error on deployments that prepend SQL comments to queries.
- (Usability) Kept pagination working after sorting by a column in table views, such as a chart's "View as table" pane.
- (Tags) The favorite star now toggles correctly in the Tags list view.
- (Tags) Added a favorites filter to the Tags list view.
- (Alerts & Reports) Removed a doubled border on number inputs in the report modal.
- (Alerts & Reports) Disabled chart animations in report screenshots so time comparison lines render fully.
- (Alerts & Reports) Fixed the Slack recipient picker freezing on workspaces with very large numbers of channels, and restored search within the picker.
- (Embedded) The embedded dashboard allowlist now accepts URLs with a /dashboard/ path prefix.
- (MCP) MCP tools now accept common field name aliases in requests, preventing validation errors from AI clients.
- (MCP) Raised the item cap on dashboard info lists from 30 to 100 and made it configurable.
- (MCP) Resolved new MCP clients being redirected to login before they could complete OAuth discovery.
- (MCP) Empty requests from Gemini clients are now handled correctly instead of failing validation.
- (MCP) Resolved MCP tool calls authenticated with API tokens being denied due to a token scope mismatch.
- (MCP) Big Number charts created through MCP now respond to dashboard time filters.
- (MCP) Added a security layer that screens MCP tool outputs for prompt injection before they reach the chatbot model.
- (Chatbot) Added support for routing chatbot traffic directly to the model provider for workspaces with stricter compliance requirements.
Jul 8, 2026 (v6.0.0.19)
New Features
- (Platform) Preset Managed Private Cloud is now available on Microsoft Azure, alongside AWS and GCP. Your data stays in your own Azure virtual network while Preset manages operations. Learn more
- (MCP) Added an update_dashboard tool for AI clients. It can set:
- A dashboard's layout, theme, color scheme, and CSS
- Filter details, such as cross-filters and filter bar orientation
- Refresh frequency
- Tags
Fixes & Enhancements
- (Dashboards) Pre-filtered value lists configured for Time Grain controls now apply to chart display controls, not just native filters.
- (Dashboards) Opening a deleted dashboard now shows a clear "This dashboard does not exist" message with a link to all dashboards, instead of a full-page error screen.
- (Dashboards) Dashboards opened from older shared links or bookmarks now show their active filter values in the filter panel.
- (Dashboards) Opening a draft dashboard you do not own no longer surfaces a misleading "issue fetching favorite status" error toast.
- (Dashboards) Chart-level comment threads now show the chart name and context link to every viewer, not only the comment's author.
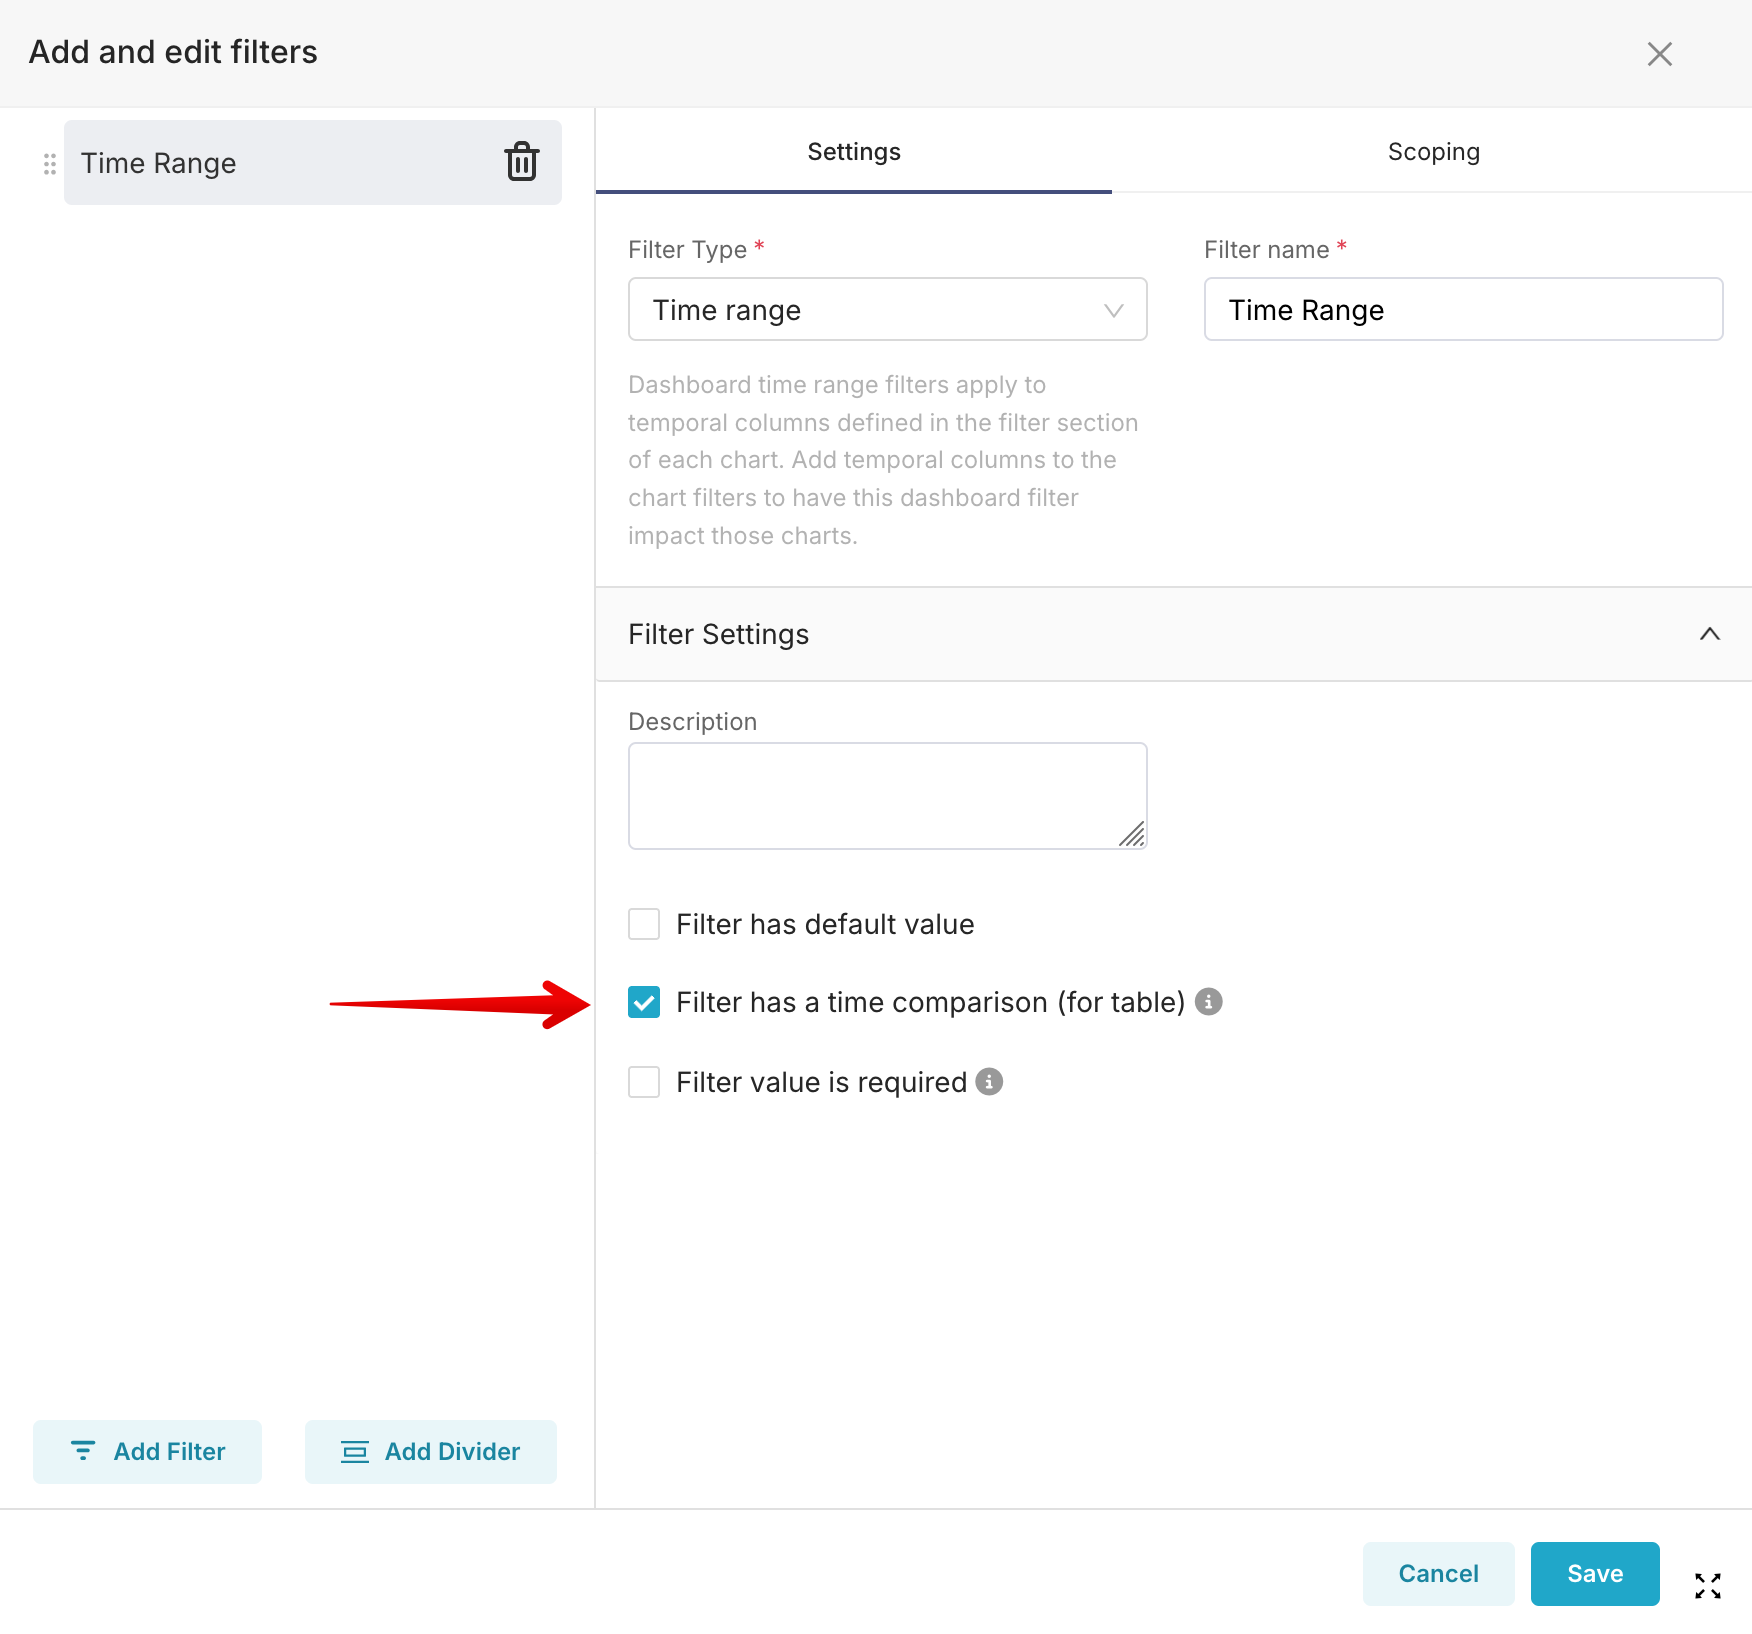
- (Charts) Added a "Show full range for time shift" option under Advanced Analytics. When enabled, each time-comparison series keeps its full length instead of being truncated to where the current period ends.
- (Charts) Editing one custom metric no longer overwrites other metrics on the same chart that share an internal name after duplication.
- (Charts) Table charts now accept a custom, free-text date format for temporal columns.
- (Charts) Newly added dimensions in Interactive Table charts now appear before metric columns rather than after them.
- (Charts) Forecast charts no longer fail with an error when the selected range has too few data points to model, and now show a clear "requires at least 2 data points" message instead.
- (Charts) Big Number with Time Comparison now respects a time-comparison override set by a dashboard filter.
- (Charts) The chart Save modal now pre-fills the Dashboard field when the chart already belongs to one or more dashboards.
- (Charts) The Interactive Table summary row now shows the correct percentage for percentage metrics instead of 0.000%.
- (Charts) Interactive Tables with a temporal column but no metric no longer relabel rows with the selected time grain as if the data were grouped.
- (SQL Lab) Saving a query or dataset now requires a non-blank name; the Save button stays disabled until a real name is entered.
- (SQL Lab) The "Filter results" search box in the results panel filters the table again as you type.
- (SQL Lab) Long tab names now display correctly in the overflow ("...") tab dropdown instead of appearing blank.
- (SQL Lab) Autocomplete now quotes table names that contain spaces or punctuation.
- (SQL Lab) Dictionary and list cell values, such as ClickHouse JSON and Map columns, now open in the interactive JSON tree viewer.
- (SQL Lab) The "Overwrite editor" action in Query History works again.
- (Databases) BigQuery drill to detail now works on nested STRUCT columns whose names contain dots.
- (Databases) BigQuery now resolves unqualified table names using the configured default dataset.
- (Alerts & Reports) Dashboard report schedules that target a specific tab now load the correct tab reliably.
- (API) Rate-limited API responses now include standard X-RateLimit headers (limit, remaining, reset, and a warning flag when 20% or less of the quota remains), giving API clients advance notice before they hit a limit.
- (MCP) MCP tool calls no longer fail when a pooled database connection is dropped between requests, for example after an idle timeout.
- (MCP) The find_users tool now treats wildcard characters in a query as literal text, so it can no longer be used to enumerate the full user directory.
- (MCP) Tool discovery now returns the full tool catalog when search_tools is called without a query.
- (MCP) Big Number with Trendline configuration now accepts an aggregation method (last value, sum, mean, min, max, median, or raw).
- (Chatbot) The Chatbot no longer reports working SQL, dataset, and chart tools as disabled, and now completes multi-step data questions on its own.
- (Chatbot) The 90% token-usage warning and trial banner now appear in the conversation history drawer.
- (Chatbot) Conversation titles now generate reliably instead of occasionally remaining blank.
- (Chatbot) Long multi-step tasks now finish gracefully with a summary of what was created and a prompt to continue.
- (Chatbot) Added a copy button to code blocks in Chatbot responses.
Jun 24, 2026 (v6.0.0.18)
New Features
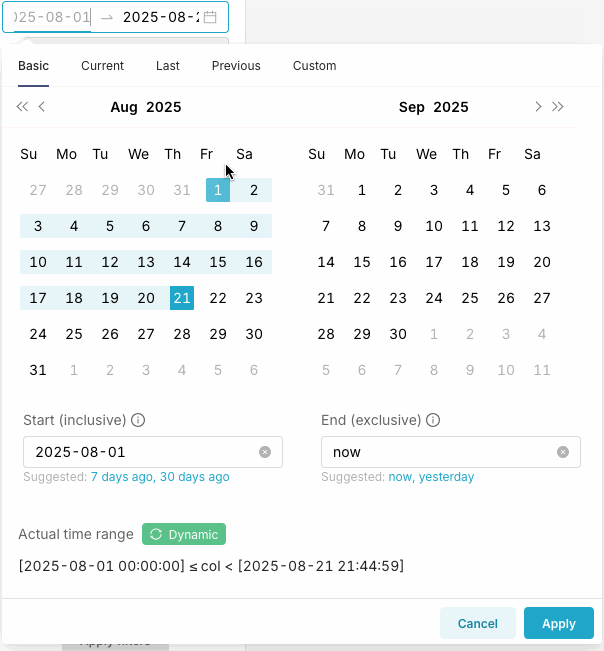
- (Dashboards) Dashboard links can now encode filter values in the URL, so recipients see a pre-filtered view when they open the link. Supported filter types include exact match, multi-value, range, and text-pattern matching. Filters with no matching native filter appear as removable chips in the filter bar.
- (Charts) Added a "Show Row Group Counts" toggle to AG Grid pivot tables. When turned off, the count shown next to each group label (for example, "United States (155)") is hidden.
- (MCP) Added per-workspace connection allowlisting for the MCP server, giving admins control over which AI clients are permitted to connect to Preset data. Contact your CSM to get access to this feature.
Fixes & Enhancements
- (Dashboards) Required filters now reliably apply default values and trigger on change.
- (Dashboards) Dashboard filters are now applied using live chart scope rather than a stale cached scope.
- (Dashboards) Dashboard filters are no longer duplicated when Jinja-applied filters are also active.
- (Dashboards) Chart scope is now restored correctly when importing a dashboard.
- (Dashboards) The browser tab title now updates when a dashboard is renamed.
- (Dashboards) Preset team admins can now open the Share Dashboard modal and invite collaborators, regardless of whether they own the dashboard or hold a Superset workspace admin role.
- (Charts) Charts on dashboards now correctly apply time grain filters set in the dashboard filter bar, rather than defaulting to the chart's own time grain setting.
- (Charts) Pie and other single-metric charts now use the correct metric field in Matrixify.
- (Charts) Time shifts (inherit or custom) are now cleared when switching to a visualization type that does not support them.
- (Charts) Datetime formatting is now applied to unaggregated temporal columns.
- (Charts) Handlebars chart code editors now follow the application theme.
- (Charts) Changing Matrixify dimensions now correctly requires a chart update.
- (SQL Lab) Corrupted query state no longer prevents users from accessing SQL Lab.
- (Databases) Resolved an SSH tunneling failure caused by an incompatible version of the paramiko library.
- (Alerts & Reports) Restored screenshot generation in server environments where headless Chromium previously failed to launch.
- (Embedded) Large CSV exports from embedded dashboards in guest sessions now complete successfully.
- (Embedded) The SDK theme configuration now correctly overrides the dashboard-level theme in embedded mode.
- (Import/Export) CSV uploads that fail due to incompatible column data types now surface a clear error message instead of failing without explanation.
- (Chatbot) The Chatbot usage report in Team Settings now shows all users with activity in the last 30 days, replacing a narrower window that caused recently active users to appear missing.
Jun 10, 2026 (v6.0.0.17)
New Features
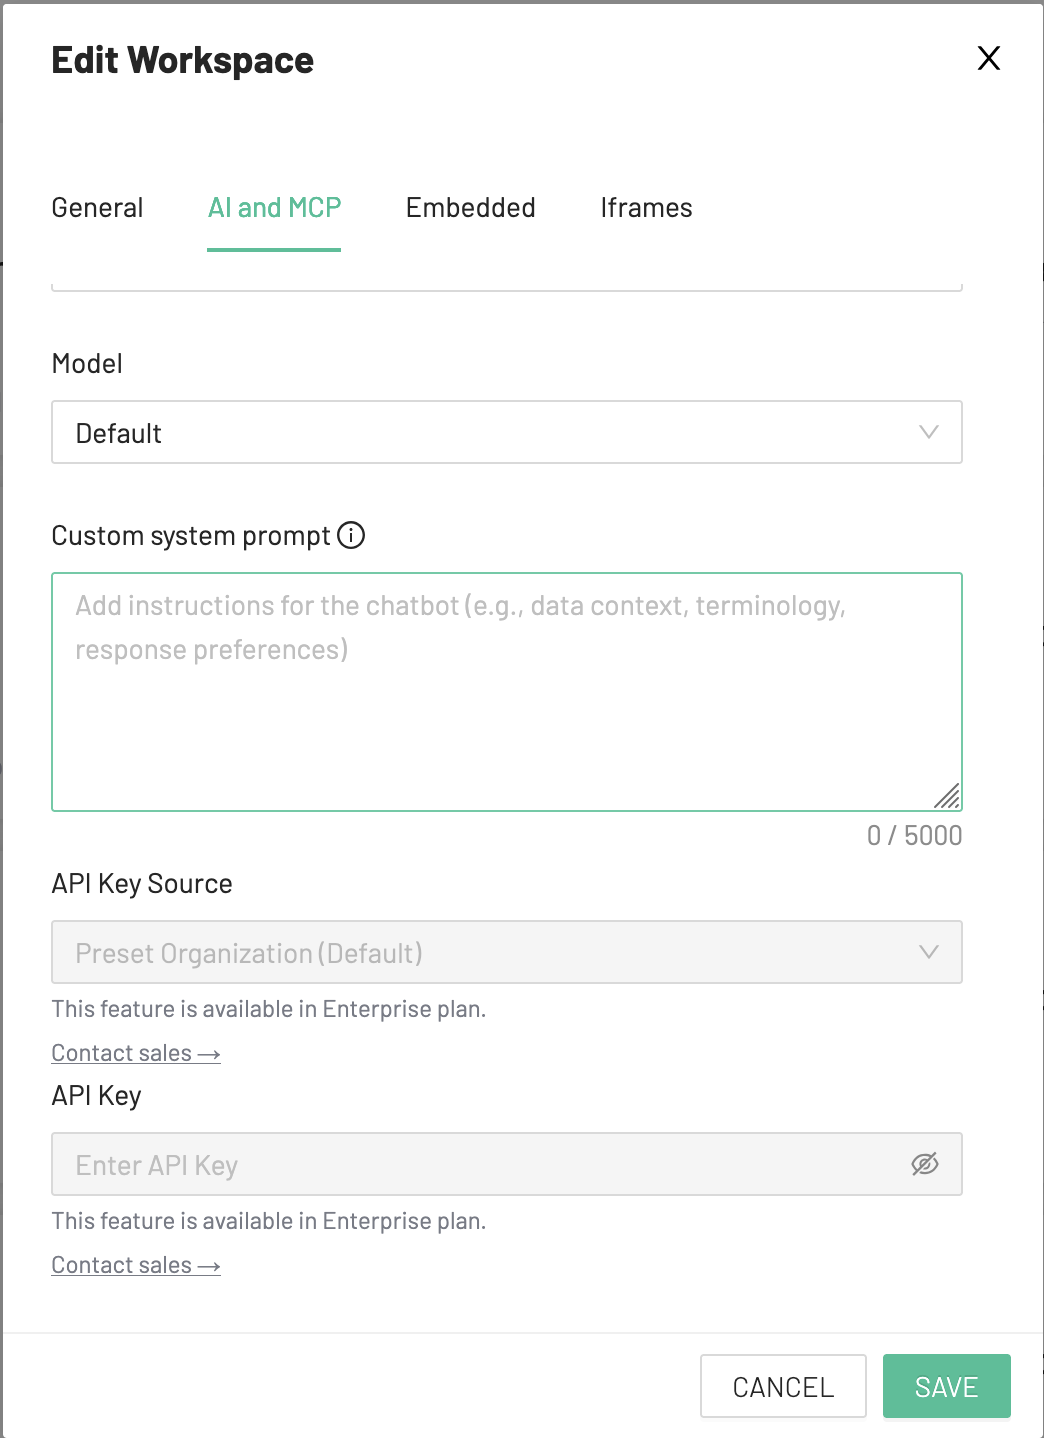
- (Chatbot) Workspace admins can now add a Custom system prompt in the Chatbot tab of workspace settings, which is appended to the Chatbot's default instructions. Use this to tailor responses to your team's preferred datasets, style guidelines, terminology or other preferences.
Trial users, Professional teams, and Enterprise teams have a limited amount of tokens available to try the Preset Chatbot. If you're interested in the full functionality with increased limits and customizable system prompts, contact us to upgrade.
Starter teams can reach out to our support team to enable a trial or contact us to upgrade
- (MCP) New tools and capabilities in this release:
- Dashboards:
get_dashboard_layoutfor inspecting a dashboard's component structure - Dashboards:
get_chart_infonow returns applied dashboard filters - Charts: Chart formatting options (colors, labels, axes) in
generate_chartandupdate_chart - Charts:
series_limitsupport for XY chart types ingenerate_chart - Charts: Custom SQL metric support in
generate_chartandupdate_chart - Content: Tools to list and retrieve reports, tags, saved queries, query history, annotation layers, annotations, CSS templates, and themes
- General: Ability to selectively disable specific tools via configuration - please reach out to your CSM if you're interested
- Dashboards:
Fixes & Enhancements
- (Dashboards) Fixed Filter and Display control dividers reverting to their default settings on the second save.
- (Dashboards) Resolved an issue where dynamic group by display values were not sorted alphabetically.
- (Dashboards) Fixed dynamic groupby display controls not applying to charts scoped to specific filters.
- (Dashboards) Fixed dashboard filters not applying to charts that were added to a dashboard via MCP or the API rather than placed through the visual editor.
- (Dashboards) Fixed Dynamic Group By silently dropping the chart's original dimension when a user selected a combination that included it alongside a new column.
- (Dashboards) Corrected the Undo button appearing enabled on a newly created dashboard before any edits were made, which caused a crash when clicked.
- (Dashboards) Fixed display controls using dataset ID instead of dataset UUID during export and import, which could cause remapping errors.
- (Dashboards) Restored correct charts-in-scope mapping when importing a dashboard.
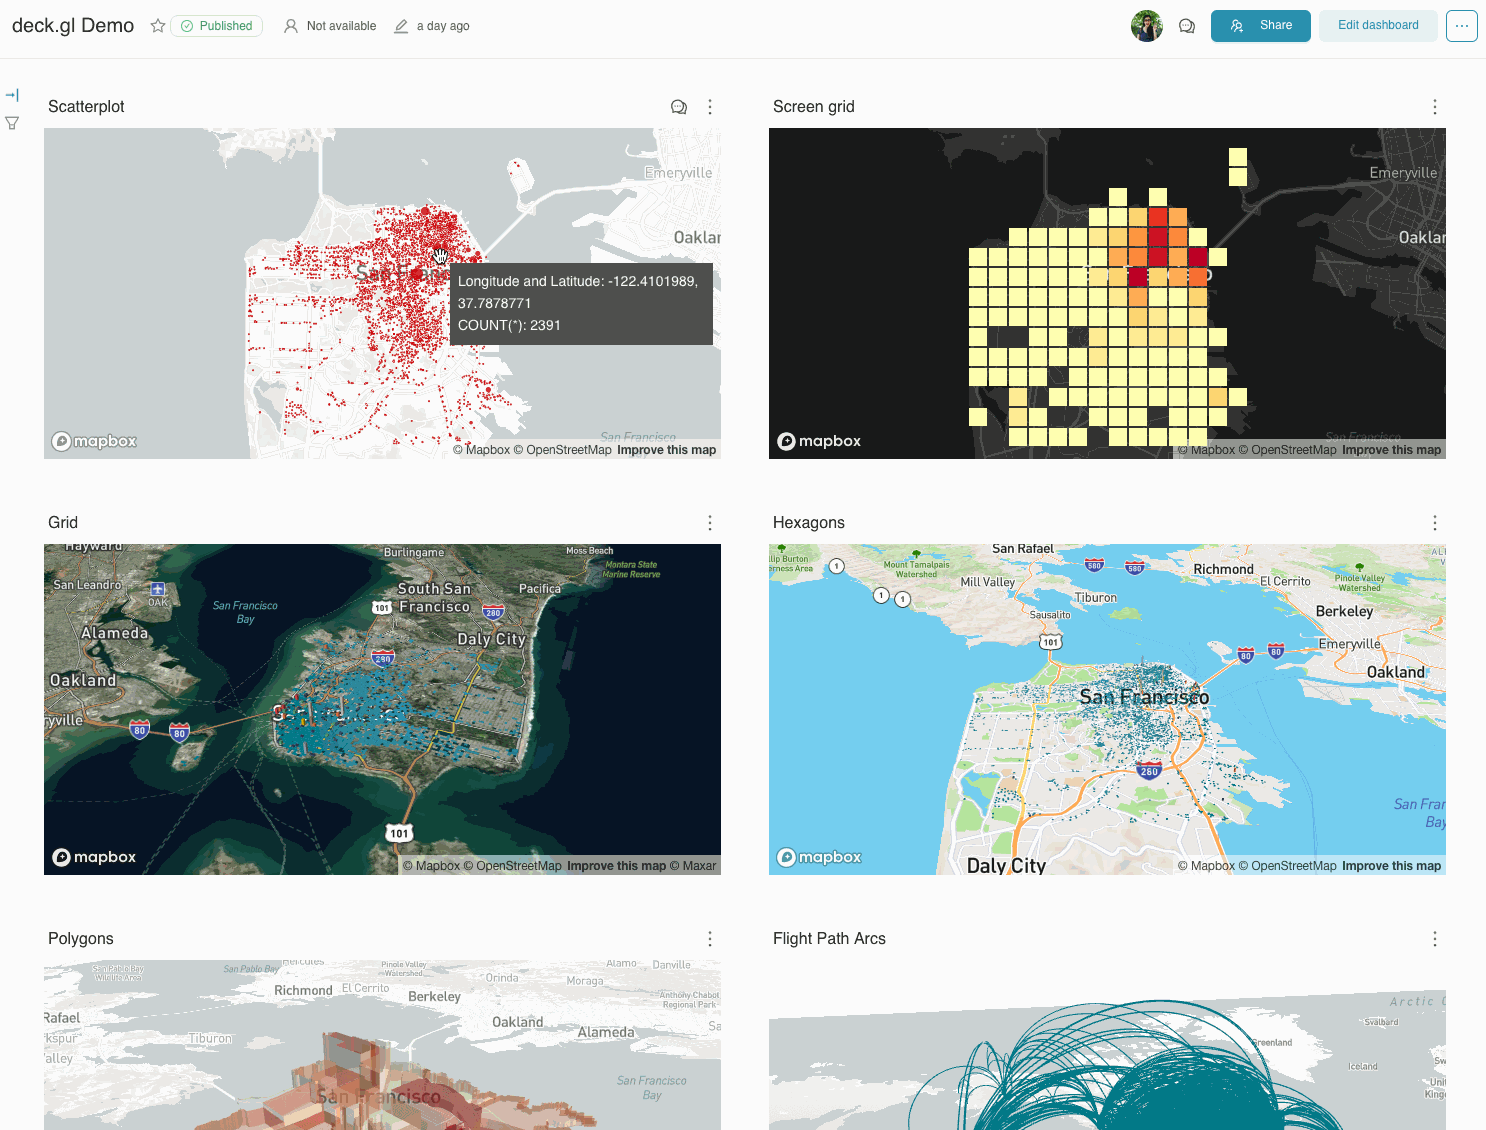
- (Charts) The deck.gl Path chart now supports metric-based color scales and line width per metric for multi-metric visual encoding.
- (Charts) Fixed cross-filter not clearing on a second click in the interactive table.
- (Charts) Corrected a white text border appearing on funnel chart segment labels.
- (Charts) Fixed non-filterable columns not appearing in the metric selector for table charts.
- (Charts) Resolved an issue where world map bubbles disappeared when a metric value was null.
- (Charts) Fixed heatmap incorrectly applying order-by for value-based axis sorts.
- (Charts) Fixed time comparison offset filter not shifting correctly when the x-axis uses ad hoc custom SQL.
- (Charts) Resolved the AG Grid table chart using raw SQL expressions instead of display labels when filtering and sorting HTML cells.
- (Datasets) Corrected the Datatype column header in the dataset creation table preview, which was sorting by column name instead of data type when clicked.
- (Datasets) Fixed dataset imports not validating the catalog field against the database's allow_multi_catalog setting.
- (SQL Lab) Improved the Source SQL vs. Executed SQL modal (accessible via the SQL preview link in query results) with responsive width, tabbed navigation between the two versions, and a copy button on each code block.
- (SQL Lab) Fixed table downloads using SQL expressions instead of column labels for sorted columns.
- (Usability) Fixed the user name disappearing from filter pills after navigating away and returning to a list view.
- (Usability) Removed a grayed-out, non-functional value field that appeared when selecting 'Is null', 'Is not null', 'Is true', or 'Is false' as a filter operator in Explore.
- (Usability) Fixed the chart list defaulting to sort by last saved time; now correctly sorts by last modified time.
- (Usability) Fixed the date filter apply button being cut off on small viewports.
- (Usability) Resolved an issue where searching in dropdowns with more than 100 options would show results merged with the initial 100 cached entries, pushing actual matches to the bottom of the list.
- (Alerts & Reports) Fixed tiled screenshots sometimes capturing partial ECharts renders by waiting for each tile's animation to complete before capture.
- (Alerts & Reports) Prevented report permalinks from being generated when the dashboard had no active filters or anchor state.
- (Embedded) Fixed guest token not being included in streaming export requests from embedded dashboards.
- (Admin) Resolved intermittent HTTP 429 errors on the role management page.
- (Admin) Fixed user and group search in the data access request modal returning only the first 100 results.
- (MCP) The MCP endpoint now displays a branded welcome page in the browser instead of a raw error response.
- (MCP) Prevented write tools from being visible to users who lack write permissions.
- (MCP) Fixed
update_chartnot clearing stale query context, causing custom filters and row limits to be ignored. - (MCP)
add_chart_to_existing_dashboardnow returns a clear error when the target tab is not found, rather than failing silently. - (MCP) Corrected list tool search filters not properly escaping inputs, which could return incorrect results.
- (MCP) Fixed OAuth redirects to use the correct redirect type for all client configurations including localhost.
- (MCP) Improved validation error messages and field aliases to reduce failed AI tool calls.
- (MCP) Fixed AI-generated SQL Lab tab titles not rendering correctly.
- (MCP)
execute_sqlnow blocks destructive DDL statements (DROP, TRUNCATE, ALTER) to prevent unintended data modifications. - (MCP) Resolved inaccurate chart type recommendations in
get_chart_dataresponses, which were previously based on column name string matching rather than actual data types and column cardinality. - (MCP) Resolved an Excel export failure caused by dataset metrics not being preloaded.
- (Chatbot) Added an in-app banner that appears when the workspace's custom OpenRouter API key runs out of credits.
- (Chatbot) Error messages are now specific and actionable rather than a generic "unexpected error."
- (Chatbot) Fixed the chatbot losing awareness of row-level security rules applied to the current user.
- (Chatbot) Fixed the Stop button silently failing when cancelled.
- (Chatbot) Resolved a misleading error shown when the LLM provider was unavailable; the chatbot now fails gracefully with a clear message.
- (Chatbot) Restored virtual dataset creation from within the chatbot.
- (Chatbot) Fixed the chatbot incorrectly refusing data requests before checking available datasets.
- (Chatbot) Corrected "last N full weeks" date calculations that were incorrectly including the current in-progress week.
- (Chatbot) Fixed error messages not persisting in the conversation history.
May 27, 2026 (v6.0.0.16)
New Features
- (MCP and Chatbot) Added the
create_virtual_datasettool to save SQL queries as reusable datasets. - (MCP and Chatbot) Added the
query_datasettool to query datasets using saved metrics, calculated columns, and dimensions. - (MCP and Chatbot) Added the
get_chart_sqltool to retrieve the underlying SQL and applied filters for any chart.
Fixes & Enhancements
- (Chatbot) Added a minimize button and "Start new chat" option to the chatbot header.
- (Chatbot) Fixed the typed input draft being lost when switching between the chatbot bubble and full-screen views.
- (Chatbot) Fixed the chatbot staying in full-screen when clicking an internal link, collapsing to the corner so the linked page is visible.
- (Chatbot) Fixed chart previews not rendering inline in the chatbot.
- (Chatbot) Fixed chart preview links being incorrectly blocked in chatbot responses.
- (Chatbot) Clarified terminology in chatbot responses to correctly distinguish between Table and Interactive Table chart types.
- (Chatbot) The step-by-step progress status now shows which MCP tool is currently being called even when collapsed.
- (MCP) Fixed MCP incorrectly creating a new dashboard instead of adding a chart to an existing one.
- (MCP) Fixed applied dashboard filters not being included when retrieving chart data.
- (MCP) Fixed crashes when a chart's dataset contains null values.
- (MCP) When a chart, dashboard, or dataset isn't found, MCP now suggests the right command to browse what's available.
- (MCP) Dashboards can now be found by title when the exact URL identifier doesn't match.
- (MCP) Column references are now validated before generating chart links or updating charts.
- (Dashboards) Clicking "Clear All Filters" now requires clicking Apply before charts update with the cleared filters.
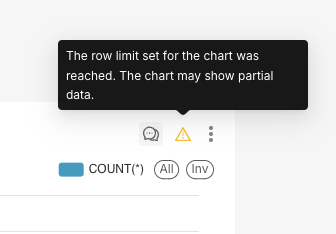
- (Dashboards) Fixed row limit warnings not appearing on non-table chart types in dashboards.
- (Dashboards) Restored the drag-and-drop target for the top-level dashboard tab when the tab already has content.
- (Charts) Fixed charts sometimes rendering as blank spaces on dashboards.
- (Charts) Fixed the zoom and scroll range resetting after a chart refreshes.
- (Charts) Fixed CSV exports failing for PostgreSQL-backed charts that use pre-execution query steps.
- (Charts) Fixed missing metric columns in mixed time-series charts when a Jinja template evaluates to null.
- (Charts) Fixed the conditional formatting column picker going blank in table charts when the active filters return no data.
- (Charts) Fixed unnecessary scrollbars appearing during chart rendering in the chart editor.
- (Charts) Fixed a phantom X-axis label appearing at the chart edge when no time grain is configured.
- (Charts) Consolidated visual column formatting options under a single Visual Formatting section in table charts.
- (Charts) Fixed bar charts with numeric X-axis values not rendering with a categorical axis.
- (Charts) Fixed the Save dialog pre-filling with the old chart name instead of the updated one when saving from a chart preview.
- (Charts) Fixed the pagination dropdown arrow disappearing on paginated table charts.
- (Datasets) Fixed column filter value dropdowns failing to populate when a dataset references a specific catalog and schema.
- (Datasets) Fixed row-level security rules being applied twice when converting a physical dataset to a virtual one.
- (Datasets) Fixed time comparison queries using the instance-wide row limit instead of the chart's configured limit.
- (Datasets) Fixed the SQL expression editor adding extra spaces and not expanding correctly in the dataset editor.
- (SQL Lab) Fixed large numbers in scientific notation causing errors in SQL query responses.
- (SQL Lab) Fixed template parameters not being preserved when overwriting a dataset from SQL Lab.
- (Databases) Fixed BigQuery connections failing to complete setup when created from the onboarding flow due to a missing Project ID field.
- (Databases) Resolved multiple reliability and error handling issues with OAuth2-connected databases, including Google Sheets.
- (Databases) Fixed Trino and Presto boolean column filters using incorrect comparison operators on computed columns.
- (Usability) Workspaces on the Preset home page are now sorted alphabetically by name.
- (Usability) The member search on the Members & Invites page now stays visible when a search returns no results.
- (Usability) Fixed the tag management modal clipping its dropdown and not reflecting recently added tags without a page refresh.
- (Alerts & Reports) Fixed report screenshots failing when a dashboard had no height set.
- (Alerts & Reports) Fixed report generation incorrectly timing out on charts outside the visible viewport.
- (Alerts & Reports) Fixed a crash when pasting text into the alert content search field.
- (Embedded) Fixed embedded dashboards blocking the fullscreen view on charts and the copy to clipboard option for permalinks, both of which now work by default.
- (Import/Export) Fixed the overwrite flag not being respected when importing assets via the API.
- (Import/Export) Fixed tags not being included when importing assets via the CLI.
May 14, 2026 (v6.0.0.15)
v6.0.0.15
New Features
- (Databases) Added MongoDB as a supported data source.
- (Charts) Added CSV and Excel export options directly from the drill-to-detail modal.
Fixes
- (Dashboards) Customized chart names from dashboards now save properly.
- (Dashboards) Fixed color assignments conflicting when a dashboard uses a locked shared dimension color palette.
- (Dashboards) Fixed dark mode scrollbars not inheriting the correct color scheme.
- (Dashboards) Fixed duplicate screenshot downloads being triggered on dashboards.
- (Charts) Fixed the Big Number chart using the wrong default font size for subtitle and subheader text.
- (Charts) Fixed axis title labels overlapping in ECharts visualizations.
- (Charts) Fixed the Handlebars chart not preserving its template when opening the chart editor.
- (Datasets) Fixed case-sensitive column filters failing when SQL is transpiled across dialects.
- (Datasets) Fixed calculated column expressions in WHERE clauses not being properly grouped.
- (Datasets) Fixed CSV downloads returning empty results for BigQuery datasets in the table chart.
- (Databases) Fixed ClickHouse performing expensive full-table scans in certain queries.
- (Databases) Fixed OpenSearch using incorrect identifier delimiters.
- (Usability) Fixed navigation history breaking when moving between chart editor views.
- (Alerts & Reports) Fixed standalone chart screenshots timing out due to a sizing issue.
May 4, 2026 (v6.0.0.14)
New Features
.gif)
- (Preset Chatbot) The Preset Chatbot is a built-in AI assistant embedded directly in your Preset workspace. It lets you explore data, generate charts, and run SQL queries using natural language. Learn more about the feature and how to enable it here.
- (MCP) The Preset MCP Server lets external AI assistants like Claude, ChatGPT, Gemini, and more interact directly with your Preset workspaces. You can use it to query datasets, explore dashboards, and create charts through natural language without leaving your AI tool of choice. Learn more about the MCP here.
- (Dashboard/Filters) Pre-filter Time Grains: Dashboard editors can now configure which Time Grain options are allowed in a Time Grain filter, with available options sourced from dataset-supported grains.
Enhancements and Fixes
- (Dashboard/Filters) Typed input in filter dropdowns now clears once an option is selected.
- (Dashboard/Filters) Dashboards with chained dependent filters (e.g., A → B → C → D) now apply the full ancestor chain on the first Apply, instead of requiring a second click.
- (Dashboard/Filters) Fixed the dashboard filter configuration modal so the full filter list can be scrolled when many filters exist.
- (Dashboard/Filters) Resolved the placeholder "Untitled" item that appeared when adding a new filter in filter controls.
- (Charts) Fixed a Interactive Table dashboard bug where changing a Dynamic Group By control would move the selected dimension column to the end of the table
- (Charts) Word Cloud secondary-sort behavior is now controlled by an independent sort_by_series option
- (Charts) Several UI fixes for the Deck.gl exclude-layers control: removed a duplicated label, corrected sizing in the vertical filter bar orientation, added a descriptive tooltip, and the selector is now properly disabled when a dashboard contains no multilayer Deck.gl charts.
- (Charts) Fixed an issue where using a calculated column as an aggregation, filter, or dimension would break the chart.
- (Charts) Fixed a 500 error returned by /api/v1/chart/{id}/data for charts using the {{ metric() }} Jinja macro
- (API) New
filter_dashboard_idparameter on/api/v1/chart/{id}/data— passing a dashboard ID applies all of that dashboard's in-scope filters to the chart data response, with access checks for both the dashboard and the chart's presence on it.
April 22, 2026 (v6.0.0.13)
New Features
-
(Alerts & Reports) Added support for selecting a dashboard tab and/or applying dashboard filters when creating Alerts & Reports. This feature is in roll out phase, please speak with your Customer Success Manager or contact support to request access.
.png)
-
(Charts) New Matrixify option gives the ability to transform a single chart into a grid of multiple charts, making it easy to compare across metrics or dimensions. See the Matrixify documentation for more information. This feature is in roll out phase, please speak with your Customer Success Manager or contact support to request access.
-
(Charts) Added currency controls to the Country Map chart type
Enhancements and Fixes
- (Dashboards) Added a
filter_dashboard_idAPI parameter to apply dashboard filters to chart data endpoints - (Dashboards) Fixed an issue where the filter dropdown width became too narrow when typing custom input in multi-select filters
- (Dashboards) Fixed opacity on filter dropdowns
- (Dashboards) Fixed screenshot downloads to always generate fresh images and PDFs
- (Dashboards) Fixed "Select all" button being cut off in filter dropdowns
- (Dashboards) Fixed group by columns not being recognized in dashboard filter customization config
- (Charts) Improved y-axis ticks and padding for compact timeseries charts. At small row heights, y-axis labels are now dynamically adjusted to reduce visual clutter
- (Charts) Added an X Axis Number Format control for numeric X-axis columns. When the X-axis is not a time column (e.g., year), the Customize tab now shows a Number Format option instead of Time Format
- (Charts) Added left-indentation to the control panel hierarchy in the Explore view for improved readability
- (Charts) Fixed stacked horizontal bar chart clipping and duplicate x-axis labels
- (Charts) Fixed a tooltip crash that could occur during dashboard auto-refreshSQL in the Table chart
- (Charts) Fixed undefined filter values displaying in chart change records
- (Charts) Fixed JPEG export of AG Grid tables
- (Charts) Fixed unnecessary scroll bars appearing on charts in the Explore view
- (Charts) Fixed boolean false being handled correctly in control rendering
- (Charts) Fixed error toast appearing when navigating away from the Chart Builder
- (Charts) Fixed scatterplot categorical color handling in deck.gl charts
- (Datasets) Fixed the Edit Dataset modal height to prevent footer cutoff
- (Datasets) Fixed the dataset editor modal layout and Settings tab horizontal scroll
- (SQL Lab) Fixed an access check in the SQL execution results command
- (SQL Lab) Fixed handling of columns without names
- (SQL Lab) Fixed cursor misalignment in the markdown editor
- (SQL Lab) Fixed Jinja template rendering order so Jinja expressions are processed before query parsing
- (SQL Lab) Fixed schema-aware Jinja rendering by passing the datasource table to the template processor
- (Databases) Fixed an issue with Interactive Table charts failing with Oracle databases
- (Databases) Fixed OpenSearch queries failing due to injected comments
- (Embedded) Fixed Drill to Detail for embedded dashboards
April 2, 2026 (v6.0.0.11)
Enhancements and Fixes
- (Dashboards) Non-admin users no longer encounter errors when loading dashboards with custom themes applied
- (Dashboards) Tab underlines now display at the correct width for newly added dashboard tabs
- (Alerts & Reports) Clearing all recipients from a report now saves correctly
- (Charts) Time Series charts no longer display duplicate labels on the x-axis
- (Charts) Column sorting in Time Series Table charts now works correctly
- (Charts) Column tooltips in the Chart Builder now correctly display the column's data type instead of the column name
- (Theming) New label and specific tokens are now available for more granular control over text label styles in custom themes
- (Theming) The theme editor now includes automatic JSON formatting, making it easier to write and review custom theme configurations.
- (Theming) Link color in custom themes now automatically follows the primary color when not explicitly set
- (Theming) The "Local" badge on themes now correctly persists when navigating between pages
- (Theming) Button styling is now applied consistently across the application in custom themes
- (SQL Lab) The font family setting now correctly applies to the SQL editor
- (Databases) Fixed a Firebolt SQL issue where
EXCLUDEclauses were being incorrectly rewritten asEXCEPT - (Databases) Fixed an issue with Snowflake OAuth2 token refresh failing in certain configurations
- (Databases) Fixed a DynamoDB query parsing error that occurred with certain partition key expressions
- (General) All navigation menu items now display correctly on smaller screens
March 16, 2026 (v6.0.0.9)
Enhancements and Fixes
- (Dashboards) Fixed an error that occurred when adding a custom SQL filter to a dashboard
- (Dashboards) The "Apply" button on the filter bar no longer incorrectly disables when required filters are auto-applied
- (Charts) Fixed CSV and Excel downloads for legacy chart types in both the Chart Builder and dashboards
- (Charts) Time-shifted series in time series charts now correctly match the color of their original series
- (Charts) Y-axis title margins now have sensible defaults to prevent labels from overlapping chart content
- (Charts) Deck.gl Polygon charts now render correctly when boundary columns contain nested geometry JSON
- (Charts) Calendar Heatmap tooltip text now displays with correct colors in both light and dark themes
- (Charts) World Map charts now show a fallback color when a color value cannot be determined for a region
- (Embedded) Fixed an issue where Row-Level Security rules were being applied twice for virtual datasets in embedded dashboards
- (Embedded) Embedded dashboards now default to the light theme instead of inheriting the viewer's system-level dark/light preference
- (Databases) Database connections with encrypted configuration fields (such as credentials) can now be properly included in import and export operations. Encrypted fields also now display clear labels in the connection settings UI.
March 12, 2026 (v6.0.0.8)
New Features
- (Databases) Connect to Google Sheets using OAuth2 for a more secure, token-based authentication flow — no username or password required.
Enhancements and Fixes
- (Dashboards) "Clear All" on the filter bar now correctly respects required filter validation rules
- (Dashboards) Fixed multiple drag-and-drop and edit mode issues in the dashboard editor
- (Dashboards) New dashboard tabs now appear correctly in filter scoping settings
- (Charts) Heatmap tooltips now show axis values instead of index numbers
- (Charts) Fixed display issues in the World Map chart
- (Charts) Number labels in ECharts now use adaptive formatting based on the displayed values
- (Charts) Interactive Tables now correctly show totals for saved metrics in the summary row
Mar 4, 2026 (v6.0.0.7)
New Features
-
(Dashboards) Added refresh button, status indicator, and pause button in the dashboard header when an auto refresh interval is set.
-
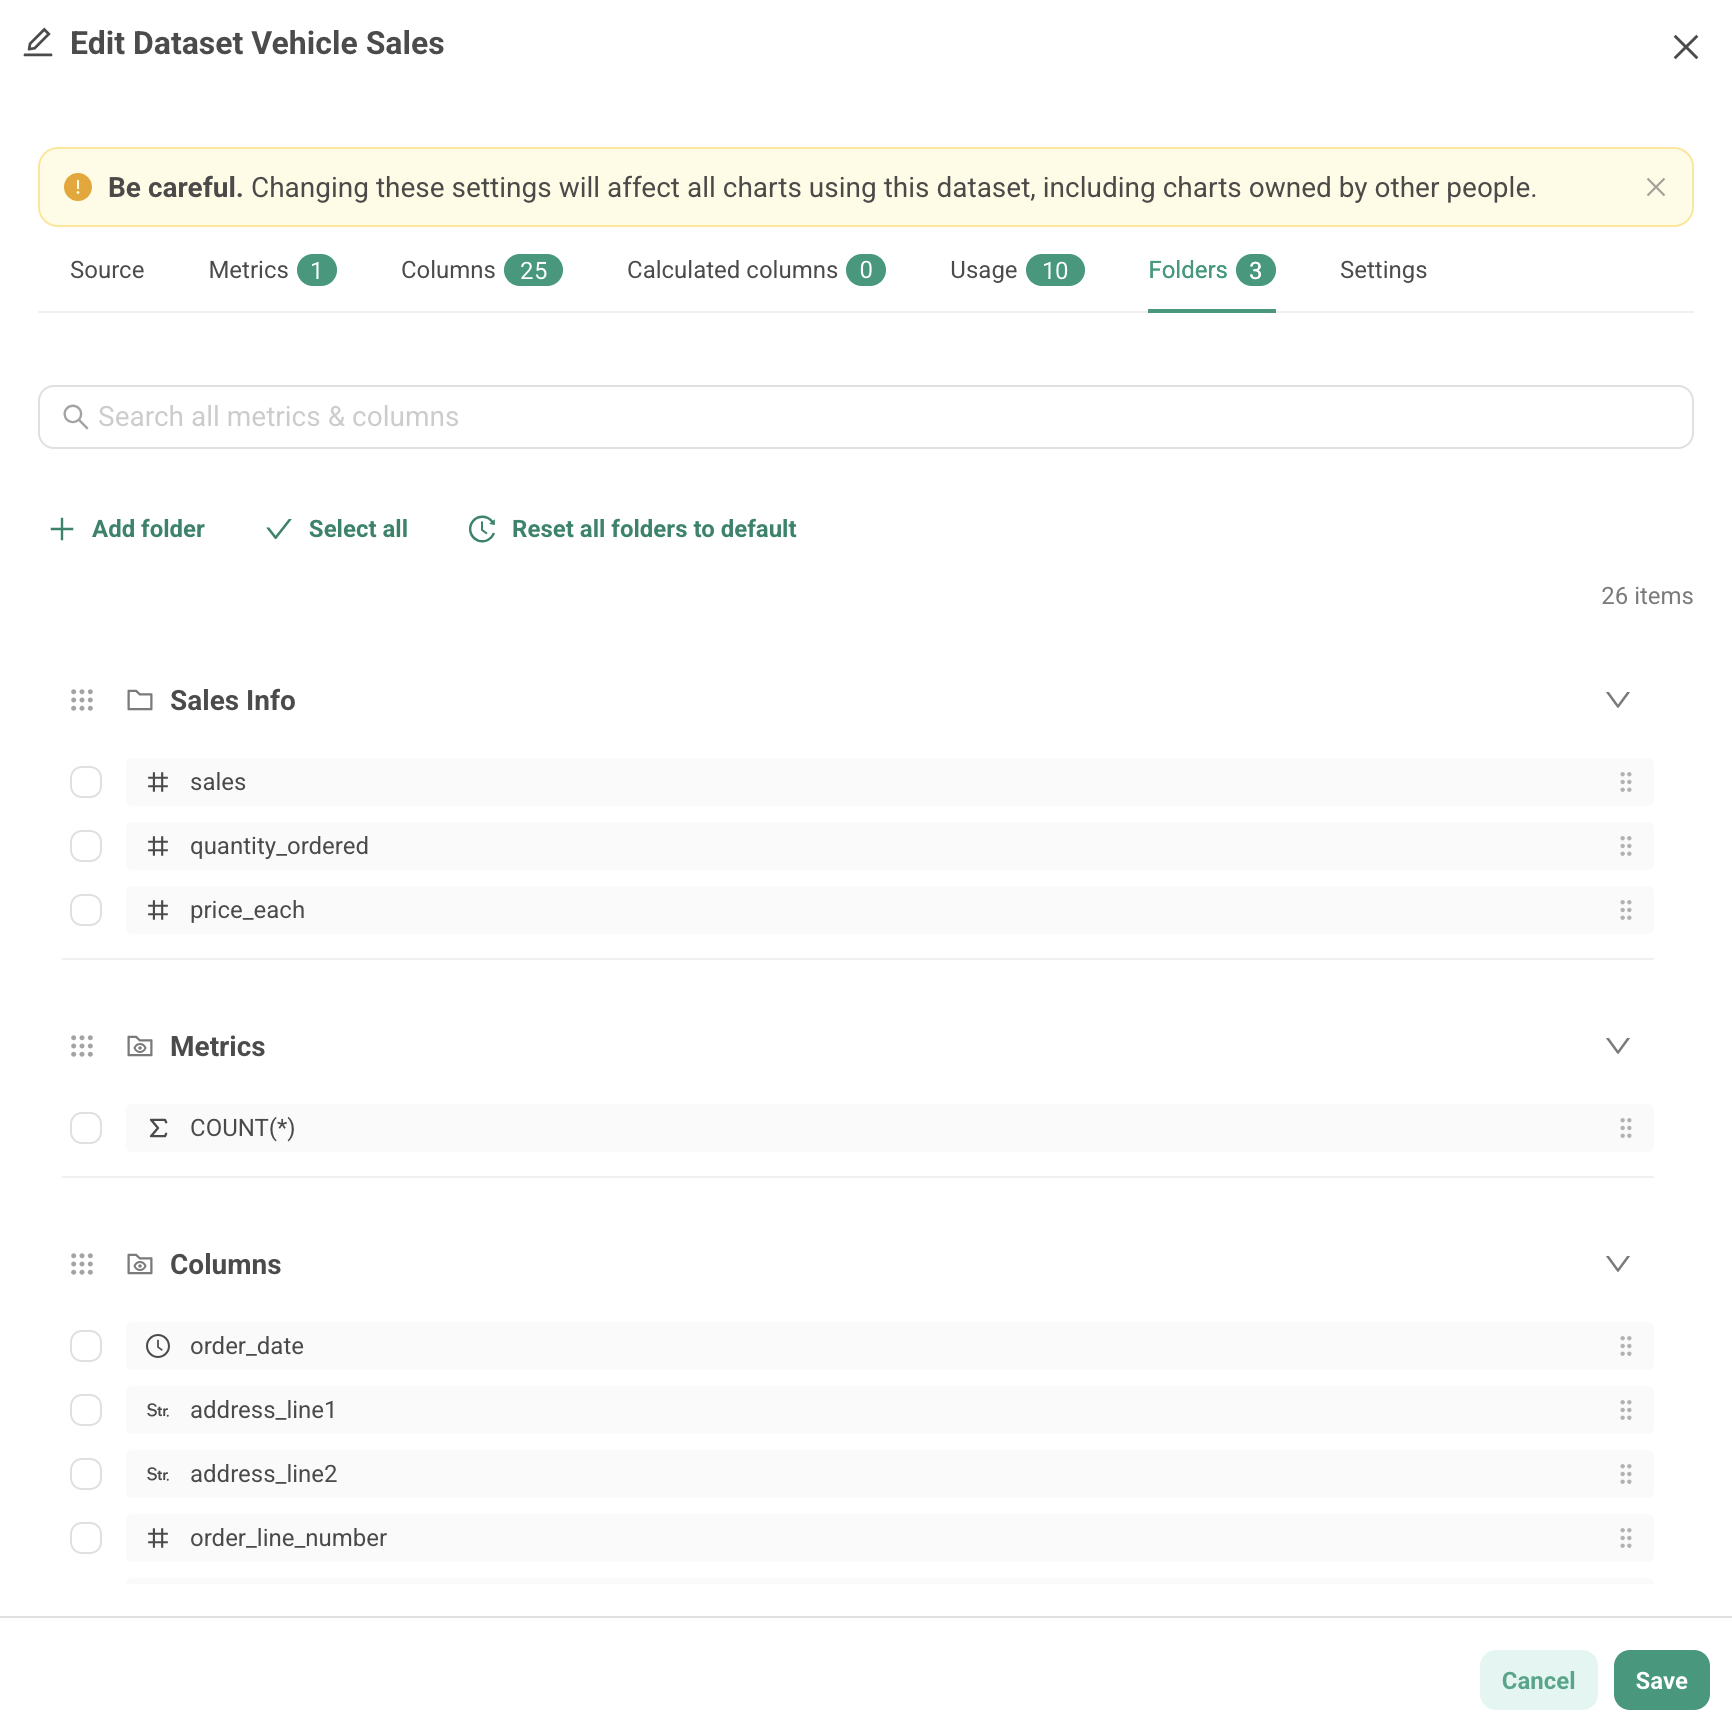
(Datasets) New dataset folders editor for organizing columns and metrics into folders. Folders will appear in the left panel of the Chart Builder.
Enhancements and Fixes
- (Embedded) Added feature flag to disable the logout button in embedded contexts
- (Dashboards) Fixed warning toasts when dropping folder items outside of drag-and-drop context
- (Charts) Fixed chart error banners to be non-dismissible
- (Charts) Fixed x-axis date labels disappearing when rotated
- (Charts) Fixed missing opacity and point radius in Mapbox charts
- (Theming) Fixed
colorlinktoken usage for link-style buttons - (General) Allowed non-owners to favorite/unfavorite charts
- (OAuth2) Added PKCE support for database OAuth2 authentication (BigQuery, Snowflake, Databricks)
Feb 25, 2026 (v6.0.0.6)
Enhancements and Fixes
- (Dashboards) Fixed unreachable drop zones within tabs in the dashboard editor
- (Dashboards) Fixed vertical lines appearing in the middle of treemap categories
- (Dashboards) Fixed native filters not being restored correctly from URL when "select first value" is enabled
- (Dashboards) Fixed filter scope in nested tabs to correctly prioritize charts in scope
- (Dashboards) Fixed world map not showing filter icon after page refresh
- (Dashboards) Fixed bulk action buttons being cut off in filter selects
- (Charts) Fixed formula annotations not rendering when dataset-level column labels are used
- (Charts) Fixed combined annotation labels for events at the same timestamp in time-series charts
- (Charts) Fixed ad-hoc metric for point size in scatter charts
- (Charts) Improved error display for failed charts in dashboards
- (Charts) Fixed time grain aggregation preservation when temporal column casing changes
- (Charts) Fixed increase/decrease color options to only show when time comparison is enabled
- (Charts) Restored ECharts tooltip after closing drill menu in time-series charts
- (Charts) Fixed native filter refresh icon alignment with default value field
- (Charts) Fixed force refresh to use async mode when GAQ is enabled
- (Charts) Fixed native filters not updating temporal range filter subject when time column filter is applied
- (Charts) Fixed table rows overlapping pagination in table view
- (Charts) Fixed unsaved changes modal incorrectly appearing on new charts
- (SQL) Fixed SQL auto complete suggestions
Feb 5, 2026 (v6.0.0.4)
New Features
- (Theming) New Themes page adds support for dark mode as well as customized themes. Themes can be applied to workspaces or dashboards and include customizations such as fonts, colors, custom spinners, and more! Read more about themes at our theming docs page
- (Dashboards) New dashboard display controls feature: dynamic group-by in dashboards allows changing chart dimensions from the dashboard filter panel. Read more on our Dashboard Display Controls page
.png)
- (Charts) Time-Series Table chart with Sparklines now support Area and Bar chart types in addition to Lines
.png)
- (Charts) New Gantt Chart visualization for displaying project timelines, task durations, and event sequences on a horizontal time axis
.png)
- (Charts) Added custom tooltip support for Deck.gl charts using Handlebars, allowing rich HTML content in tooltips. Read more about how to set this up on our deck.gl page
.png)
- (Charts) Additional color configuration support for deck.gl charts including color breakpoints. Read more about how to set this up on our deck.gl page
.png)
- (Datasets) Added Usage tab to datasets showing which charts and dashboards use the dataset
.png)
- (Datasets) Datasets now support defining a Currency code column in the Columns tab. The selected column will be used when building charts with the 'Auto-detect' currency formatting setting enabled
- (Databases) Added per-user caching option in the Database Security tab for fine-grained cache control
- (Embedded) Drill by and Drill to detail are now available in embedded dashboards.
Enhancements
Dashboard
- (Dashboards) Dashboard filters can now target individual layers in Deck.gl multilayer charts instead of applying to all layers. Use the Scoping tab to select the layers that filters should apply to
- (Dashboards) Numerical range filters now support optional text input fields alongside the slider for entering exact values.
- (Dashboards) Numerical range filters now include text input fields for entering exact minimum and maximum values.
- (Dashboards) Dashboard screenshots now use the dashboard name as the download filename.
- (Dashboards) Horizontal filter bar layout is now enabled by default.
- (Dashboards) Added a search box to drill by menus from Interactive Table and Interactive
Table chart types
Charts
- (Charts) Added SQL expression validation in Chart Builder to validate or show syntax errors in custom SQL
- (Charts) Added support for saving Interactive Table modifications such as column reodering, filters, and sorting to permalinks.
- (Charts) The chart type selector modal now auto-focuses on the search input when opened.
- (Charts) Added sort legend option to the Legend section for Bubble, Funnel, Gantt, Graph, Mixed Timeseries, Radar, and Time series charts
- (Charts) Extended conditional formatting in Table charts to support applying formatting to the entire row or to text colors
- (Charts) Support for conditional formatting of strings in Table charts
- (Charts) Series limit in Time Series charts can now group the long tail of series into an 'Others' category
- (Charts) Mixed Time Series charts now have a 'Show query identifiers' option to show or hide the '(Query A)' and '(Query B)' labels in tooltips
- (Charts) Mixed Time Series charts now support only showing total value labels option and configuring series sorting.
- (Charts) Time Series and Mixed Time Series charts now enforce the selected time grain on time-shifted series
- (Charts) Added sort legend option to Pie charts, allowing users to control the order of legend items based on the data or labels
- (Charts) Pie charts now support a threshold setting to automatically group small slices into an "Other" category
- (Charts) Waterfall charts now support customizing colors for series increase, decrease, and totals as well as tooltip label customization
- (Charts) Waterfall charts can now display a total bar summarizing all values.
- (Charts) Heatmaps now support configurable cell borders with color, opacity, and width controls.
- (Charts) Box Plot charts now include additional percentile options (10th/90th and 5th/95th).
- (Charts) Box Plot charts now support data zoom
- (Charts) Added Ivory Coast (Côte d'Ivoire) to the available country map visualizations.
- (Charts) Added Republic of Serbia to the available country map visualizations.
- (Charts) Handlebars charts can now parse nested JSON data
- (Charts) Deck.gl charts now support color breakpoints for precise color mapping based on metric values.
- (Charts) Deck.gl now visually highlight selected elements when using cross-filters
Datasets
- (Datasets) Added option in Dataset creation modal to Create dataset only without creating a chart
- (Datasets) Metrics can now be created and added to a dataset folder in a single API request
SQL Lab
- (SQL Lab) Improved support for exporting large query results to CSV from SQL Lab. For exports larger than 100k rows, a modal will appear to show export progress.
- (SQL Lab) New handle icon to collapse the SQL Lab left side panel
Databases
- (Databases) New icon for materialized views in BigQuery
- (Databases) Support for Clickhouse to use defined schema for unqualified table names in queries
- (Databases) Improved catalog support for Apache Doris database connections.
- (Databases) Added support for Dremio's
REGEXP_SPLITfunction - (Databases) DuckDB and MotherDuck connections now support catalog browsing.
- (Databases) Removed Rockset database support (service was discontinued).
- (Databases) Snowflake connections now accept private key authentication without requiring a passphrase.
Usability
- (Usability) Improved keyboard accessibility for dropdown menus.
- (Usability) Color pickers throughout the application now use Ant Design's native component for better theme support.
- (Usability) Rearranged the action buttons at the top right of most list view pages. From left to right: import, bulk select, create new
- (Usability) Added confirmation dialog when navigating away from Dashboard or Chart Builder with unsaved changes.
- (Usability) Updated interfaces for Dashboard Properties and Chart Properties
Embedded
- (Embedded) Added
referrerPolicyconfiguration option for embedded dashboard iframe requests.
API
- (API) Dataset, chart, and dashboard APIs now support UUID-based lookups in addition to numeric IDs.
- (API) Dataset API now supports UUID lookups in addition to numeric IDs.
Import/Export
- (Import/Export) Tags are now preserved when exporting and importing dashboards and charts.
Admin
- (Admin) Updated interface for viewing Groups in workspaces
- (Admin) Updated interface for Data Access Roles
Fixes
Dashboard
- (Dashboards) Filters no longer incorrectly appear in "Filters out of scope" after editing non-scope properties like sort settings.
- (Dashboards) "Clear All" button on dashboard filters now properly clears dependent filters that have required parent filters.
- (Dashboards) Cross-filters no longer persist on some charts after removing the cross-filter while charts are still loading.
- (Dashboards) Refreshing a dashboard now properly updates charts in all tabs, not just the currently visible tab.
- (Dashboards) Dashboard permalinks no longer include edit mode, preventing accidental editing when sharing links.
- (Dashboards) Download as Image now captures entire Table and Handlebars charts, not just visible portion.
- (Dashboards) Dependent filters with "Select first filter value by default" now work correctly.
- (Dashboards) Thumbnail API now returns 404 instead of 500 errors when image data is missing.
- (Dashboards) World map charts now use the correct country code format when cross-filtering.
- (Dashboards) Fixed an issue where filter values were sometimes not sorting correctly
- (Dashboards) CSS Template editor no longer crashes on invalid CSS selectors.
Charts
- (Charts) Fixed an issue where only the first page of results was downloaded when exporting a CSV even when the user was on a different page
- (Charts) Time Table calculations are now consistent between filtered and unfiltered views.
- (Charts) Virtual dataset names without schema prefix now display correctly in chart list.
- (Charts) Chart properties Facepile now shows correct users after saving.
- (Charts) Browser tab name now shows chart name when opening a chart.
- (Charts) Fixed color gradient formatting on Tables
- (Charts) Updated Latvia geographic data
- (Charts) Table chart column order is now preserved correctly when layout is changed with time comparison.
- (Charts) "Match time shift color with original series" checkbox now works correctly in time series charts.
- (Charts) Annotation layers are no longer incorrectly counted in tooltip total and percentage calculations.
- (Charts) Bar chart X-axis time formatting can now be changed from "Adaptive" to other formats.
- (Charts) NULL values in categorical x-axis are now displayed in ECharts bar charts.
- (Charts) Bar chart labels for negative values are now positioned correctly.
- (Charts) Series style control is now hidden for line charts where it has no effect.
- (Charts) Big Number with Trendline no longer runs 2 identical queries unnecessarily for additive metrics.
- (Charts) Histogram charts now handle NULL values on the chart x axis gracefully instead of failing.
- (Charts) Sunburst chart cross-filtering now works correctly for hierarchies with more than two levels.
- (Charts) Removed non-functional server pagination option from Handlebars chart controls.
- (Charts) Fixed an error where deck.gl aggregated charts were failing to render
- (Charts) Deck.gl Polygon charts now correctly display legends when using linear palette or fixed color schemes.
- (Charts) Deck.gl Polygon map legend now correctly includes min/max values in breakpoints.
- (Charts) Fixed Deck.gl polygon elevation when using fixed values.
- (Charts) Cartodiagram now renders ECharts visualization types correctly.
- (Charts) Drill to Detail now works correctly when X-axis column has a verbose_name defined at dataset level.
- (Charts) Drill by pagination now works correctly with MSSQL data sources.
- (Charts) Drill to Detail now uses column labels instead of column names.
- (Charts) Removing drill-to-detail filter no longer throws an error.
- (Datasets) Fixed an issue where dataset changes would not always cause the cache to be invalidated and thus could show outdated data
- (Datasets) Fixed an issue where newly created datasets were sometimes not appearing when creating dashboard filters
- (Datasets) Users can now skip column sync when saving virtual datasets if SQL changes don't affect columns.
- (Datasets) Dataset update endpoint now validates SQL queries, matching the validation on dataset creation.
- (Datasets) Calculated columns no longer reorder unexpectedly when editing SQL expressions.
- (Datasets) Time filters are no longer applied twice in charts powered by virtual datasets
- (Datasets) Fixed sync columns checkbox not responding to clicks in virtual datasets.
- (Datasets) Switching from virtual to physical dataset now properly clears SQL
- (SQL Lab) Strings containing angle brackets (e.g., abcdef:12345) now display correctly in query results.
- (SQL Lab) Query History now shows actual execution duration instead of total time including queue delays.
- (SQL Lab) Improved Jinja template error handling in virtual dataset queries with proper status codes.
- (SQL Lab) Save Query modal no longer closes immediately when clicking save on a new tab.
- (SQL Lab) CSV export now properly encodes UTF-8 with BOM for non-English characters
- (SQL Lab) Executed SQL now displays correctly in the result table SQL modal
- (SQL Lab) Copy link to clipboard now works correctly
Databases
- (Databases) Commas can now be typed correctly in database configuration fields for schema lists.
- (Databases) Drill database labels now have suffix to avoid alias collision with source columns.
- (Databases) Improved performance and parsing of CSV file uploads to databases
- (Databases) Boolean filters now generate correct SQL syntax for Athena compatibility.
- (Databases) Fixed Doris database date type mapping that was incorrectly mapped to string.
- (Databases) Applied alias ambiguity fix for Dremio
- (Databases) DuckDB unsigned integer and FLOAT/DOUBLE types are now recognized as numeric columns
- (Databases) Improved how Pinot handles functions
- (Databases) Presto get_columns now returns proper data type, fixing dataset creation.
- (Databases) Boolean filters now work correctly with Snowflake.
Alerts & Reports
- (Alerts & Reports) Slack channel fetching now handles rate limiting correctly in workspaces with large Slack organizations
Embedded
- (Embedded) Drill requests are now skipped if user doesn't have drilling permissions, avoiding 403 errors.
API
- (API) Fixed CSV downloads from Interactive Table charts to not deduplicate raw records in exports
- (API) Dataset creation now returns 422 status code on invalid SQL instead of server error.
- (API) Row Level Security API now returns 200 on update success instead of 201.
- (API) UUID is now a valid search column in REST APIs.
Import/Export
- (Import/Export) Dataset exports now include ID in filename to prevent overwrites when datasets have same name.
- (Import/Export) Cross filter scoping chart ID references are now updated correctly during dashboard import.
- (Import/Export) Fixed an import error when template parameters were an empty string
Explore
- (Explore) Overwriting a chart after changing its datasource now shows the updated chart instead of the cached previous version.
- (Explore) Removed duplicate "Changing this control takes effect instantly" descriptions for render-trigger controls.
- (Explore) "Download as image" now correctly captures chart canvases instead of exporting blank images.
Tags
- (Tags) Tag get_objects API endpoint now applies proper permissions, hiding inaccessible objects.
- (Tags) Creating tags with mix of unique and non-unique names no longer fails the API call.
Performance
- (Performance) Cache warm-up API now correctly applies dashboard filters to non-legacy visualizations.
Jan 14, 2026
Enhancements and Fixes
- (Charts) Downloaded CSVs of Interactive Tables or Pivot Tables will have filters and sorting that match the chart
- (Charts) Fixed an issue where time comparison tables were returning total values as NULL
Dec 10, 2025
Enhancements and Fixes
- (Charts) When saving or overwriting an Interactive Table or Interactive Pivot Table in the Chart Builder, the dashboards containing the chart will show the update immediately
- (Charts) Pinned columns and sorted columns in Interactive Tables will now correctly reflect in dashboards
- (Charts) Fixed an issue where column width of Interactive Tables was not saving
- (Charts) Addressed an issue with CSV downloads from Interactive Tables where unaggregated data wasn't downloading all the rows
- (Charts) Fixed an issue where time shifts with a custom time comparison weren't working properly
- (Charts) Fixed an issue in Time Series Tables where unfiltered data was sometimes causing inconsistent values
- (Databases) Added support for Amazon DynamoDB
- (Databases) Added additional support for time grain options for Clickhouse, Clickhouse Connect, and Trino
- (Databases) Fixed a bug where European servers were unable to connect to MotherDuck
- (Performance) Improved the load times on the Dashboards page
Nov 19, 2025
Enhancements and Fixes
- (Dashboards) Added support for iFrames in Handlebars chart types
- (Charts) Fixed an issue with time comparisons where custom comparison date ranges were sometimes not getting parsed correctly
- (Databases) Fixed a bug where queries from SingleStore databases would show parsing errors
- (Alerts & Reports) Addressed an issue that was causing blank screenshots and PDFs in long dashboards
Nov 12, 2025
New Features
- (Charts) Interactive Tables will now retain column visibility, column ordering, sorting, and filters when sharing a permalink or exporting a CSV
Enhancements and Fixes
- (Databases) Fixed an issue where Impala database connections were not allowing dataset creation
- (Databases) Added support for the SingleStore database
- (Alerts & Reports) Fixed some issues where alerts and reports with long running or failing queries were not being handled properly. Now, those errors should be logged to the execution log and owners will be notified if the report fails
- (Alerts & Reports) Emails to alert and report owners when an alert or report fails will now include the task id for debugging purposes
Oct 20, 2025
Enhancements and Fixes
- (Charts) Fixed an issue where Interactive Pivot Tables weren't correctly retaining the hidden column groups, hidden row groups, or pivot ordering after refreshing the chart
Oct 8, 2025
New Features
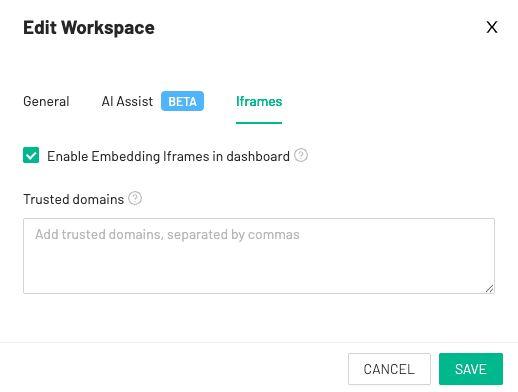
- (Dashboards) Added support for embedding iFrames in dashboard markdown components. Team admins can enable this feature in workspace settings and add a list of trusted domains. Then, dashboard creators can add markdown components with iFrames.
Enhancements and Fixes
- (Dashboards) Addressed an issue where tags couldn't be edited from dashboard properties
- (Charts) Interactive Pivot Tables now support different number and currency formatting for each metric. Use the Customize columns controls in the Customize tab in the Chart Builder
- (Charts) Added a control for sorting Interactive Pivot table columns alphabetically A-Z or Z-A
- (Charts) Addressed an issue where dimension values in columns with a name containing a dot would be returned as blank in Interactive Pivot tables
- (Charts) Fixed a bug where pivot table exports would only export the first table even if multiple pivot tables exist on the dashboard
- (Datasets) Added support for embedded users to use the
{{ metric() }}Jinja macro
Sept 17, 2025
New Features
- (Charts) New Interactive Pivot Table chart type allows for easily grouping, aggregating, and rendering your data in a pivot table view. Update an existing Pivot Table to an Interactive Pivot Table by updating its chart type, or create a new Interactive Pivot Table to try it out! Read more about our new chart type here.
- (Dashboards) New time and date filters in dashboards and charts!
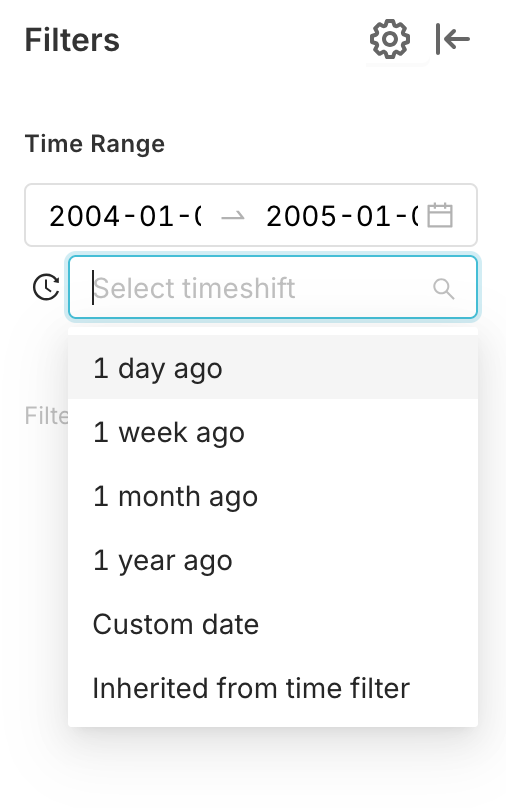
A redesigned interface is now available when adding time filters to dashboards or charts. The new filters make it easier to select dates and ranges while keeping the existing functionality for selecting relative and custom time periods.
Note: this feature is being rolled out gradually. If you'd like to enable the feature now, please reach out to your Customer Success Manager.
- (Dashboards) A new dashboard filter setting for Time range filter types allows selecting time shifts at the dashboard level.
Note: This feature is only available to teams using the new time and date filters.
The time comparison value set at the dashboard filter level will apply to Table charts and Interactive Table charts that use Time Comparisons.
Enhancements and Fixes
- (Dashboards) Fixed a bug where table charts would appear blank after refreshing a dashboard and switching to a tab containing table charts
- (Dashboards) Resolved an issue that was causing Interactive Tables to fail to render in embedded dashboards
- (Dashboards) Fixed bugs in the new time selector modal
- (Dashboards) The new time filters are now correctly appearing in embedded dashboards
- (Dashboards) Updated dashboard download files that would previously be named
screenshot.pngandscreenshot.pdfto use the dashboard title in the file name - (Charts) Fixed an issue in the Table and Interactive Table chart types where
NULLvalues were being categorized as string column types instead of numeric column types - (Datasets) Fixed an issue where dataset names would not appear in the list view if there was no schema defined
- (Databases) Fixed how single quotes are escaped in Databricks, Athena, and Pinot
- (SQL Lab) File Uploads queries no longer throw an error when no data is present and instead return empty results
Aug 25, 2025
New Features
- (Datasets) When creating a dataset, Preset will read the column
commentfield and store the information in the dataset column description
Enhancements and Fixes
- (Charts) Fixed a bug where Interactive Tables with time comparison range "Inherit" were displayed incorrectly
- (Charts) Improved the column size persistence on Interactive Tables
- (Charts) Fixed percentage metric column calculation to ensure accurate percentage displays in table charts with time comparisons
- (Charts) Fixed an issue with search functionality on the color palettes drop down
- (Charts) Improved the Interactive Pivot table based on beta feedback: left panel is now collapsed by default, improved the initial state of the table, improved persistence of the row and pivot groups as well as the column sizes, and fixed an issue with date column sorting
- (Alerts and Reports) Fixed an issue with search functionality on the Slack channels dropdown
- (Databases) Fixed a bug with connecting to BigQuery as a new user in the tutorial flow
- (Databases) Corrected an issue where a value of -1 in a cache timeout was being incorrectly interpreted as "cache forever" rather than "bypass cache"
Aug 6, 2025
New Features
- (Charts) Added support for downloading pivot tables as Excel files that preserve the visual pivot table structure. Available both from chart view and dashboard view. Note that this does not generate a pivot table in the Excel file.
Enhancements and Fixes
- (Dashboards) Fixed get_filters macro to properly handle IS_NULL and IS_NOT_NULL operators in template processing
- (Charts) Fixed an issue with "Render columns in HTML format" in pivot tables - now headers also render properly
- (Charts) "View in SQL Lab" button in the "View query" modal is now hidden for users who don't have access to SQL Lab
- (Charts) Fixed an issue where some users were unable to favorite charts
- (Databases) Fixed an issue affecting Postgres connections that have certificates in GCP
July 23, 2025
New Features
- (Charts) Added support for cross-filtering in deck.gl charts, enabling interactive filtering between geospatial visualizations.
Enhancements and Fixes
- (Charts) Fixed an issue with chart height calculation to ensure that axis labels are not cut off
- (Charts) Ensured that metric formatting is applied correctly in table charts
- (Drill By) Fixed an issue where drill-by was not working correctly with multi-metric charts
- (SQL Lab) Fixed a bug that was causing queries to fail in databases that support catalogs but not cross-catalog queries
- (Datasets) Fixed an issue with importing dataset currencies
- (Databases) Fixed string escaping for Databricks queries
- (RLS) Resolved an issue where the search in the RLS page wasn't returning the correct tables
- (General) Input fields in asset deletion modals now auto-focus in the text field
- (Performance) Improved performance when opening the chart save modal, reducing lag
- (Performance) Improved performance when loading the chart properties modal
July 9, 2025
New Features
- (Dashboards) Added a row limit warning in dashboards so that users understand that the chart may be showing partial data. This warning is hidden by default in embedded dashboards.
Enhancements and Fixes
- (Dashboards) Fixed the red highlight on required filters in dashboards
- (Dashboards) Resolved an error that occurred when clearing a filter that was configured to select the first option by default
- (Charts) Fixed the spacing on EChart tooltips between field names, values, and percentage values
- (Charts) Added a row limit control for Box Plot chart types
- (Charts) Fixed an issue where the D3 format wasn't always applied correctly
- (Databases) Resolved an issue that was preventing users with limited data access from getting a list of tables and views from the database
- (Databases) Added support for connecting to multiple Postgres or Oracle databases via SSL
Earlier Releases
- Changelog Archive
- See Preset's product announcement blog for key updates.