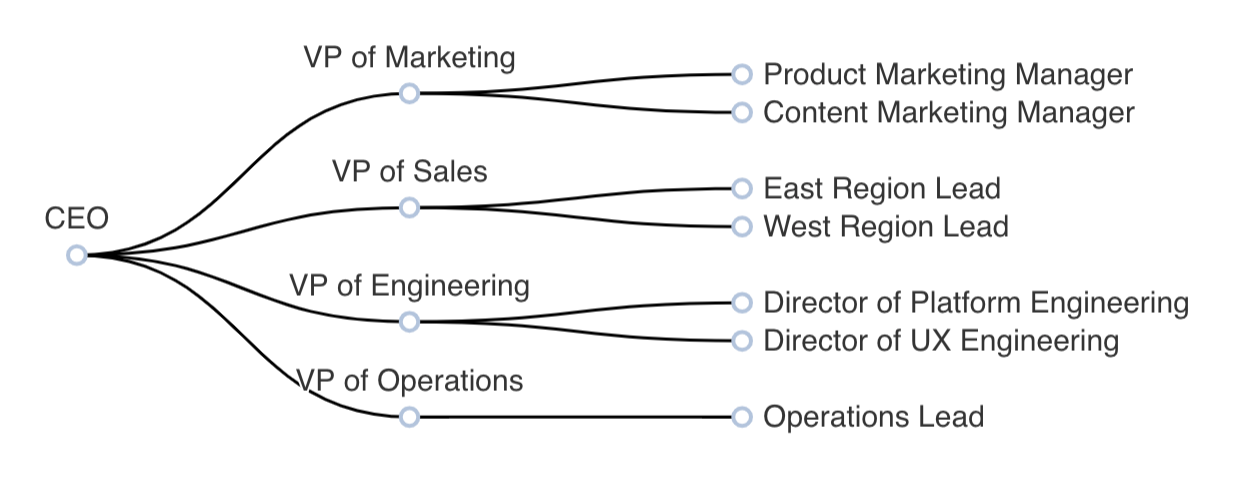
A tree chart excels at visualizing hierarchy. Here is an example of a tree chart created in Preset:
Reference Content
The following articles may be useful resources as you build your chart:
- Creating a Chart: A walkthrough of the overall process of chart selection and creation.
- Using Preset Chart Builder: How to work with the Chart Builder page, the primary interface used when creating a chart.
Creating a Tree Chart
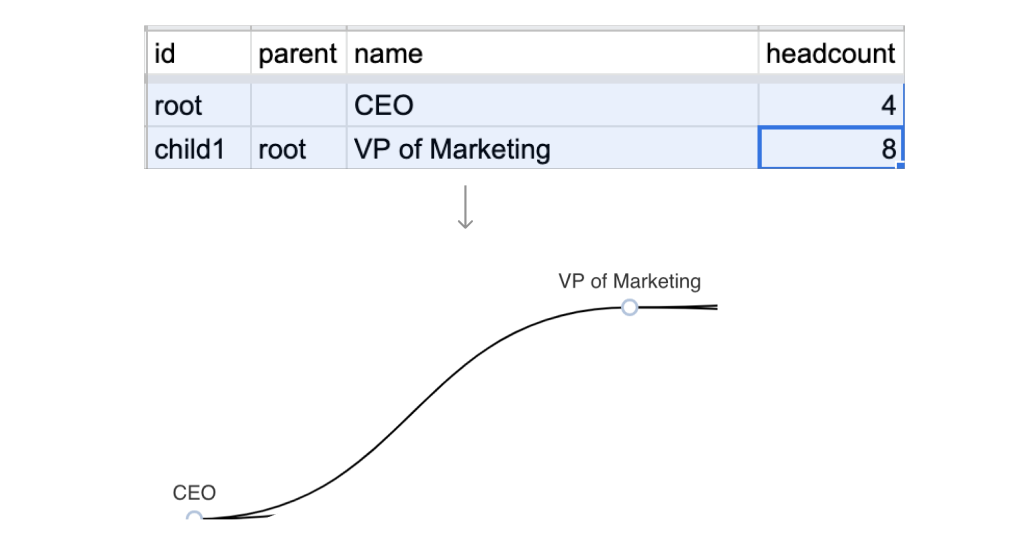
Creating a tree chart is similar to creating a graph chart with one exception: tree charts enforce hierarchy while graph charts do not. You still need nodes (or circles) and edges (or connecting lines between circles), but you also need additional information on the hierarchy. Here's an example of how two edges and the connecting edge is rendered in Preset and the original data it originated from:
 |
|
Here's a diagram that showcases the full lifecycle of how the data flows from your database to Preset when generating a tree chart.
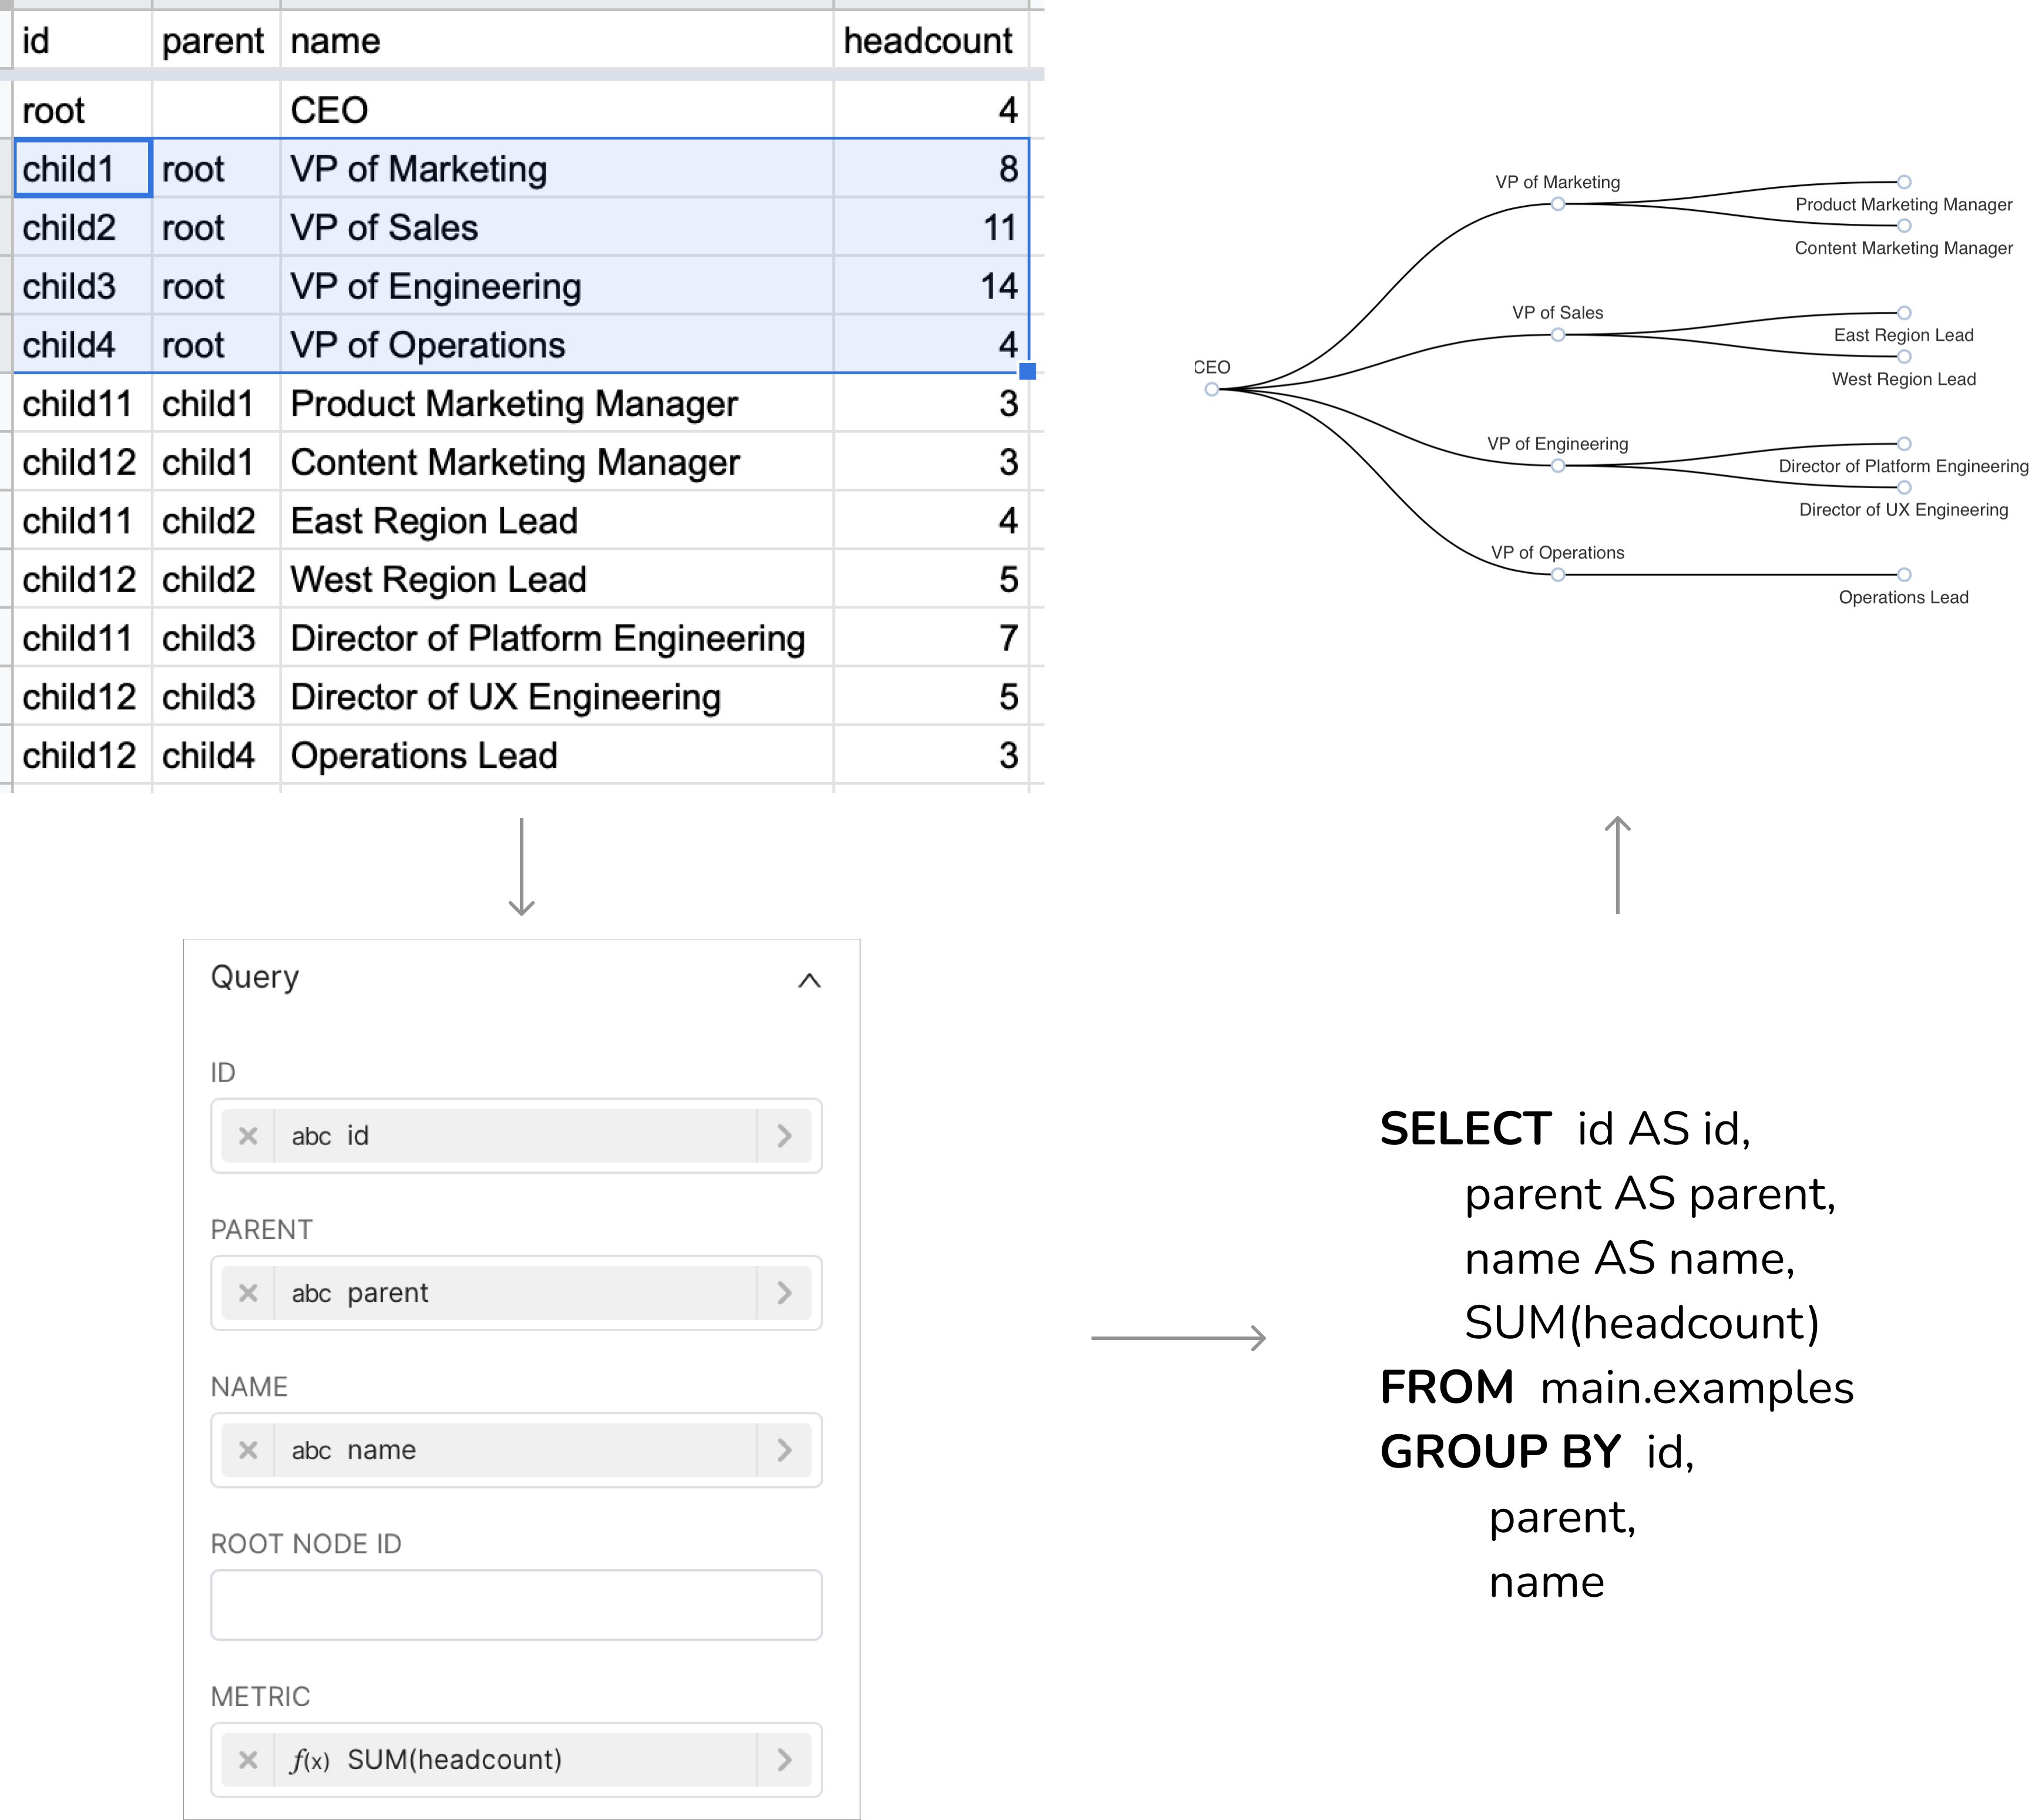
If your data isn't shaped this way and you're unable to modify the data at your database level, we recommend re-shaping the data in SQL Lab and publishing the result as a virtual dataset.
Customizing your Tree Chart
Under the Customize tab, you can find a number of options for customizing your tree chart further.
- Tree Layout: Orthogonal by default, but you can switch to a more circular (or Radial) layout if you'd like
- Tree Orientation: Choose between 2 horizontal tree options (Left to Right, Right to Left) and 2 vertical tree options (Top to Bottom, Bottom to Top).
- Node Label Position: Choose where you want the labels for the nodes to live in relation to the nodes themselves (Left, Top, Bottom, Right)
- Child Label Position: Choose where you want the labels for the children nodes to live (Left, Top, Bottom, Right)
- Emphasis: Define how you want the visual emphasis to be shown upon hovering (Ancestor, Descendant)
- Symbol: Define which symbol you want to be used to represent each node.
- Symbol Size: Slider to choose the size of each symbol (representing each node).
- Enable Graph Roaming: If you are visualizing a large number of nodes and edges and notice a slow down while scaling and moving, we recommend disabling some of the behaviors.
- Move only: chart users can click and drag the chart view but not zoom in or out.
- Scale only: chart users can zoom in or out but not click and drag the chart view.
- Scale and Move: chart users can both zoom in or out or click and drag to move around the chart view.
- Disabled: fixed chart view, no scaling or moving