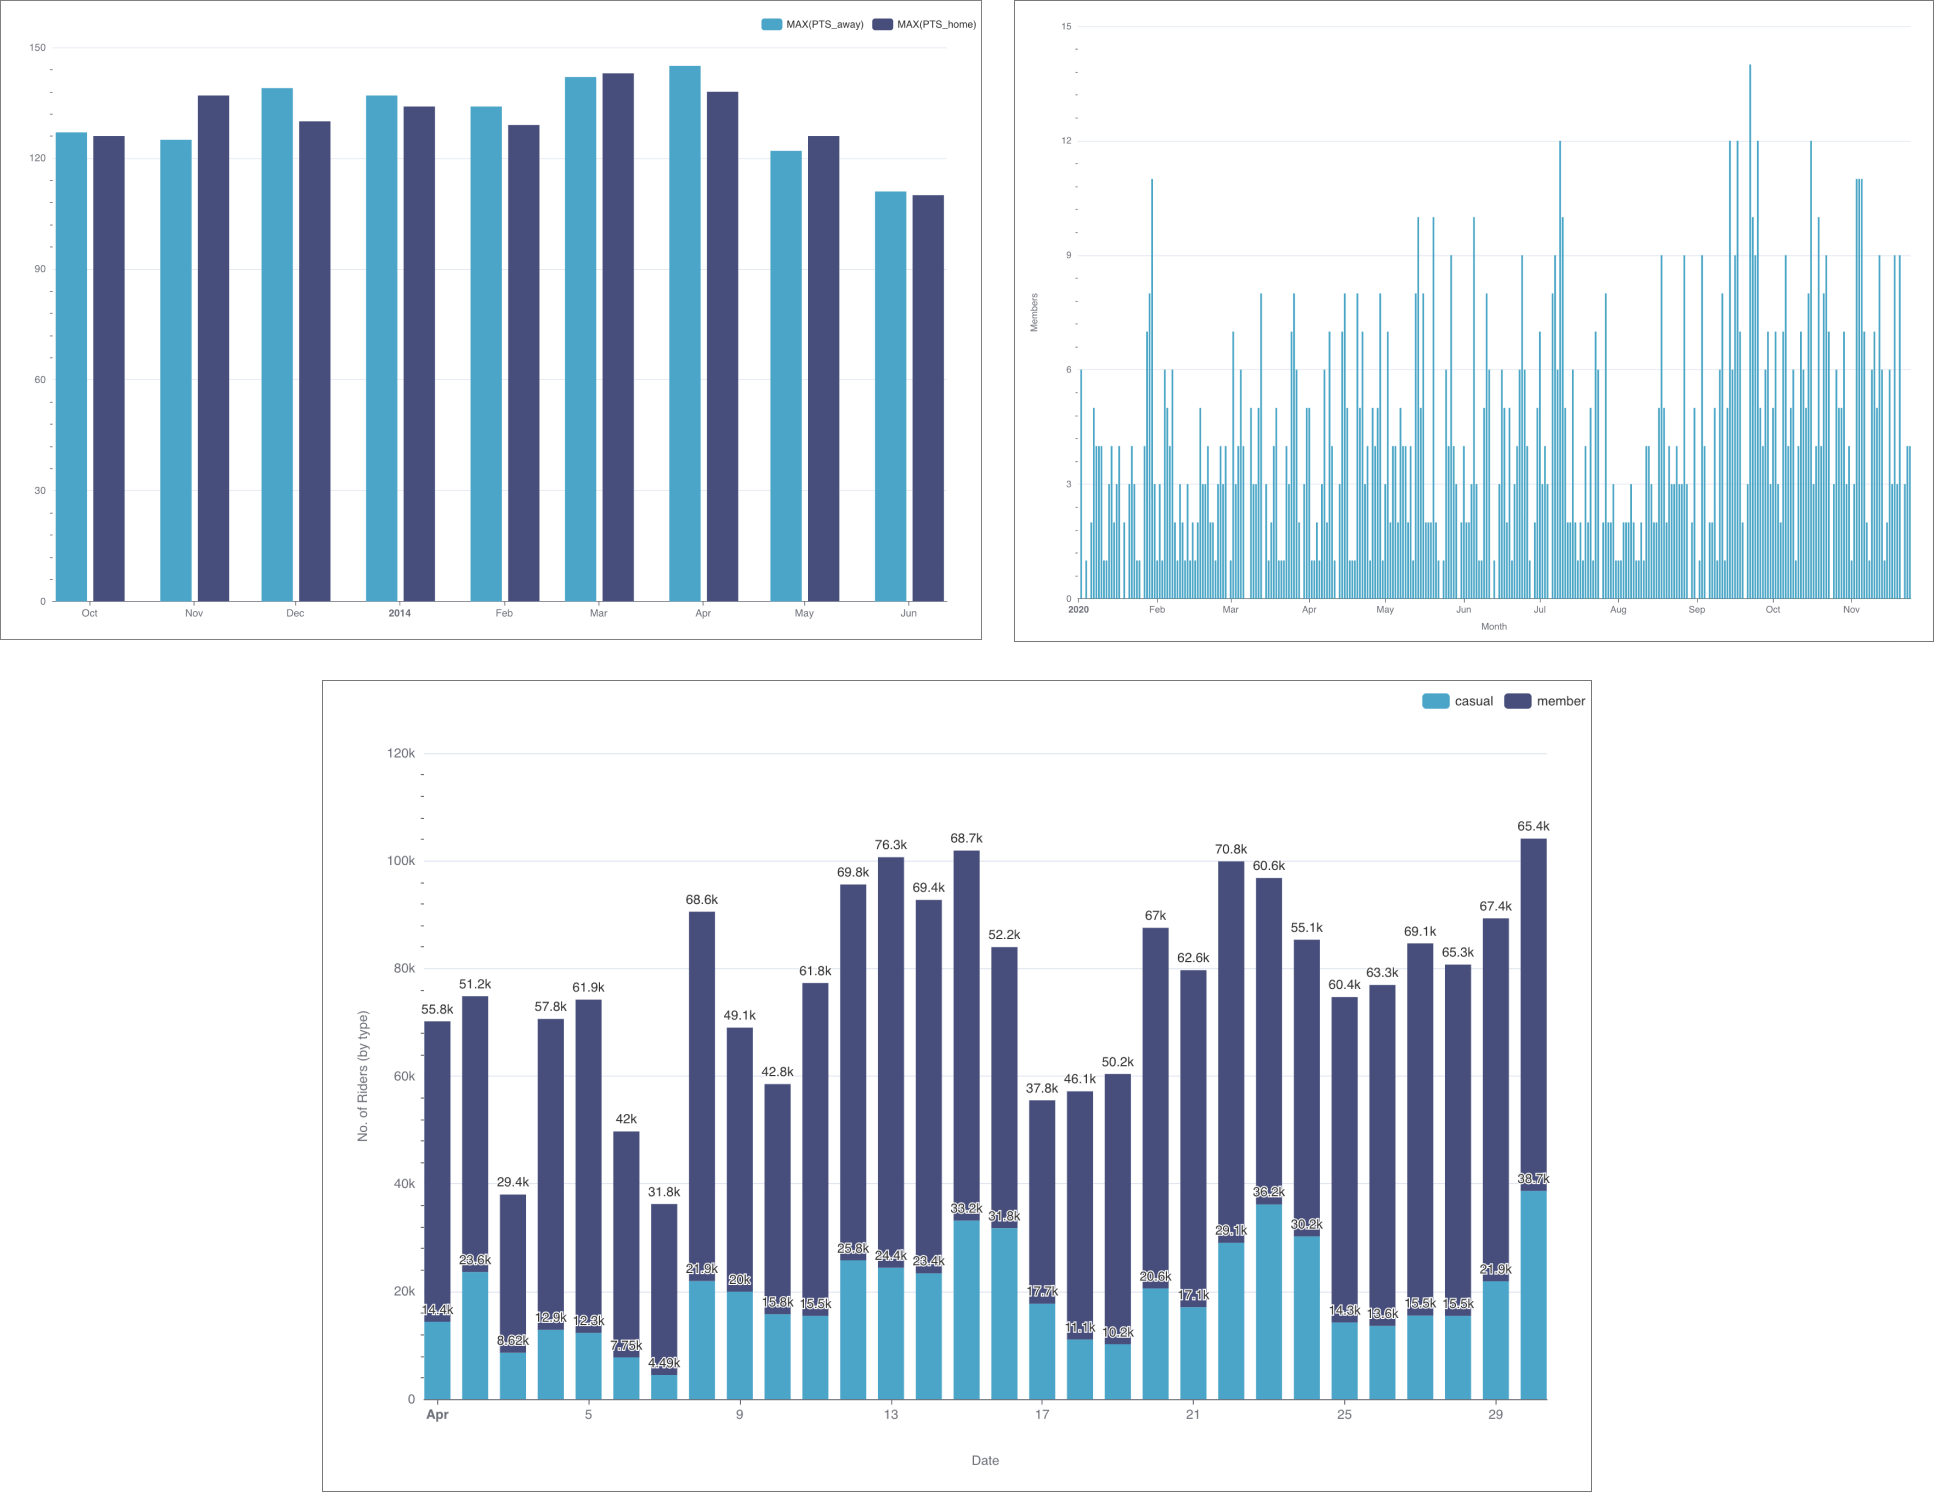
The Bar Chart excels at showcasing change over a dimension (e.g., time). In many domains, the distinction between discrete and continuous values is somewhat subtle. Here are some examples:
Reference Content
If you're new to visualizing data in Preset, we recommend the following reference articles:
- Creating a Chart: A walkthrough of the overall process of chart selection and creation.
- Using Preset Chart Builder: How to work with the Chart Builder page, the primary interface used when creating a chart.
Creating a Bar Chart
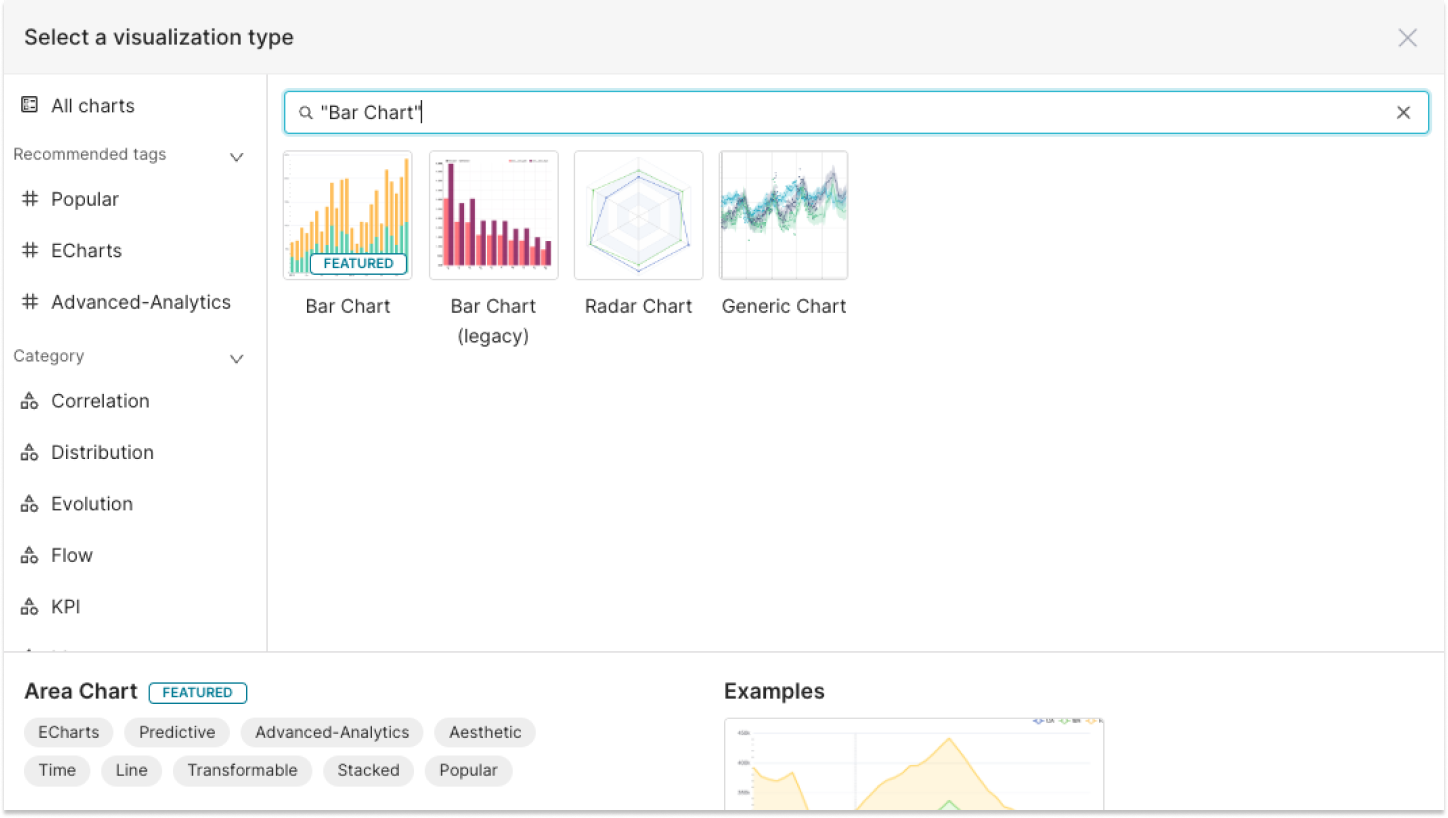
Preset currently has a few options for bar charts in the visualization picker:
- Bar Chart
- Bar Chart (legacy)
To visualize change over time using bars, we strongly recommend using the Bar Chart visualization type.
To create a Bar Chart, you need to define the following values:
- the column you want as the X-axis
- the metric(s) you want to visualize on the Y-axis
- the column(s) you want the metric(s) to be grouped / categorized by
These are all defined in the Data tab within Explore.
Simple Bar Chart (no dimensions)
Below is a very simple bar chart that shows a single metric varying over time.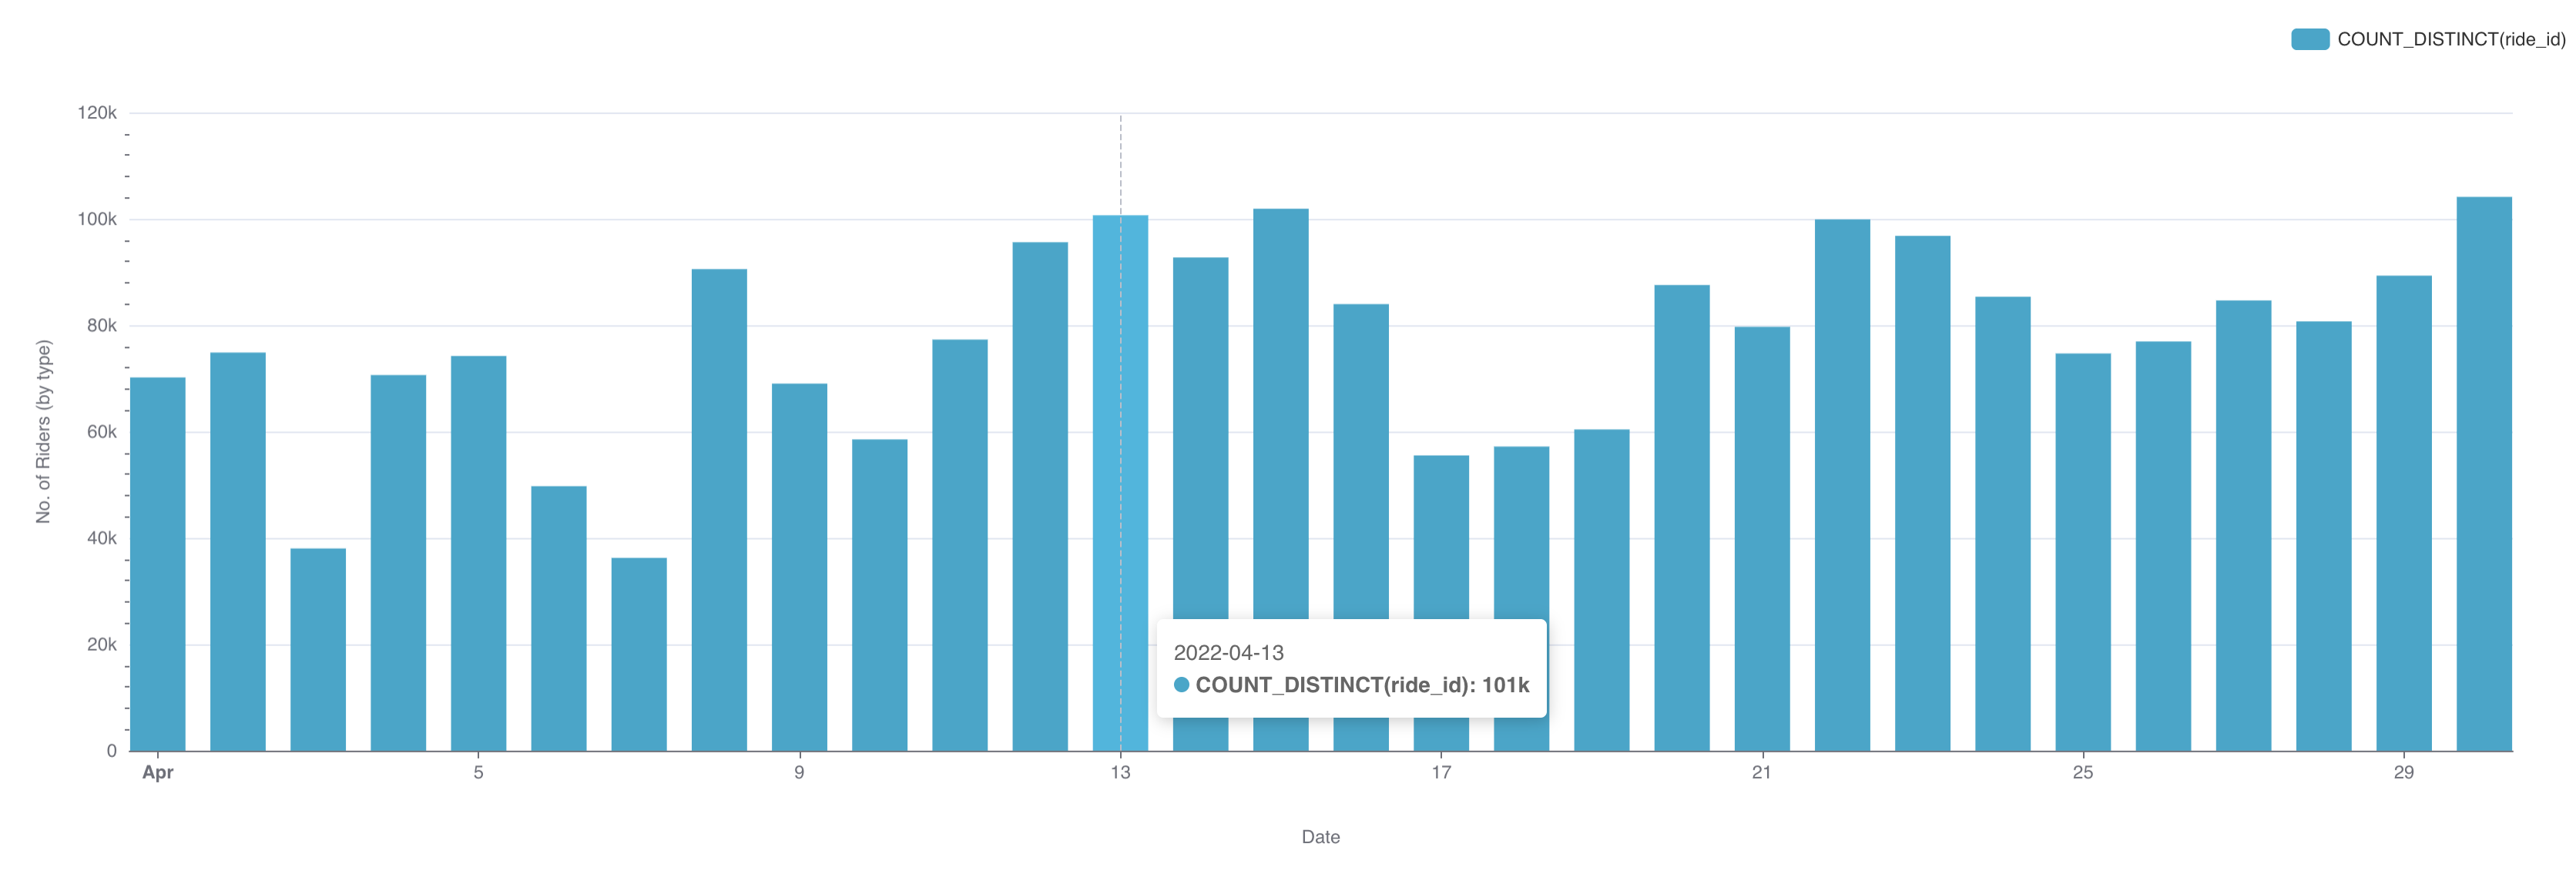
Here's an explanation of de selections we made in the chart builder interface to generate this chart.
.png) | X-axis
|
.png) | Metric(s) on Y-axis
|
Here's the SQL query that Preset generated:
SELECT DATE_TRUNC('DAY', started_at) AS "started_at",
       count(DISTINCT ride_id) AS "COUNT_DISTINCT(ride_id)"
FROM dbt_smukherjee.citibike_trips
WHERE started_at >= '2022-04-01 00:00:00.000000'
  AND started_at < '2022-05-01 00:00:00.000000'
GROUP BY DATE_TRUNC('DAY', started_at)
ORDER BY "COUNT_DISTINCT(ride_id)" DESC
LIMIT 10000
This hopefully helps you understand the mapping from the chart builder options above to the final generated SQL query.
Bar Chart (with dimensions)
Below is a similar chart to the one above but with a dimension (rider type) added.
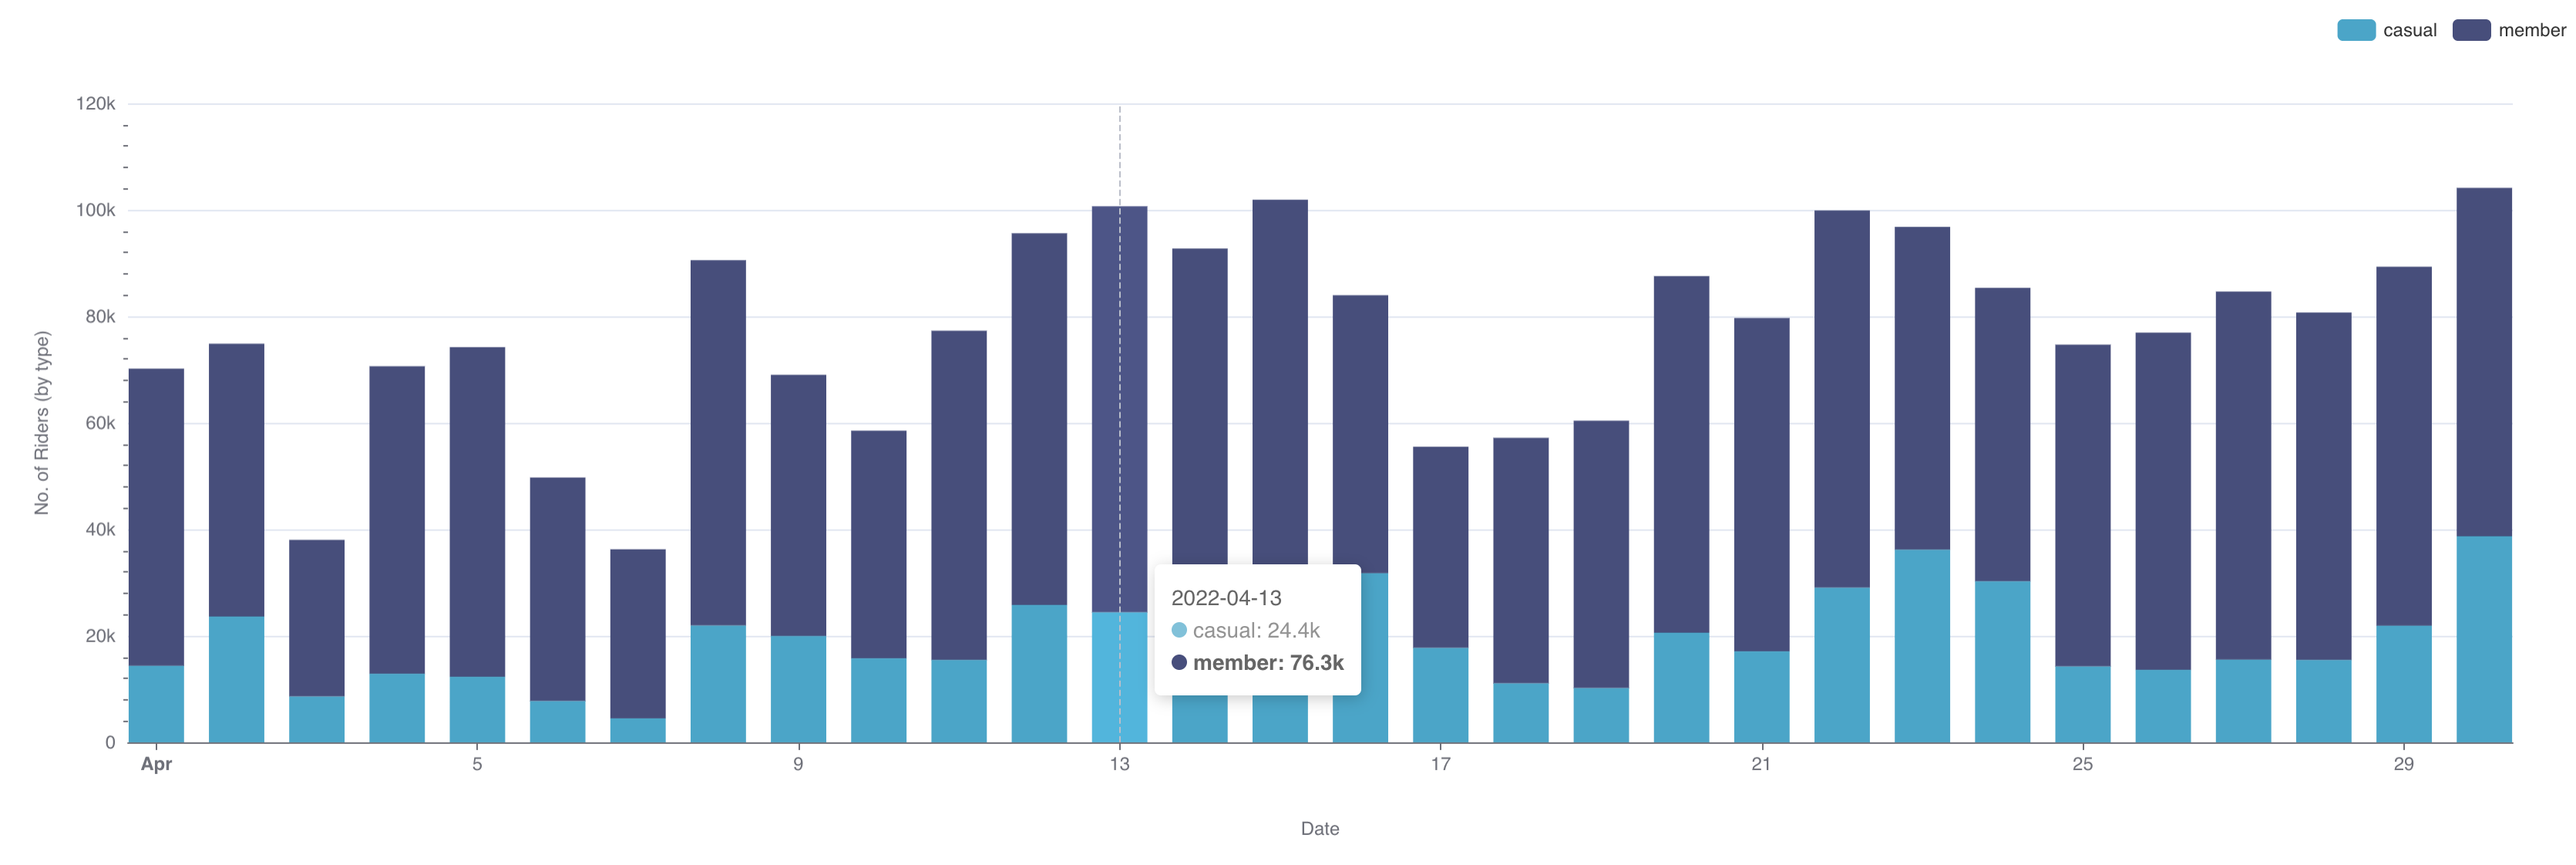
To generate this chart, we re-used the same selections from the first chart but made the following, additional selections:
.png) | Dimensions
|
Here's the SQL query that Preset generated:
SELECT DATE_TRUNC('DAY', started_at) AS "started_at",
       member_casual AS "member_casual",
       count(DISTINCT ride_id) AS "COUNT_DISTINCT(ride_id)"
FROM dbt_smukherjee.citibike_trips
WHERE started_at >= '2022-04-01 00:00:00.000000'
  AND started_at < '2022-05-01 00:00:00.000000'
GROUP BY DATE_TRUNC('DAY', started_at),
         member_casual
ORDER BY "COUNT_DISTINCT(ride_id)" DESC
LIMIT 10000
Truncate Metrics
The Truncate Metrics option allows you to visually round metric values shown in tooltips and labels, making them easier to read. This setting does not affect the underlying data or calculations—it's purely for display.
✅ Enabled: Values are rounded (e.g., to two decimal places).
⛔ Disabled: Full numeric precision is shown.
This option is available in charts like Bar Chart and Line Chart.
💡 Example: A value of
1234.56789will be shown as1,234.57when Truncate Metrics is enabled.
Stacked Bar Chart
One of the most used features in Bar charts is the Stack option. A stacked bar chart is a variation of the bar chart where bars are divided into segments, representing different subcategories within a total category. Instead of displaying each category separately, the stacked format helps compare both the overall total and the individual contributions of each subgroup.
Stacked bar charts are useful when you need to:
✅ Compare totals and subcategories in one view.
✅ Show part-to-whole relationships (e.g., sales by product category within each region).
✅ Highlight trends and proportions across different groups over time.
✅ Save space by consolidating multiple data series into a single visualization.
For example, if you want to analyze monthly sales performance across multiple product categories, a stacked bar chart can show both the total revenue per month and how much each category contributes to that total.
How to use this feature:
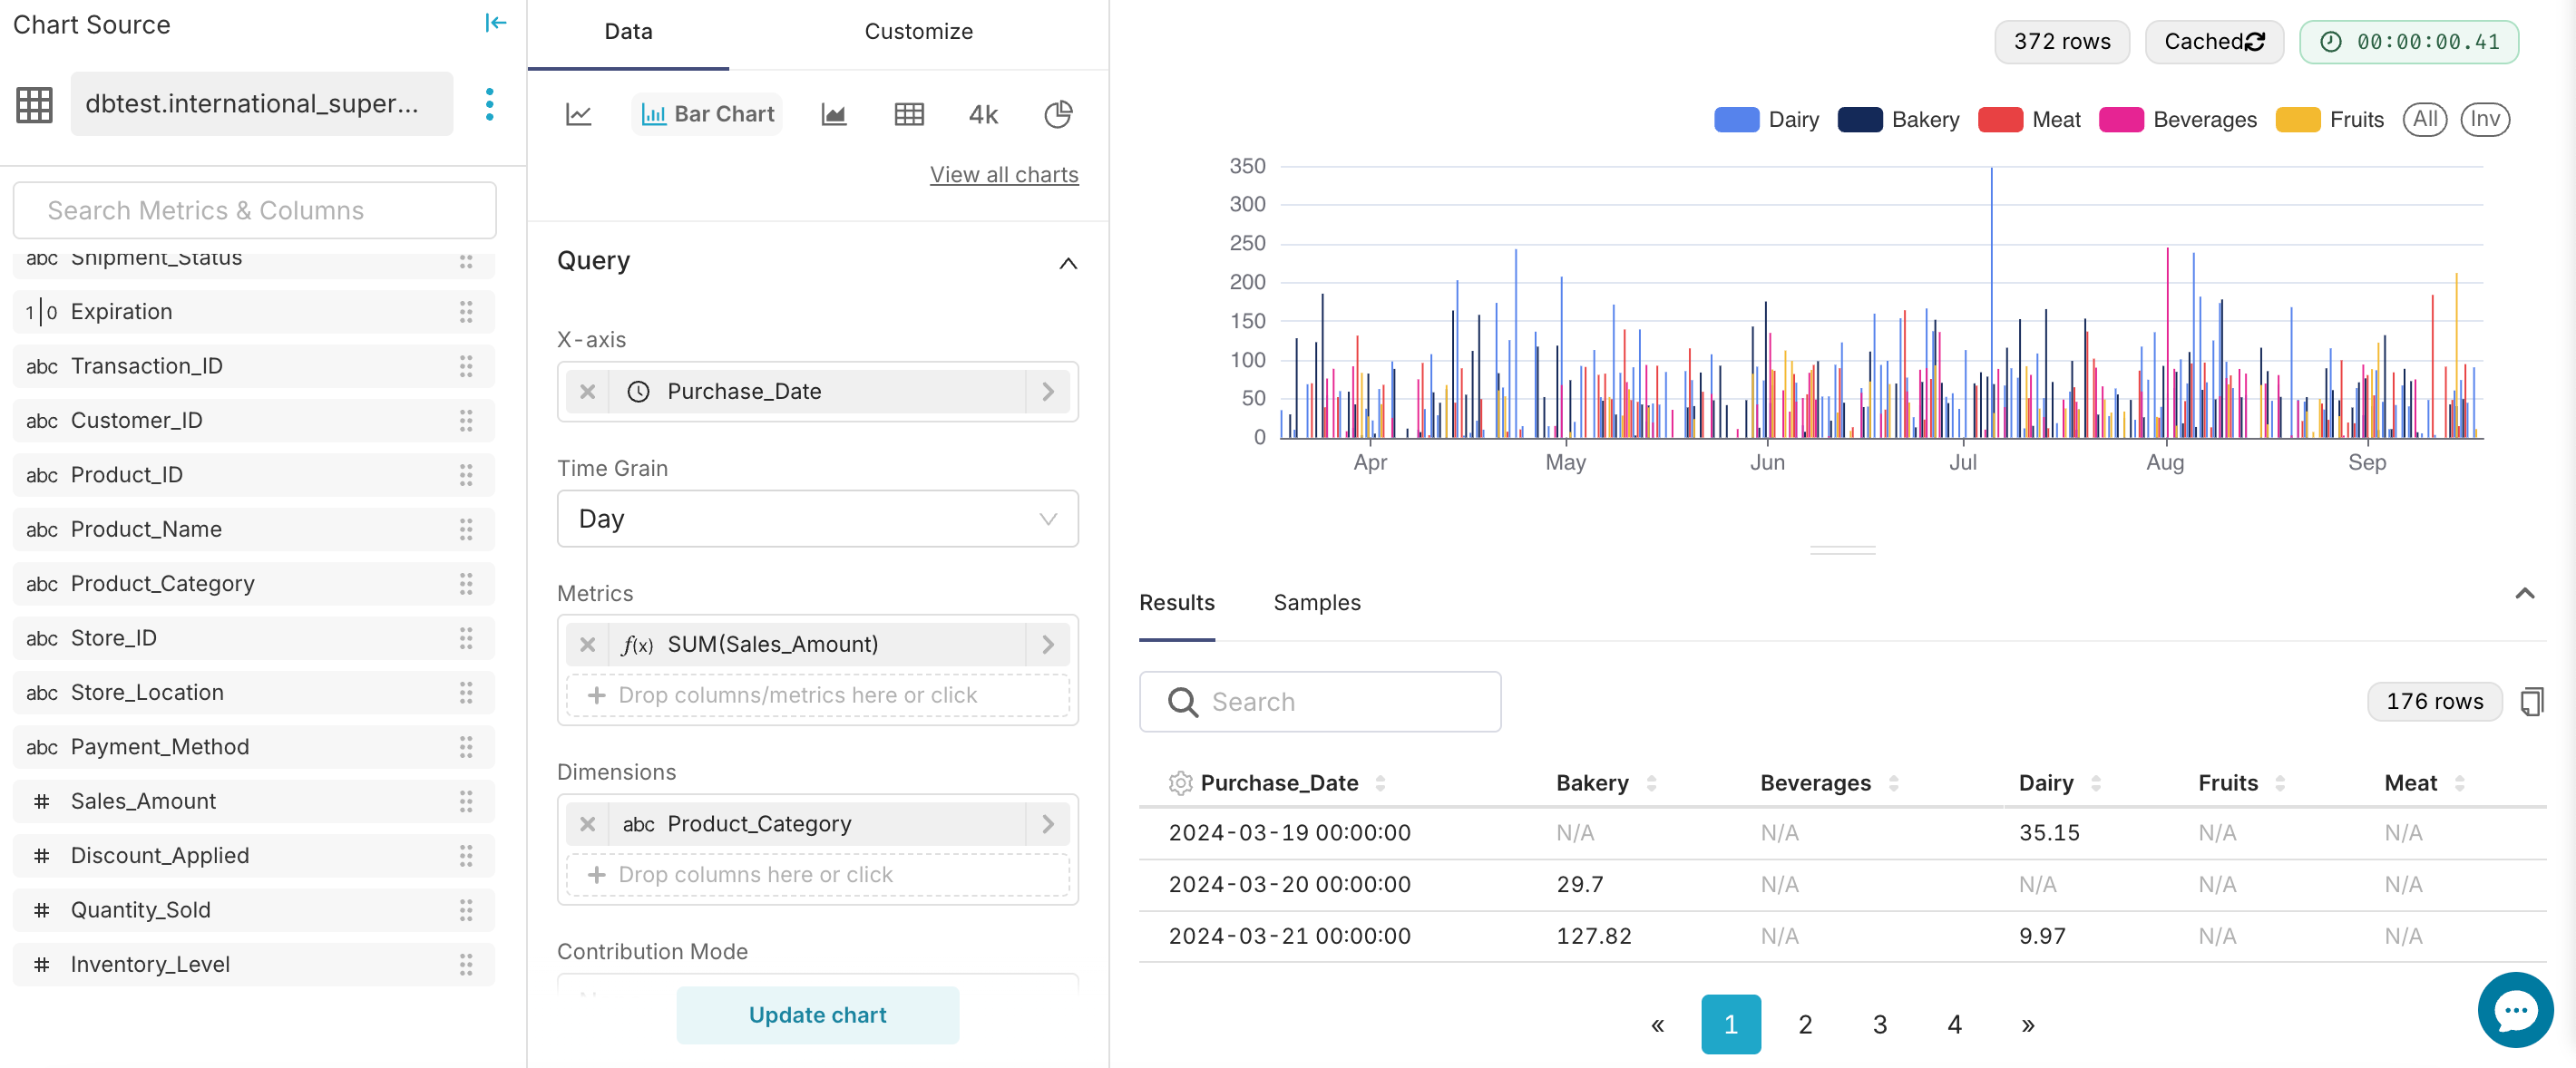
Create your normal bar chart using a column in the Dimensions section:
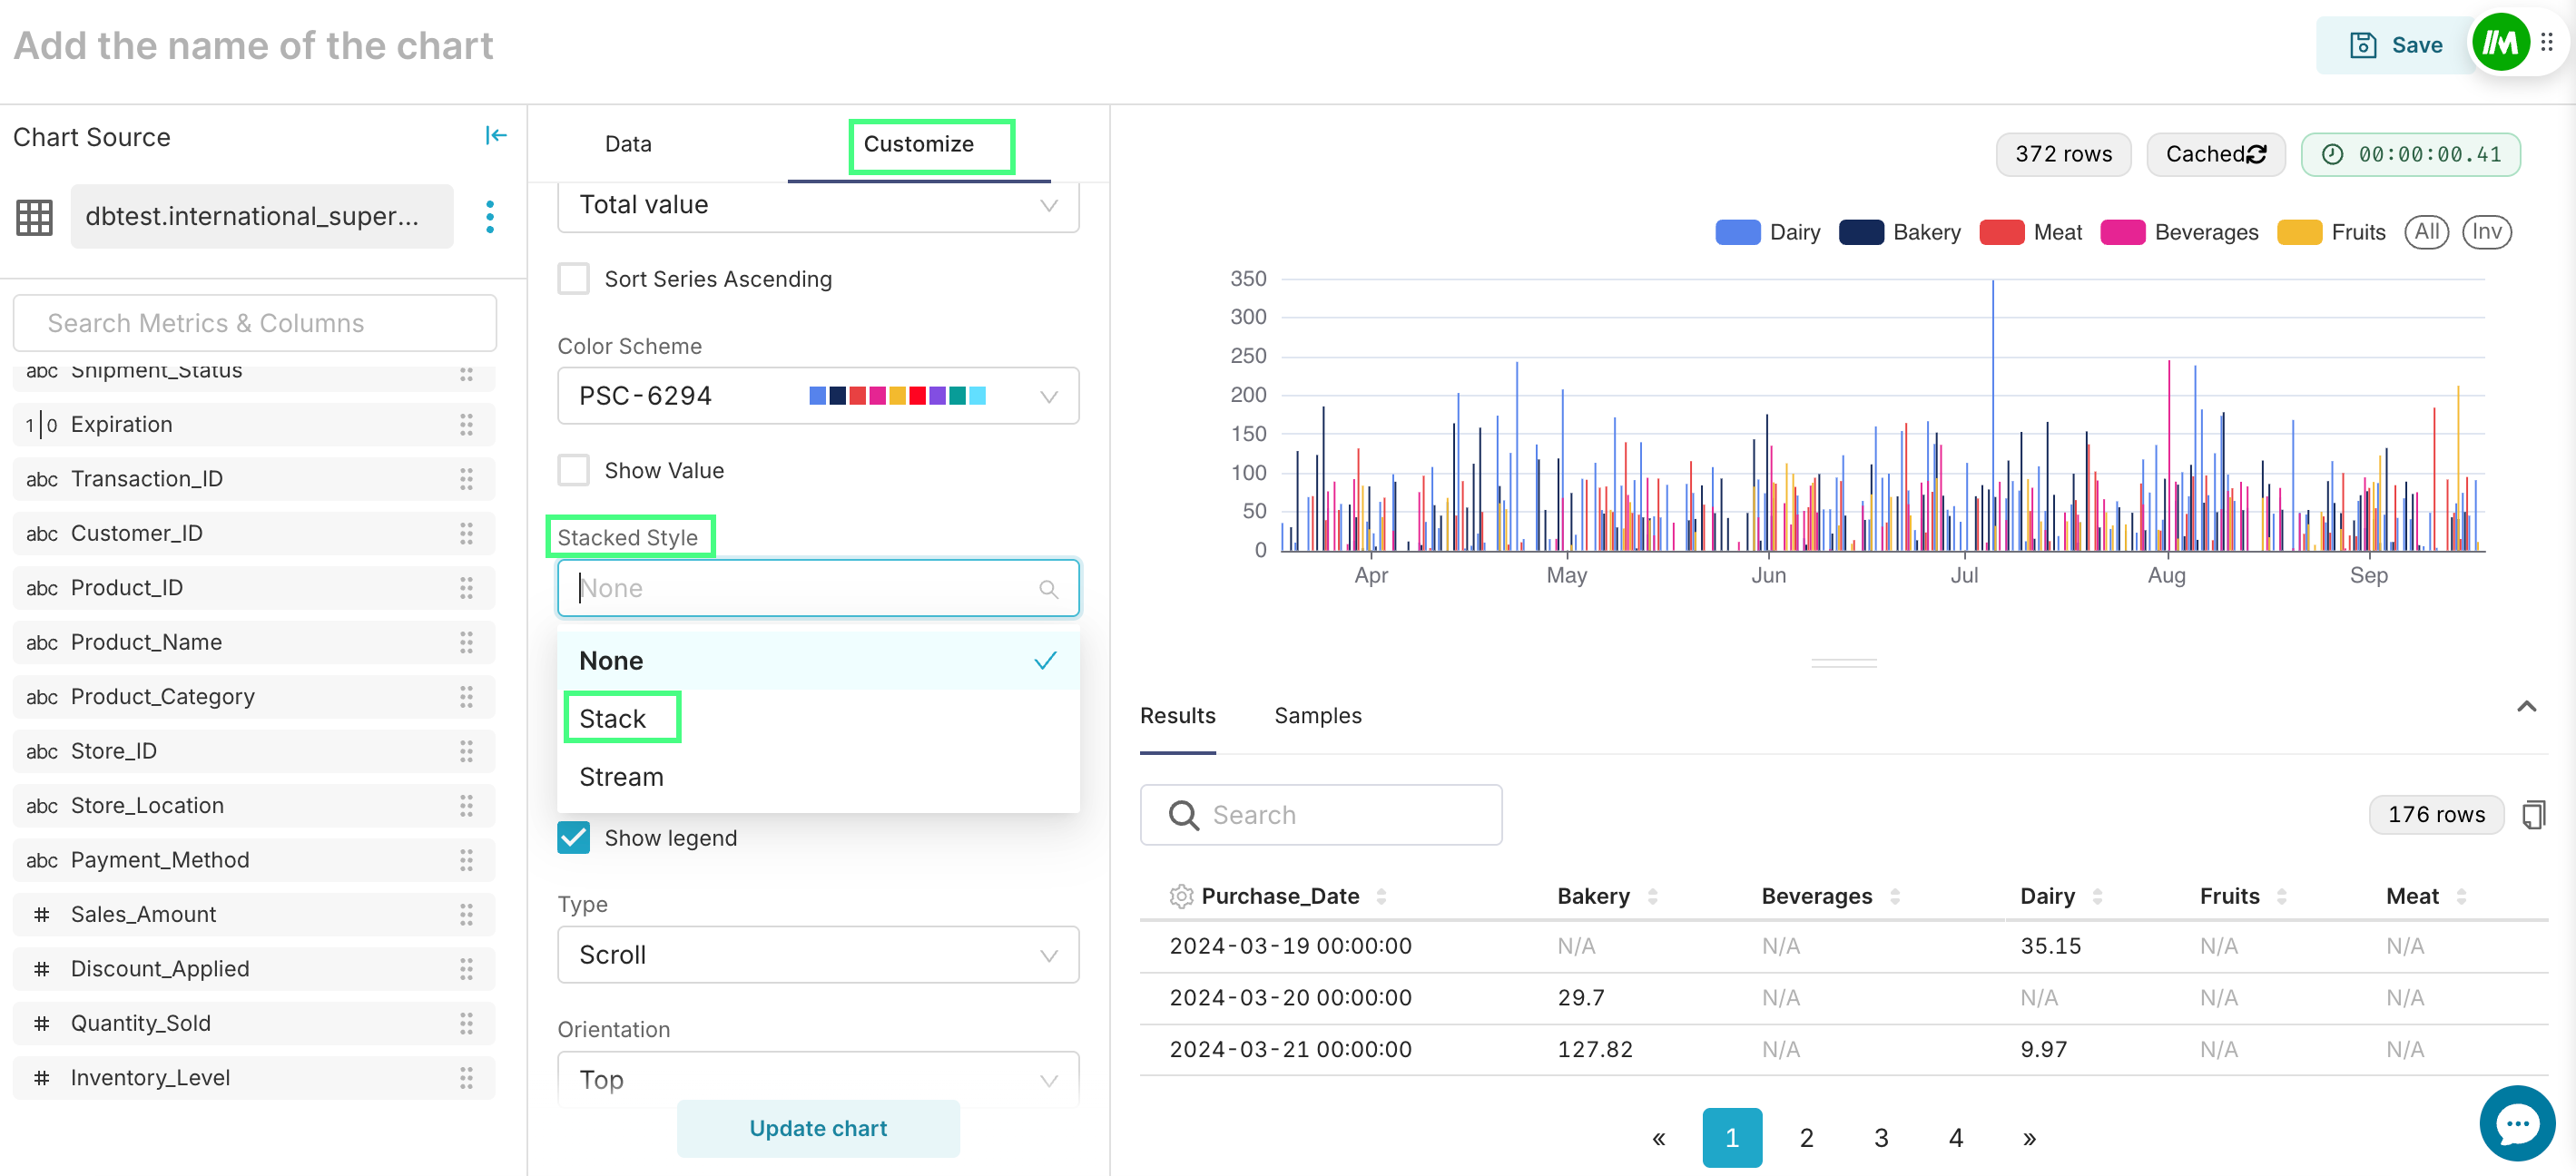
Go to the Customize tab and scroll down until you see the Stacked Style section. Click on the dropdown and select the Stack option:
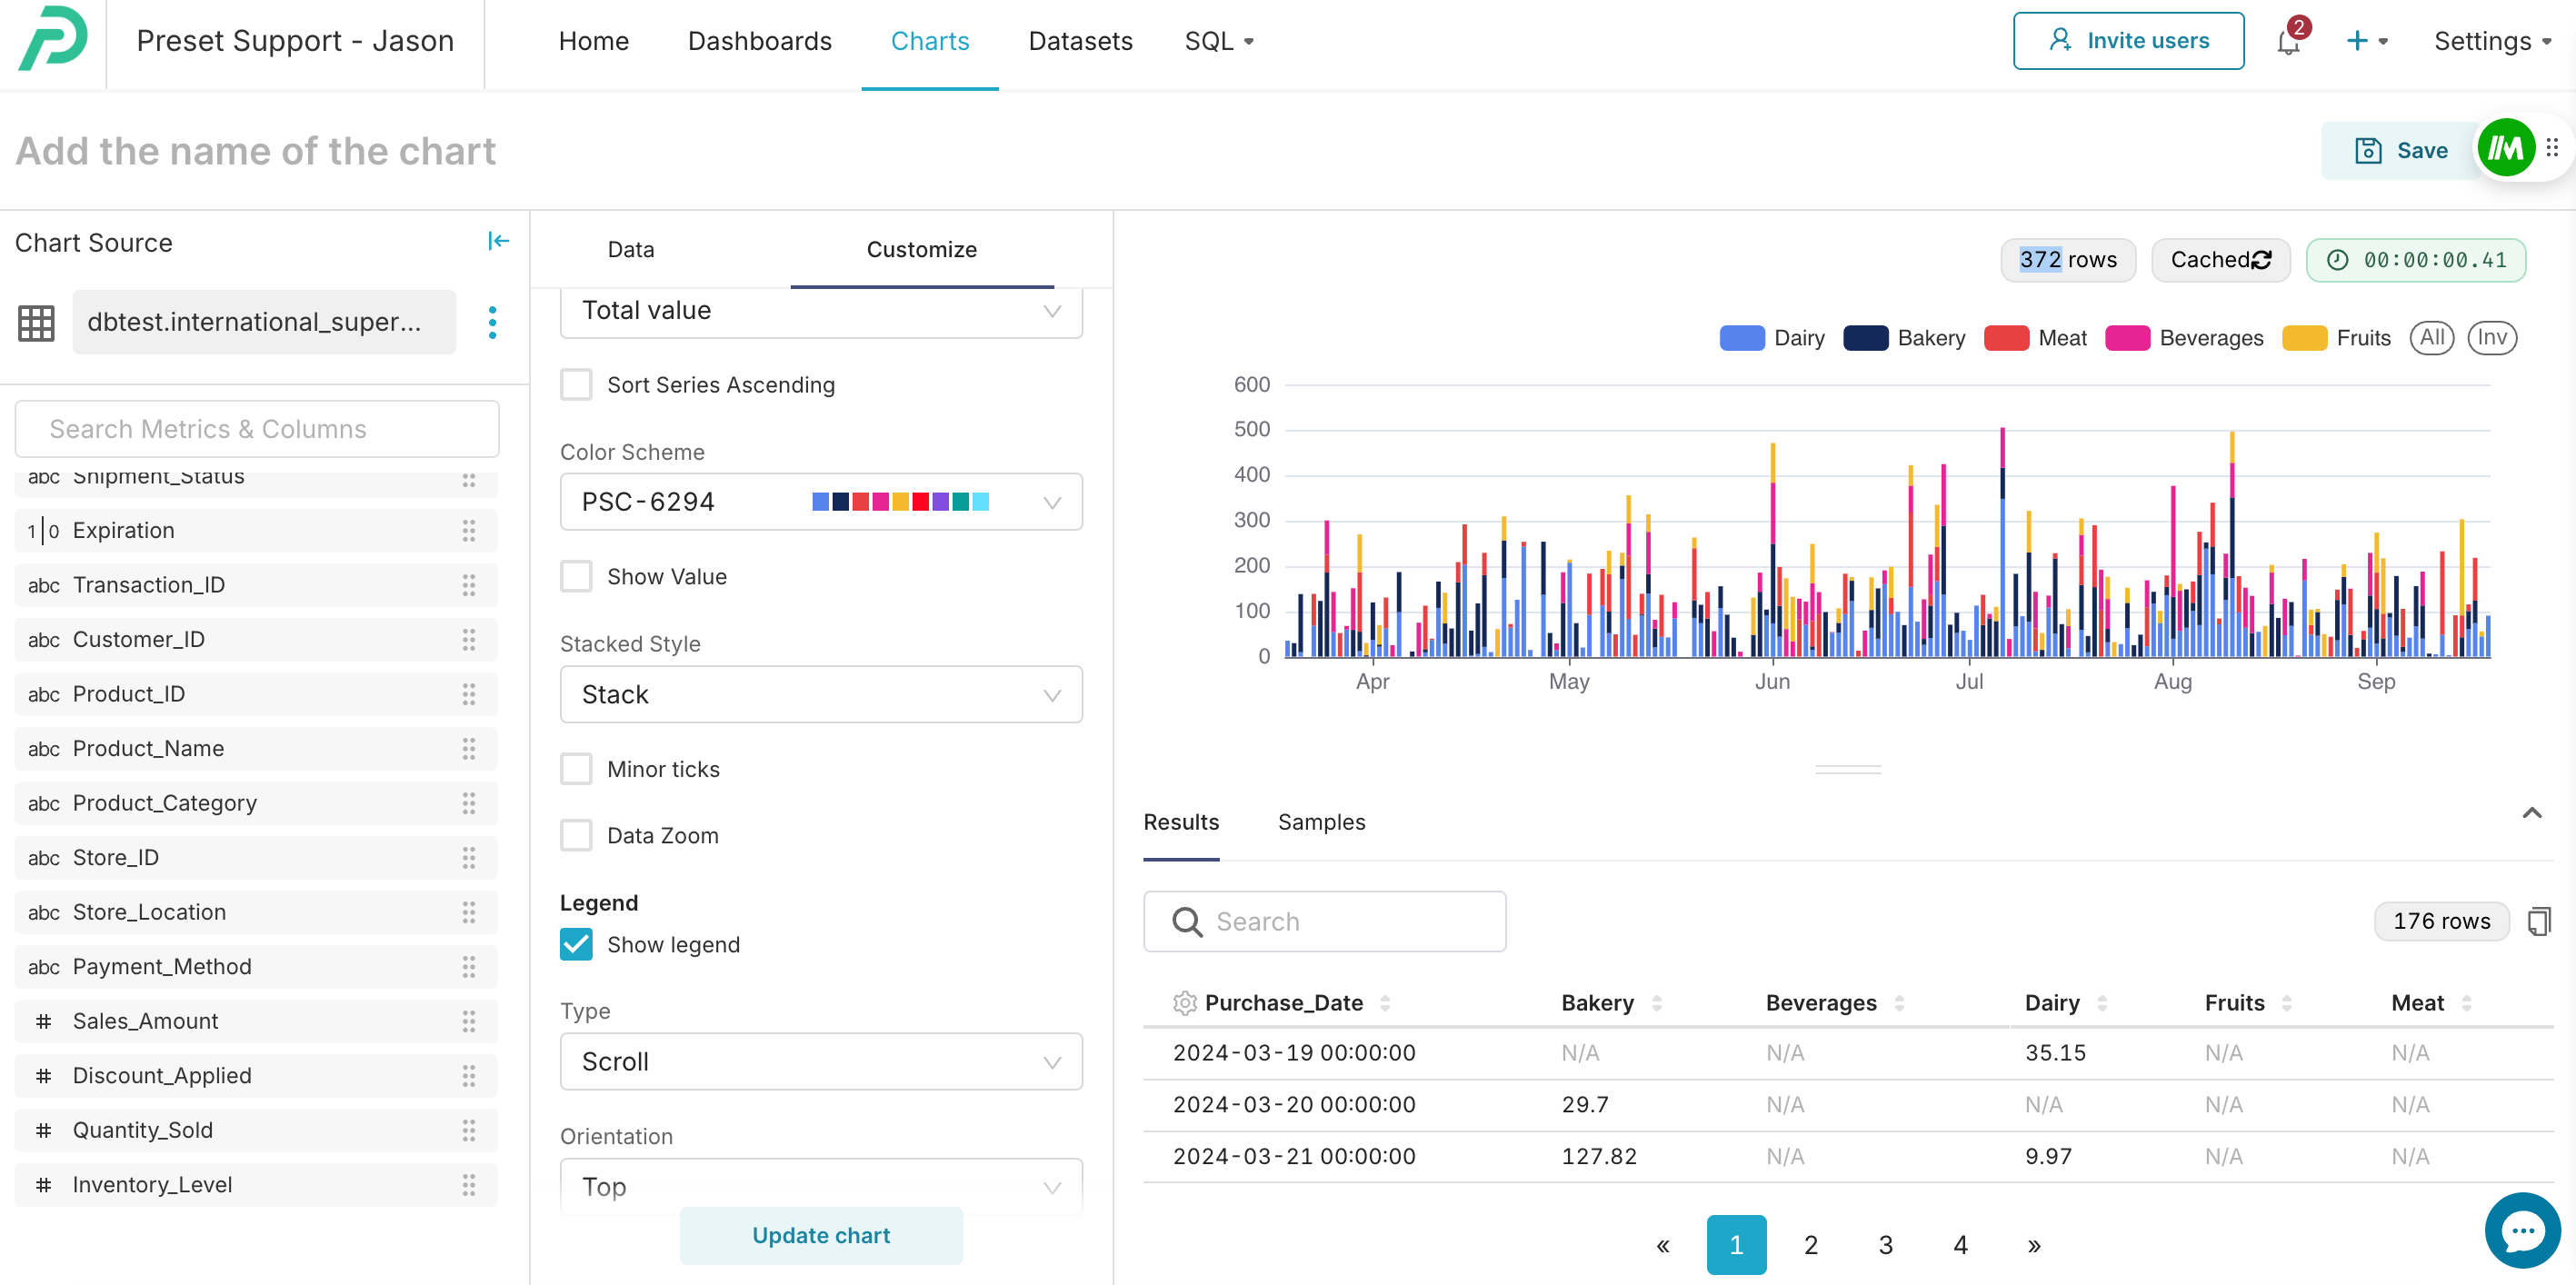
You will see your bar chart stacking the different categories in just one bar for each period:
Advanced Analytics
As with most visualizations in Preset, the Bar Chart supports Advanced Analytics features like: