Animated Walkthrough
Time Comparison is only available when using a time column as your x axis.
Overview
Time Comparison advanced analytics are used to compare data points from a date on the x-axis with a specified Time Shift.
Time Shift
It compares the same series of data with a time shift.
Default options include:
- 1 day ago
- 1 week ago
- 28 days ago
- 30 days ago
- 52 weeks ago
- 1 year ago
- 104 weeks ago
- 2 years ago
- 156 weeks ago
- 3 years ago
Preset will also recognize other expressions, such as "4 weeks ago" or "8 years ago". You can have up to 10 of these time comparisons at one time.
In addition to past calculations you can also use this to do comparison to future time periods by using "later", for example "1 day later" or "4 years later". This can be helpful if you are looking at past data and want to analyze how it compares to more recent data.
Calculated Type
Represent the time series using one of the following options:
- Actual Values: Displays two time series — the value of the x-axis (based on a Metric or Rolling Window) and a series that represents the real value for the selected time shift.
- Absolute Difference: Displays one time series that represents the difference between the actual value (Metric or Rolling Window) and the value of shifted time.
- Percentage Change: Displays one time series that represents the percentile difference between the actual value (Metric or Rolling Window) and the last shift value.
- Ratio: Shows one time series that represents the difference between actual value (Metric or Rolling Window) and the value of shifted time (i.e., ratio of metric value for period time vs. the time-shifted value).
Actual Values Example
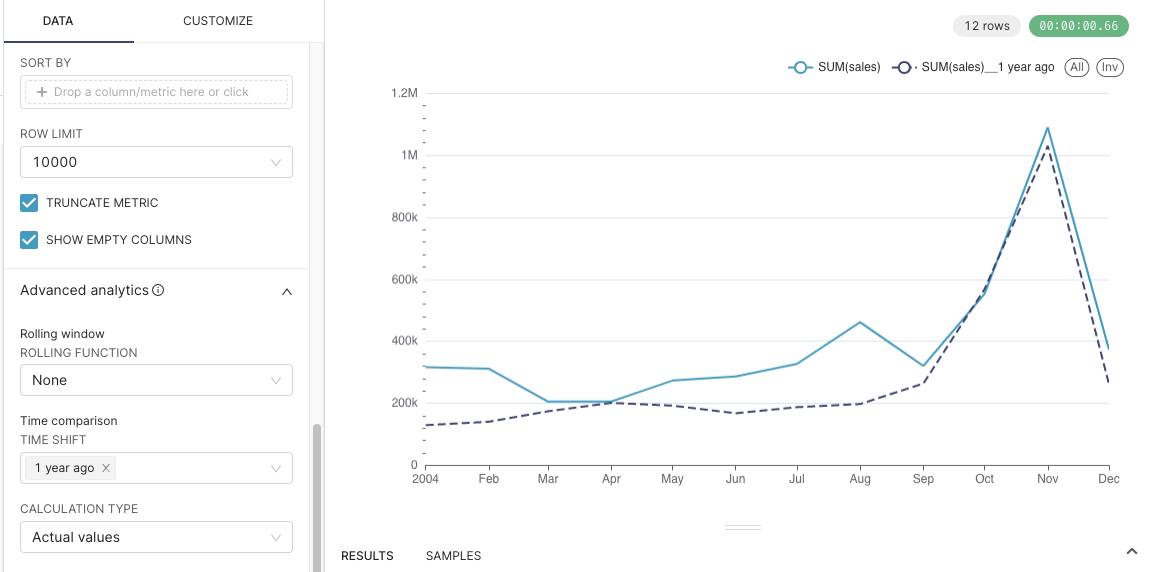
When Actual Values are used, a second dotted line will be added, this represents the actual value of the metric(s) for the selected time period to the date of the previous time shift.
In this example we're using the Vehicle Sales example dataset, with the Order Date as the x-axis, a time grain of Week and using the metric Sum(sales). The time shift period is 1 year, so the dotted line represents the metrics for 1 year previous to the date listed in the x-axis. For example, the sum of sales in September of 2004 was $321k — 1 year earlier, in September 2003, the sum of sales was $264k.
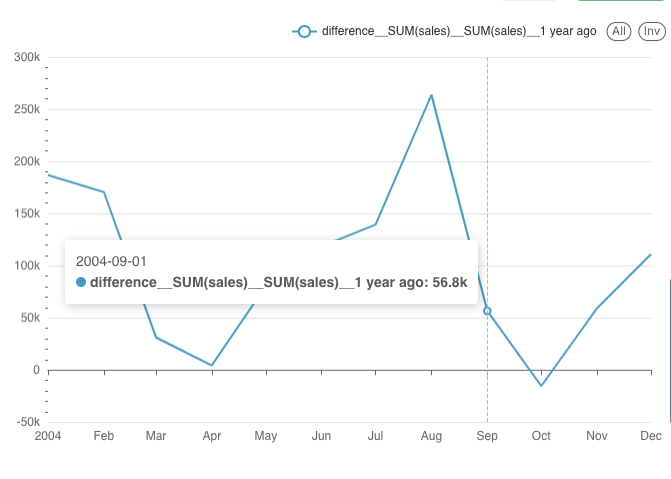
Absolute Difference Example
Absolute Difference shows the difference between the dates on the x-axis vs. the specified time shift period. Using the same example chart set up as above. We can see that the difference in the sum of sales between September 2004 and September 2003 was $56.8k, showing that year over year our sales have improved in September.
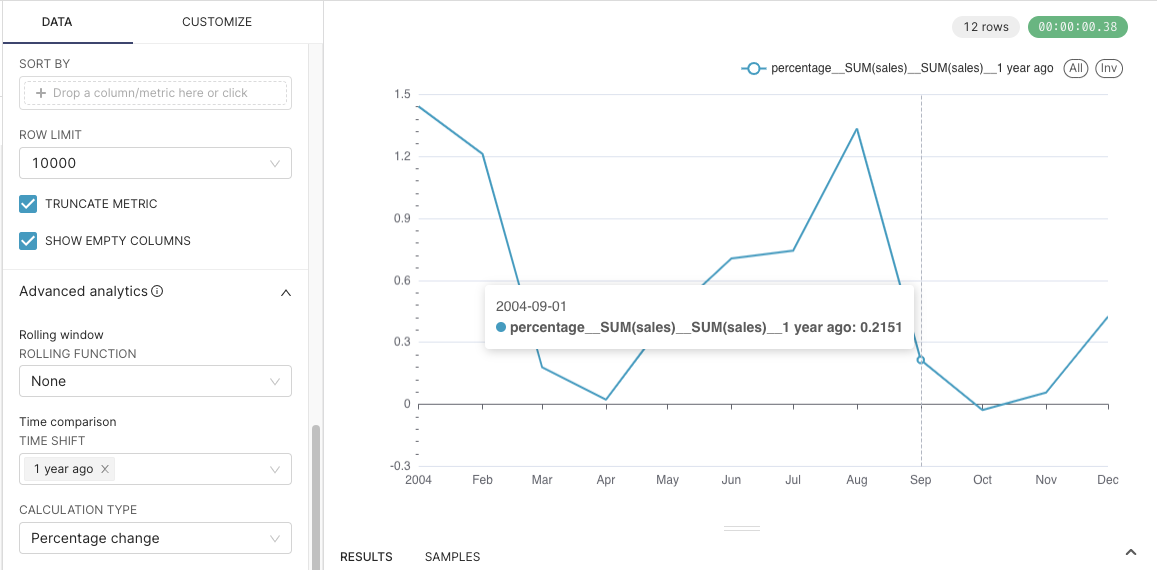
Percentage Change Example
As the name specifies, this option shows the percentage change in a specified time shift period. Continuing from the above example, when we change the calculation type to "Percentage Change" we can see that in 2004 we are +21% in sales Year Over Year.
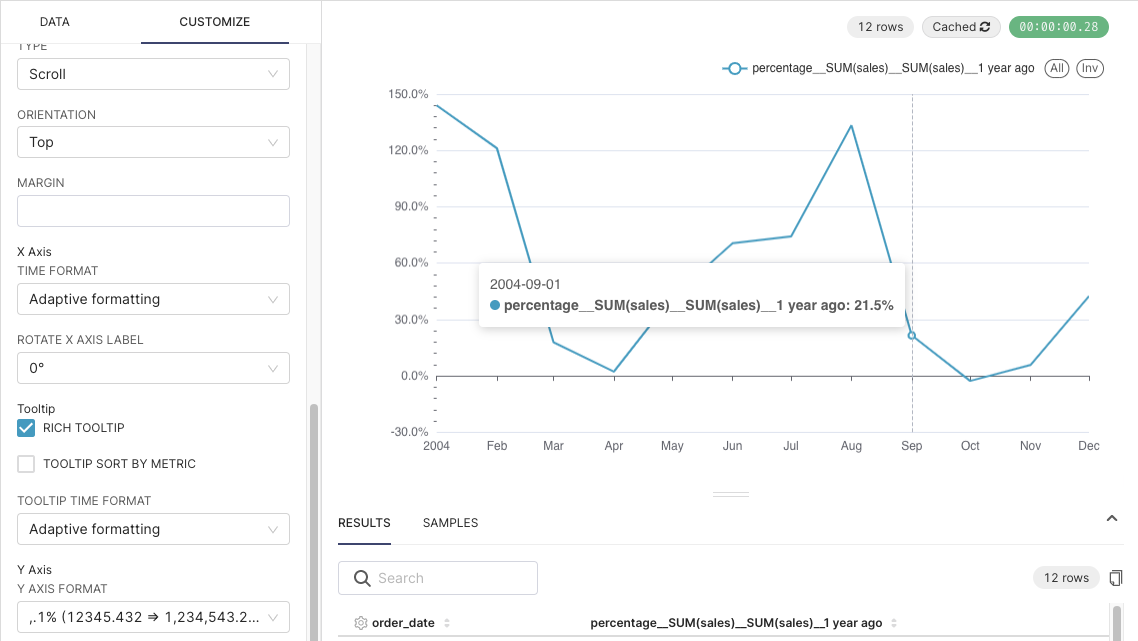
Changing Y-axis Formatting for Percentage
If you would like the format to explicitly be a percentage, you can update the Y-axis formatting in the "Customize" tab. In this example we're using the formatting ,.1%.
Ratio Example
Ratio Example shows the difference between time periods. In this example we can see that the ratio of the sum of sales for September 2004 to the sum of sales for September 2003 is 1.22. We can confirm this by looking at our numbers from the Actual Values example ( $321k / $264k = 1.22 ).
.png)
Common Error Messages
Error: An enclosed time range (both start and end) must be specified when using a Time Comparison.
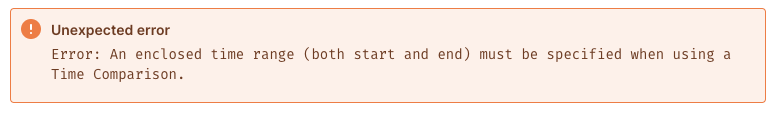 This is the most common error experienced when using time comparison. This error may also occur if your time range filter is set to -∞ to ∞ or if the X-axis is not a time or date-time data type.
To resolve this error:
- Confirm that you are using a time column as your X-axis
- Set an enclosed time range: go to the Data tab to the Filters section and select a time range for the time column being used for the X-axis
- This enclosed time range can be relative (3 weeks ago, today, yesterday etc) or absolute (2003, June 3rd 2022, etc)