Overview
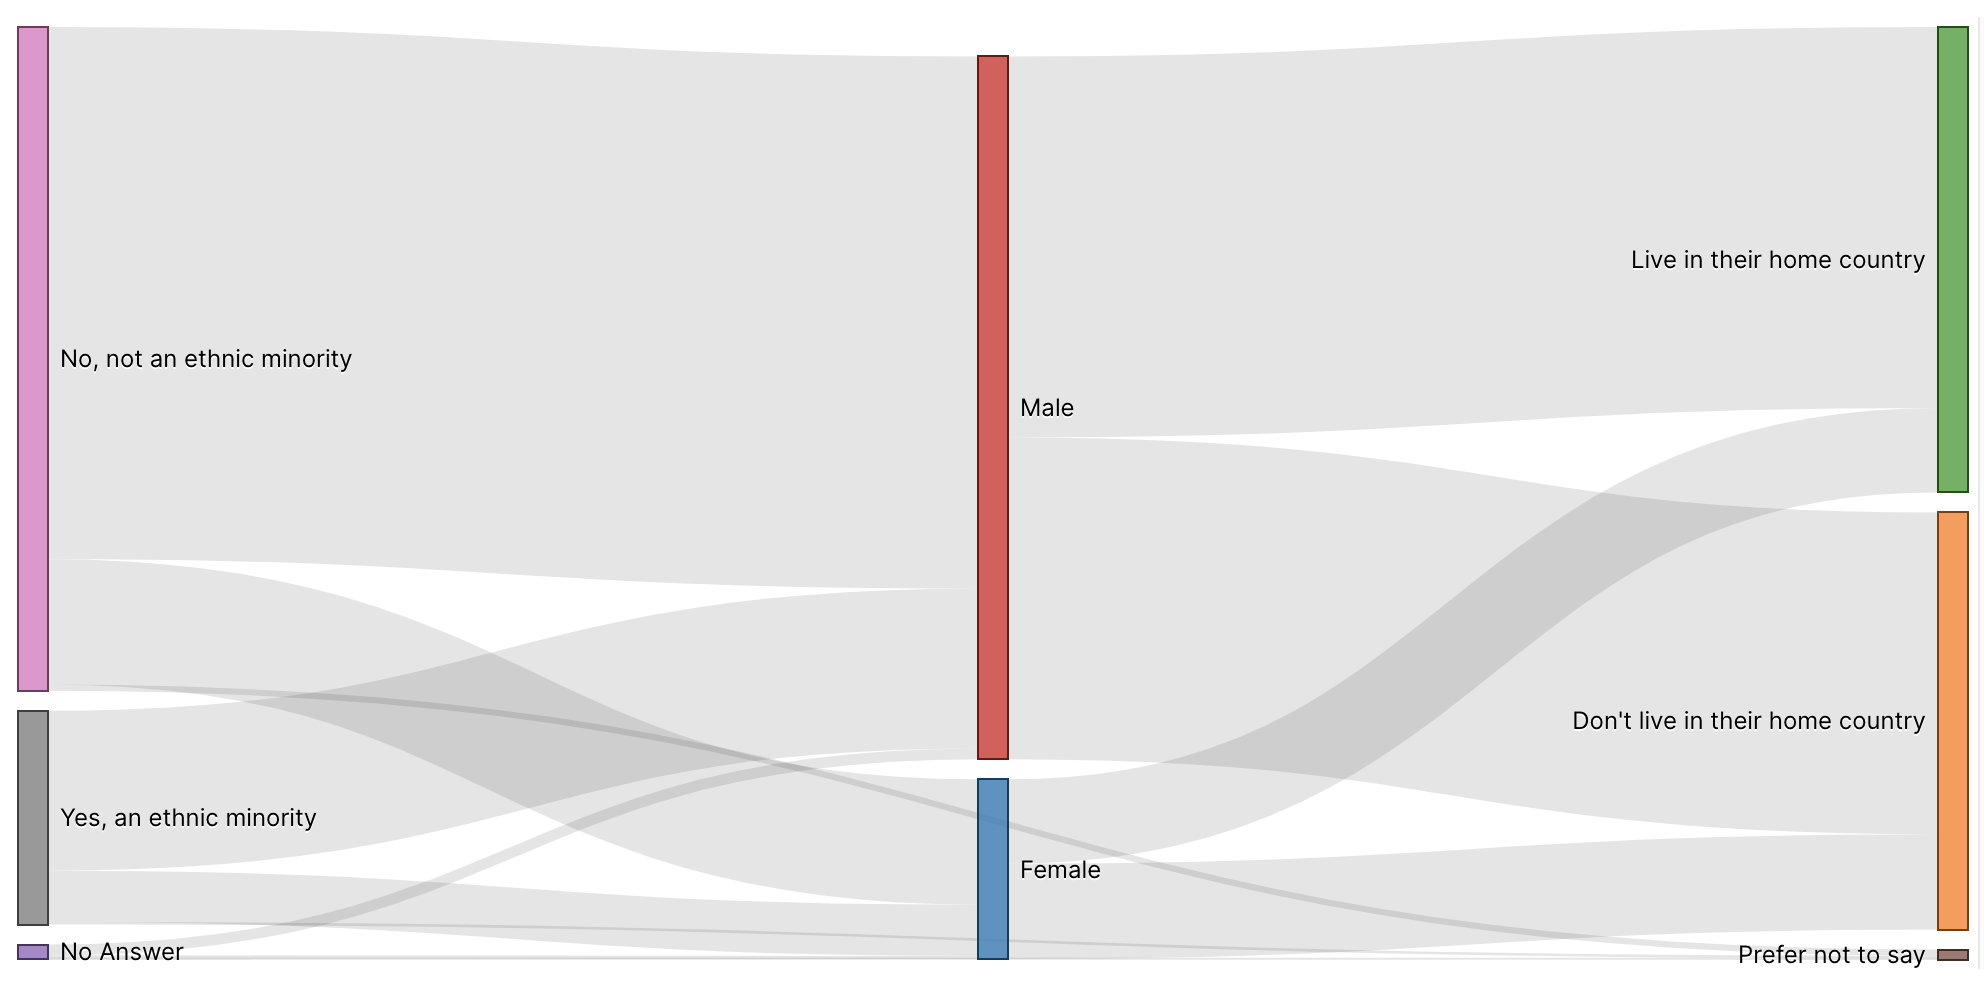
A Sankey diagram is a popular flow diagram that conveys the relative size of metric data based on the size of flow lines from a source to a target. Here is an example:
Reference Content
The following articles may be useful resources as you build your chart:
- Creating a Chart: A walkthrough of the overall process of chart selection and creation.
- Using Preset Chart Builder: How to work with the Chart Builder page, the primary interface used when creating a chart.
Creating a Sankey Diagram
Similar to a tree chart, a Sankey diagram uses nodes (represented visually as rectangles), edges (represented visually as flows), and hierarchy (left to right). Unlike a tree chart, the emphasis is on the flow between nodes instead of the hierarchy itself. The hierarchy represents stages in a system flow.
Shape of your Data
Structuring your data in the right shape is crucial for building effective Sankey diagrams. Let's zoom into a specific example of how a row in the dataset maps to a node-edge-node pair in the diagram.
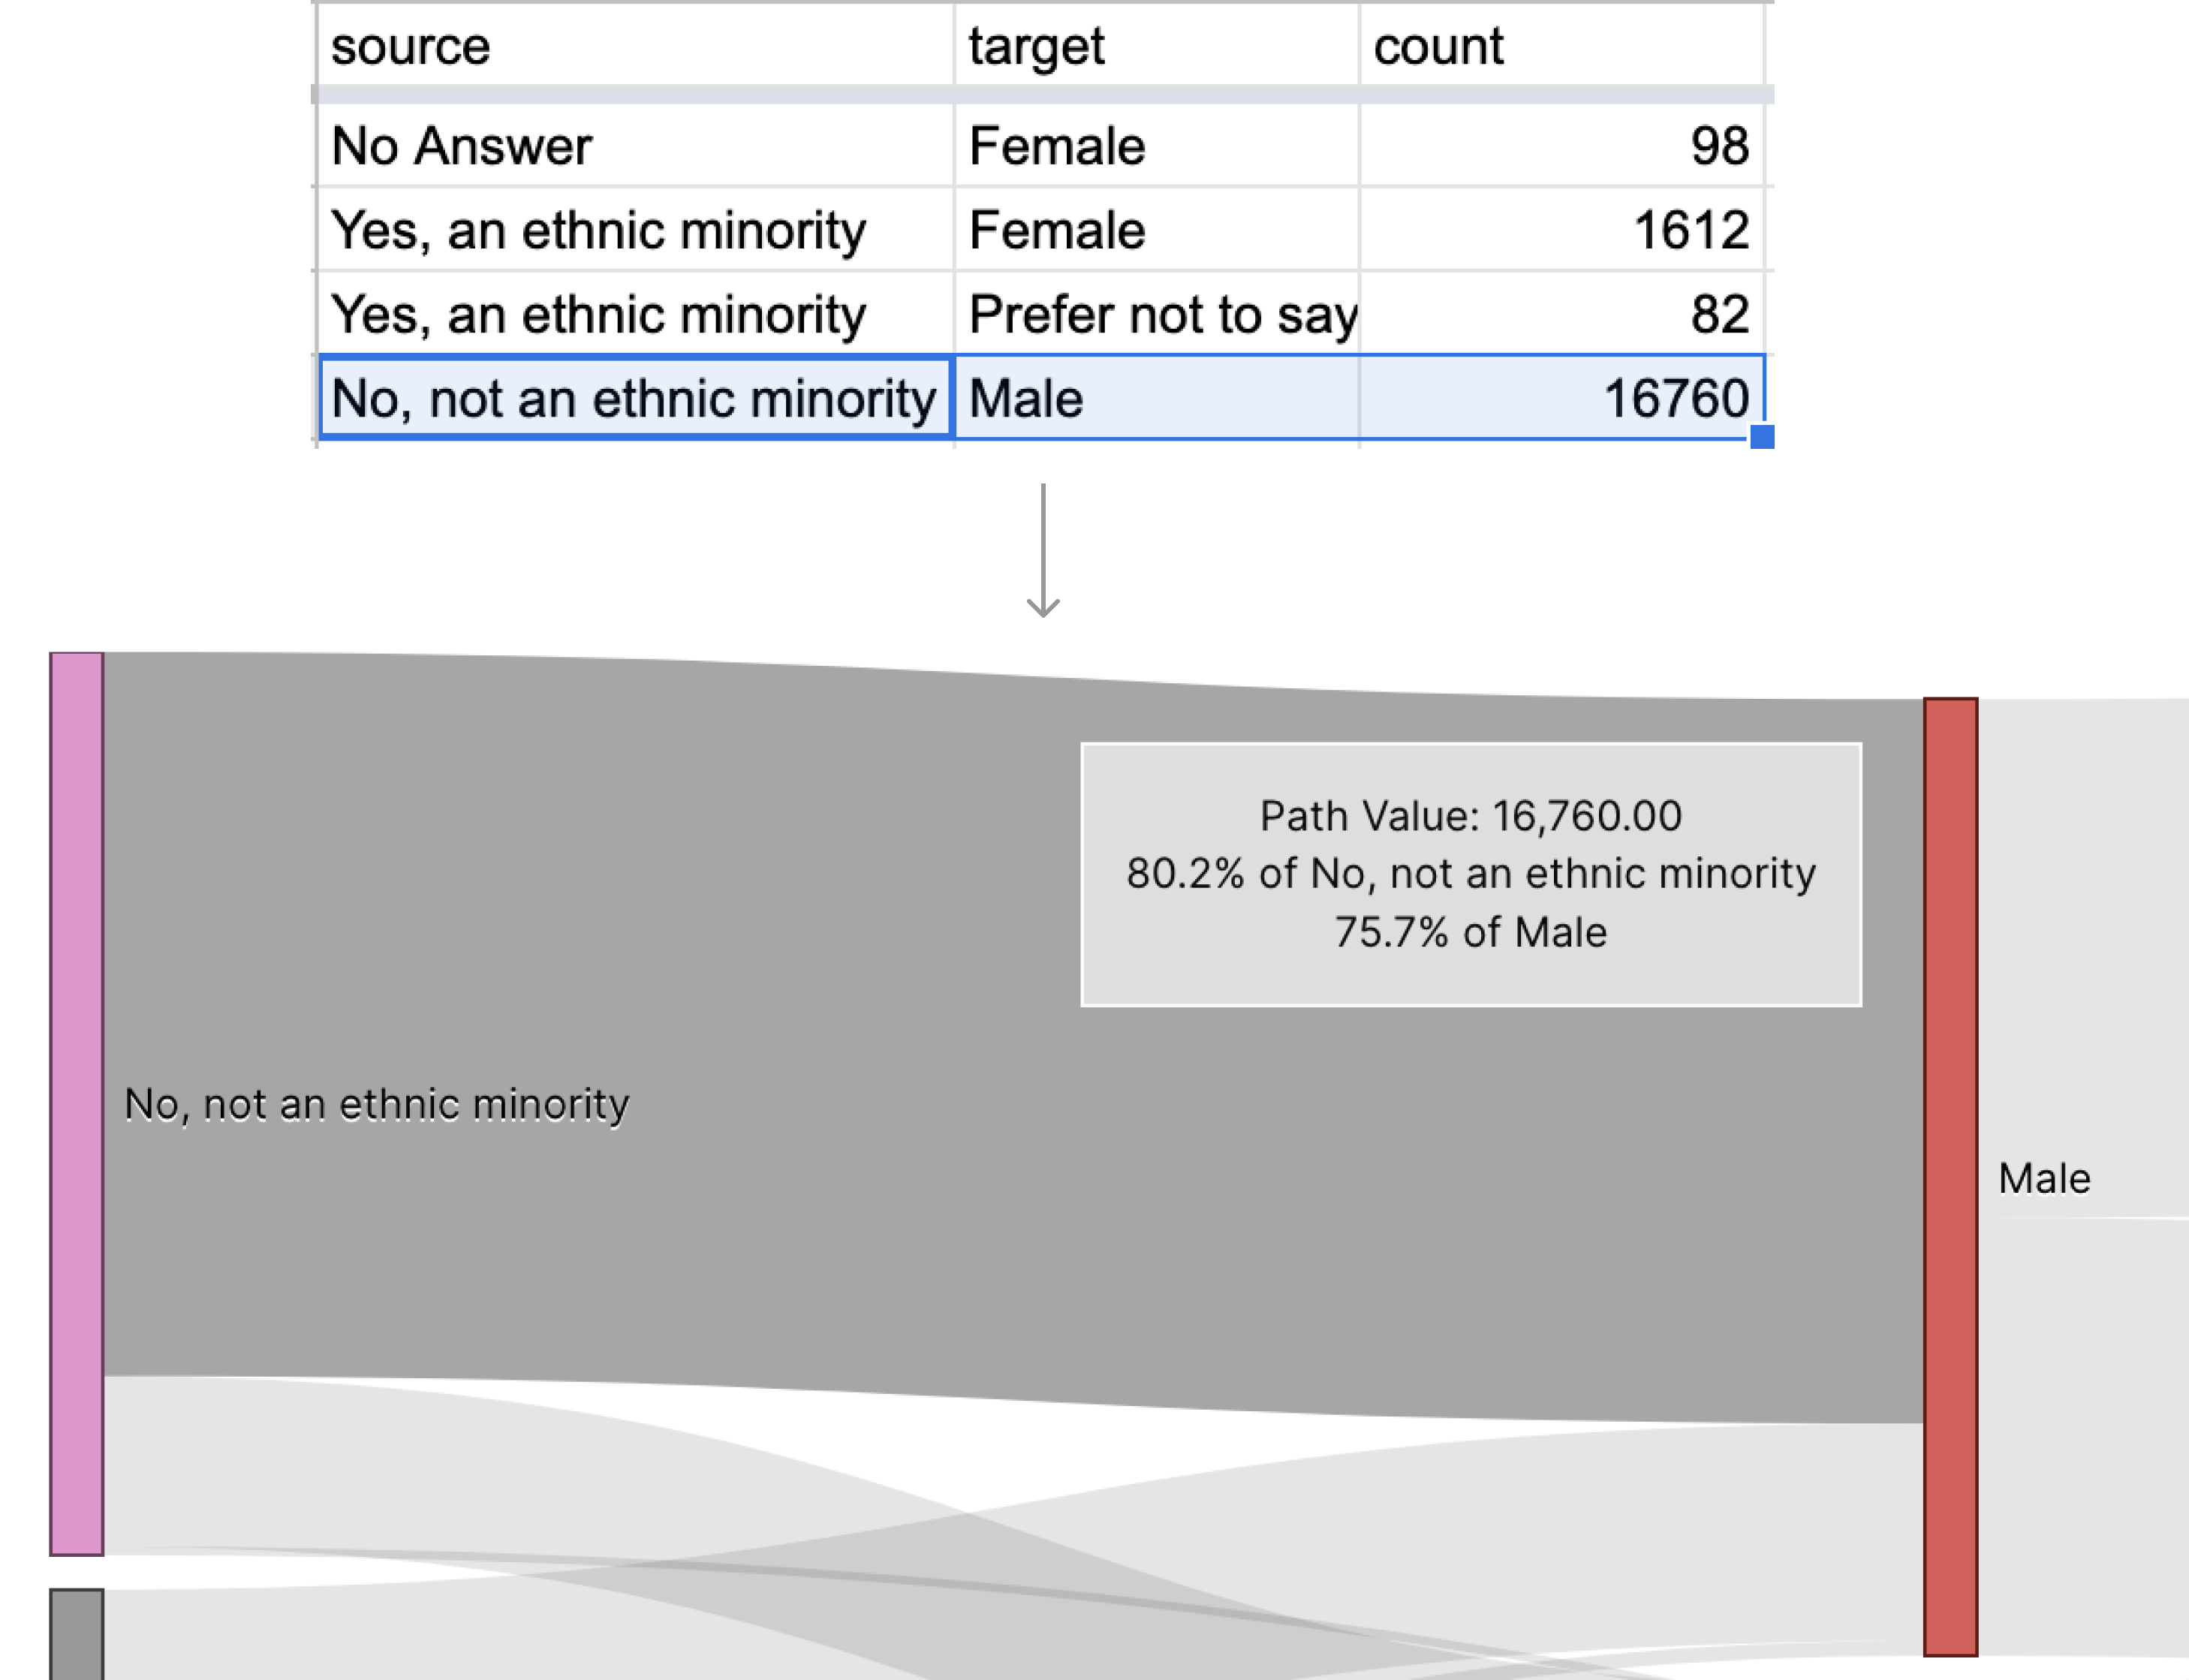 |
|
To scale this approach up and build a full Sankey diagram, Preset uses your data to calculate all of the source-target pairs and then orders them from left to right when generating the visualization. Which nodes go in the left-most column (or first layer of nodes) then? The unique values in the source column that aren't in the target column (or receive flow) end up in the first layer.
Here's the full example:
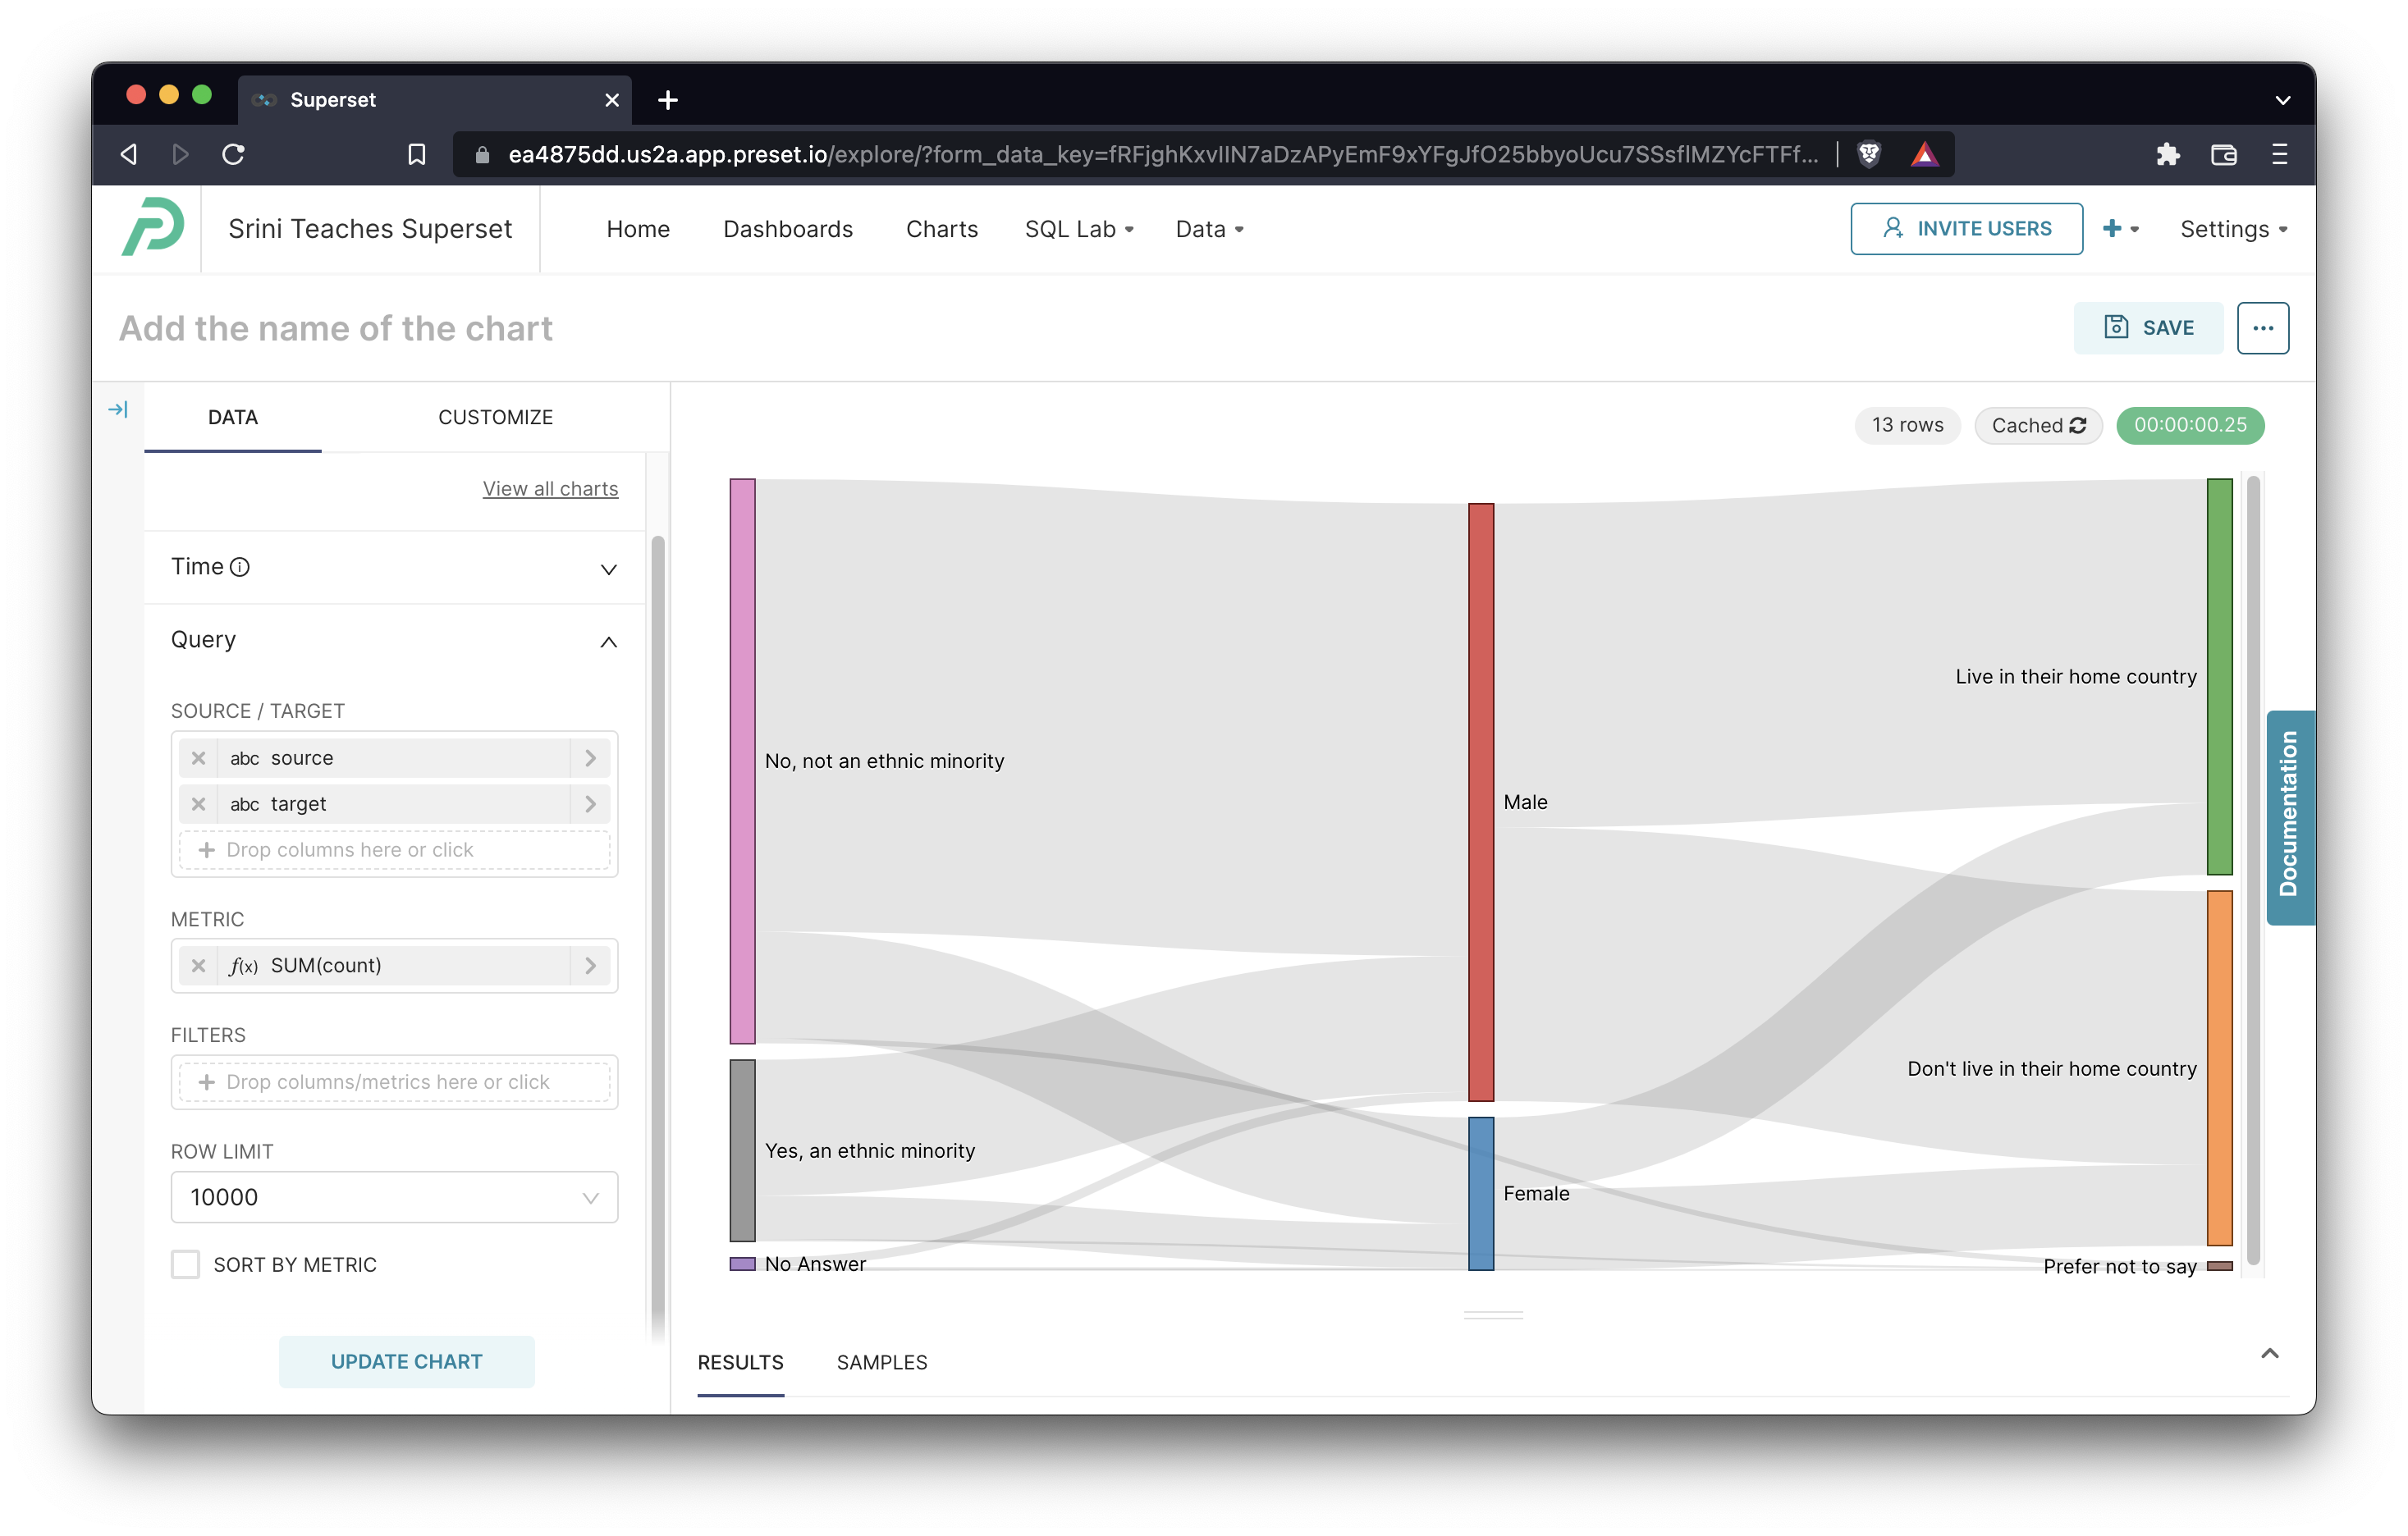
Now we'll walkthrough the options we selected in Chart Builder and how the data was transformed:
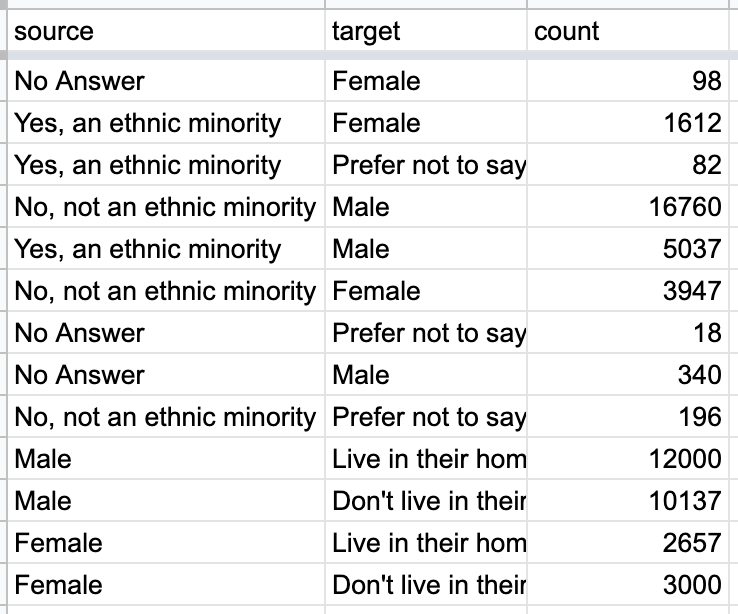 | Underlying Data
|
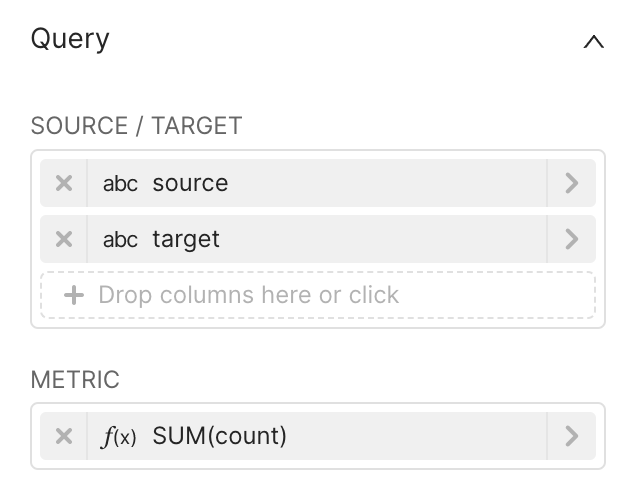 | Chart Builder Options
|
Here's the query that was generated:
SELECT source AS source,
                 target AS target,
                 sum(count) AS "SUM(count)"
FROM main."Example: Sankey"
GROUP BY source,
         target