Rolling Functions
Rolling window functions allow you to create visualizations which are "summaries" of your data. For example, applying a mean rolling function to your dataset of individual sales allows you to see trends in how your sales are performing over a set rolling window, for example, 7 days.
In instances when there is a lot of data variability, a rolling function will enable you to use a statistical value to represent the underlying values.
Note: Rolling functions can only be used when the x-axis is set to a time or date-time column, as opposed to categorical.
Setting up a Rolling Function
- Start by expanding the drop down for Advanced Analytics
- Specify the Rolling Function you'd like to apply.
- Mean: The average of the values within the specified window.
- Sum: The sum of the values within the specified window.
- Std: This means Standard Deviation, which represents the dispersion of the data relative to its mean for the window.
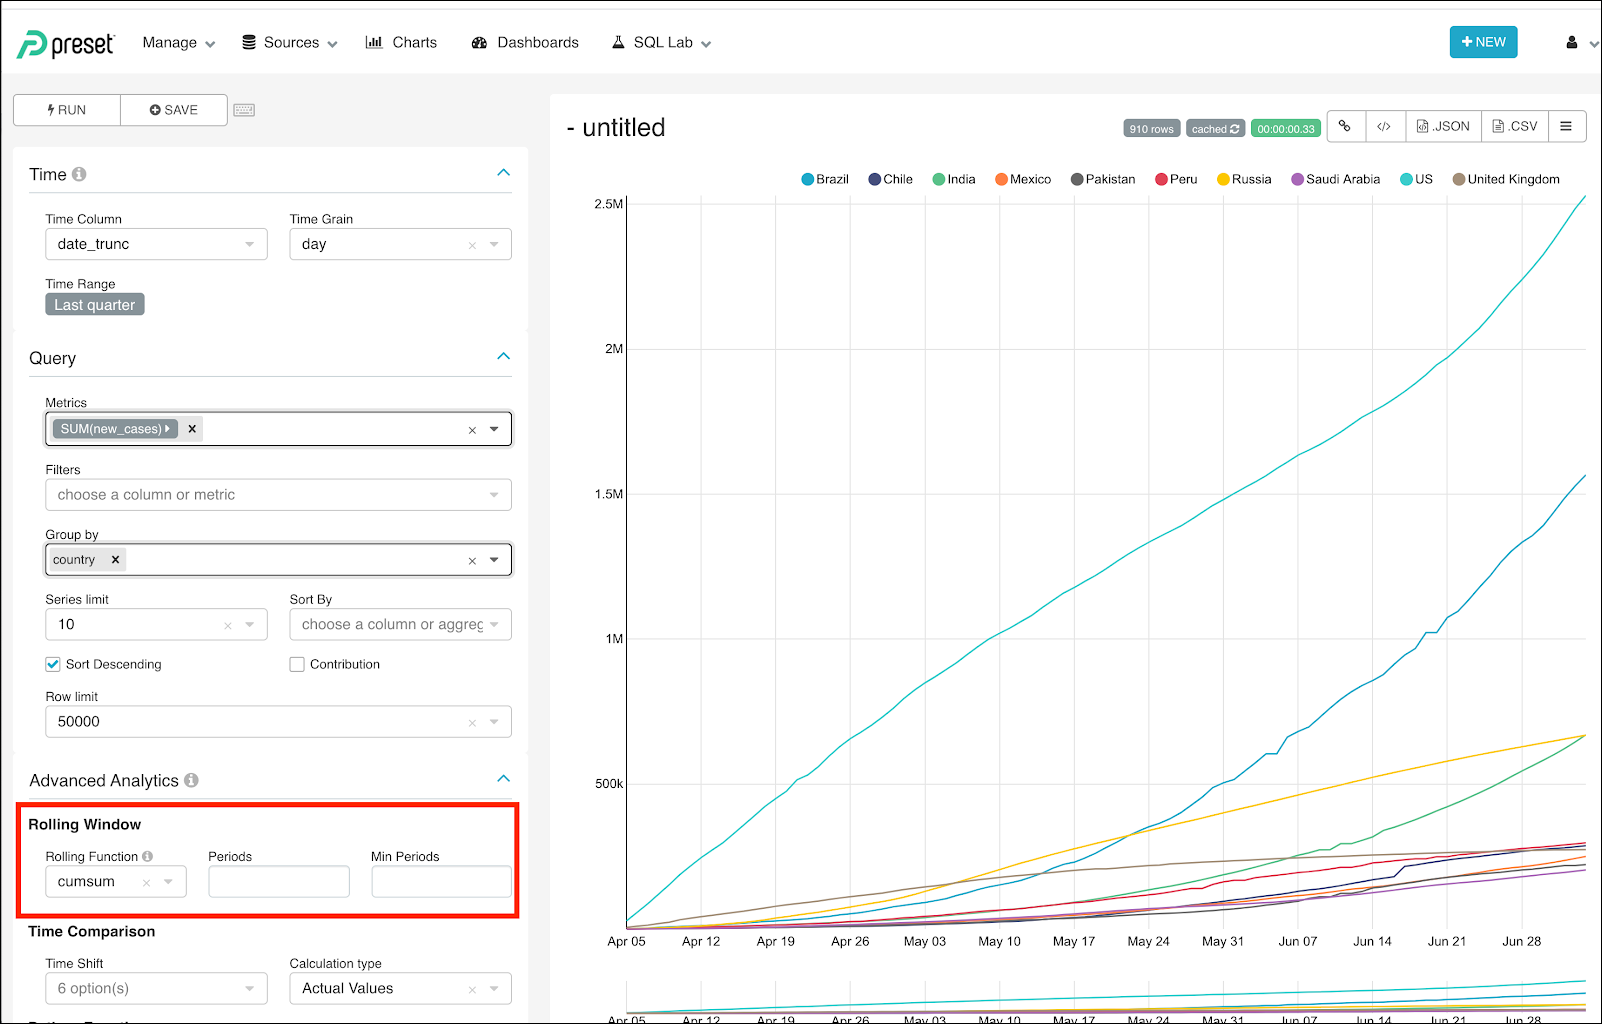
- CumSum : This means Cumulative Sum, which shows the cumulative data — it does not require period or min period values as it will calculate in a growing window.
- Specify the number of Periods the function will take into account when calculating the rolling window
- Periods is the number of time intervals which will be used by the rolling function. The time interval that is used for the period is the length of the Time Grain selected in the Time dropdown.
- For example, if "days" is selected with a setting of 7 for "Periods", then the function will be based on 7 days.
- Specify the Min Periods which should be taken into account when calculating the data point. Tip: this should be identical to Periods to ensure that every data point is calculated with the same window size.
Example
In this example, we are using the Vehicle Sales dataset and asking the question: "How is the sum of daily sales changing relative to the last 7 days of sales?" We have order date as our x-axis and the metric we are plotting is the sum(sales).
Since our Time grain is set to Day when, we specify our Periods as 7 we are saying "Take the last 7 days of data and apply the specified function to them to create a new data point."
Rolling Functions
Rolling Function Options:
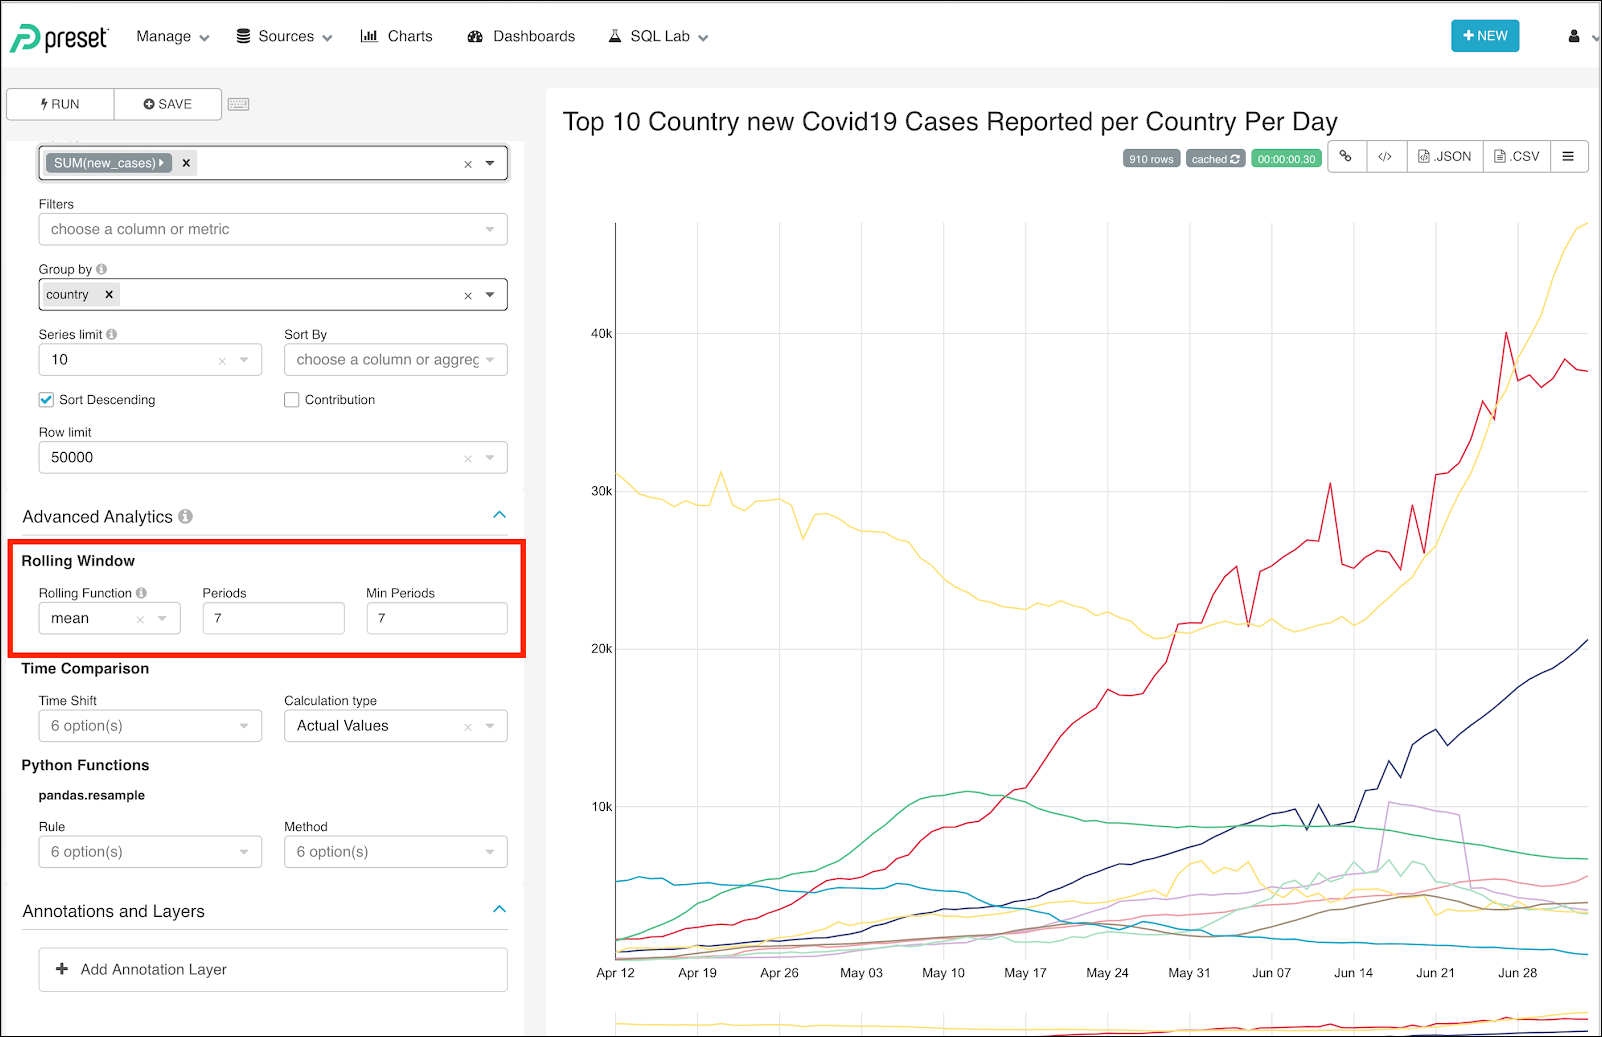
- Mean: The average of the values within the specified window.
- Sum: The sum of the values within the specified window.
- Std: This means Standard Deviation, which represents the dispersion of the data relative to its mean for the window.
- CumSum : This means Cumulative Sum, which shows the cumulative data — it does not require period or min period values as it will calculate in a growing window.
Example
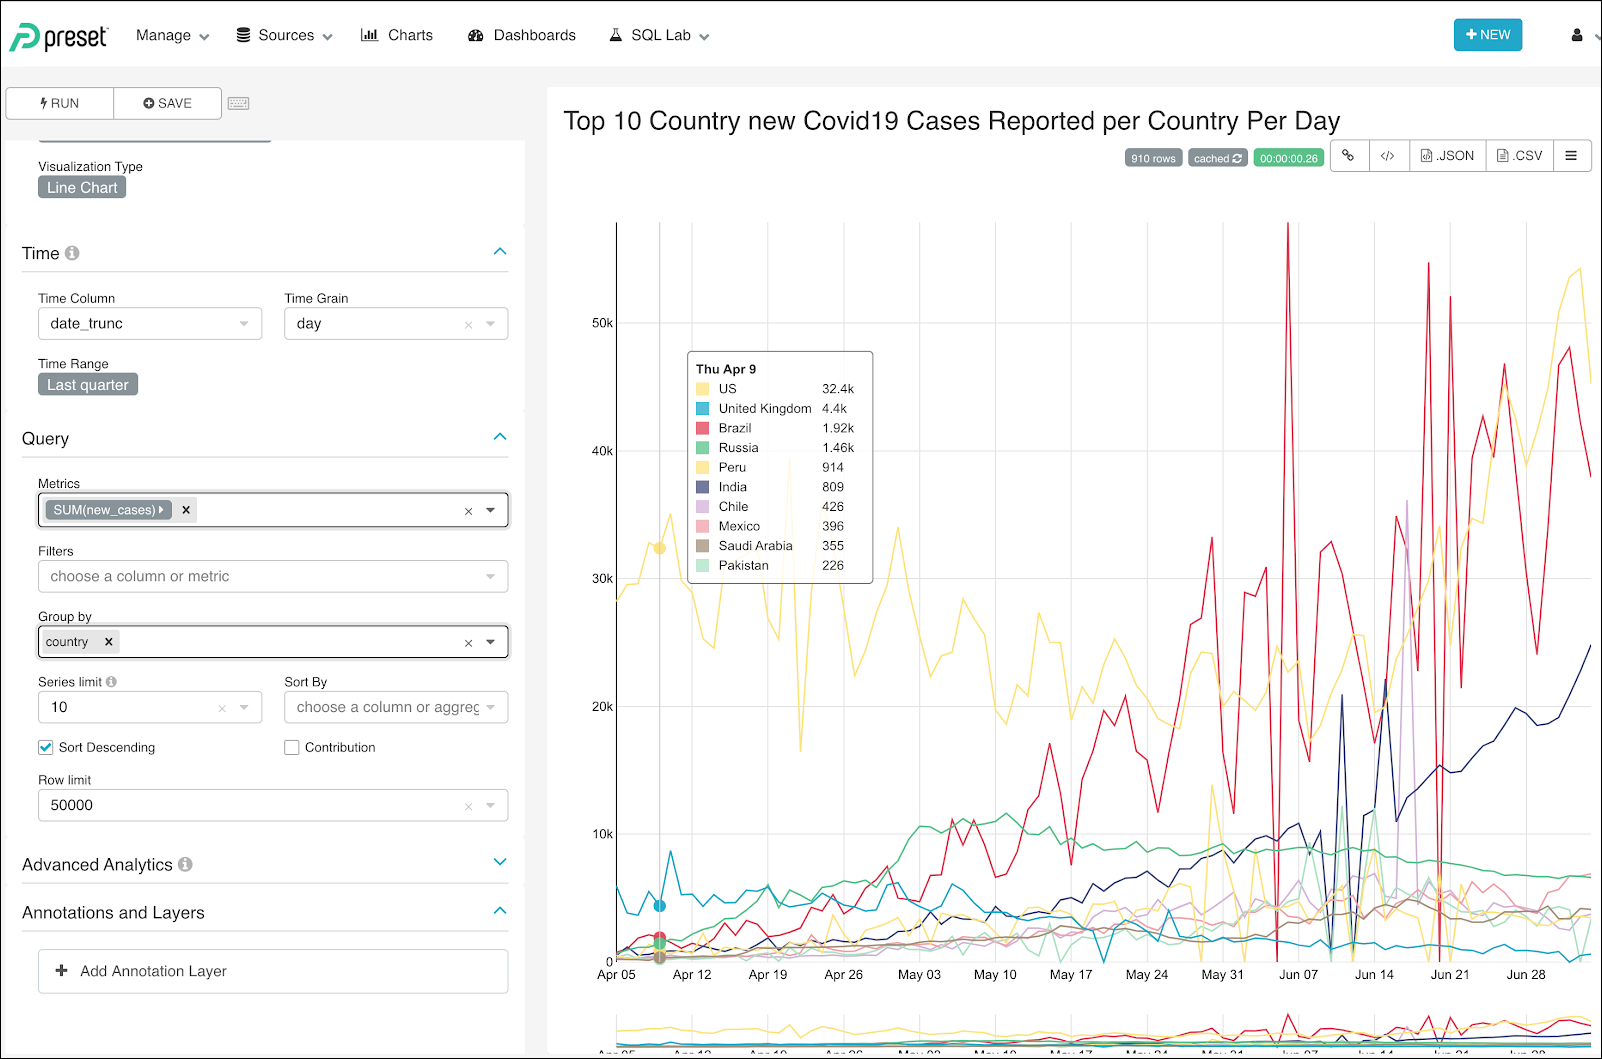
This case represents the number of new cases reported per day per country for the top 10 countries. New cases per day fluctuate day-by-day and, consequently, it is very difficult to see trends.
Rolling functions support a better representation of data by representing the moving average in a 10-day period. This facilitates the easier identification of trends.
Cumulative Data Over a Period of Time
With rolling windows, it is also possible to look at cumulative data over time.