Overview
When you are explore your data using SQL Lab its quick and easy to create a chart, even before saving your query as a dataset. In this page, we'll be going through how to create a chart directly from a SQL query and then save that query as a virtual dataset.
Process Overview
.gif)
Starting From SQL Lab
- Begin by going to SQL Lab from the header menu by hovering over the dropdown labeled SQL and selecting SQL Lab.
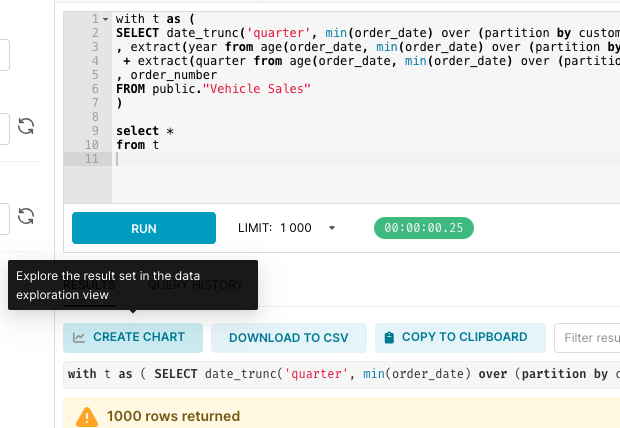
- From this interface, select your database and schema, then write your SQL query.
- Run your SQL query by selecting the blue "Run" button
- Under the Results tab, below the editor, select "Create Chart". This will open a new browser tab with the Chart Builder interface. Note that the "Chart Source" is listed as SQL and shows the query you created.
- Create your chart -- check out our Create a Chart guide or Chart Walkthroughs for more information on building your chart.
- Once you are happy with your chart and are satisfied with your query, it's time to save your chart and make your query into a dataset.
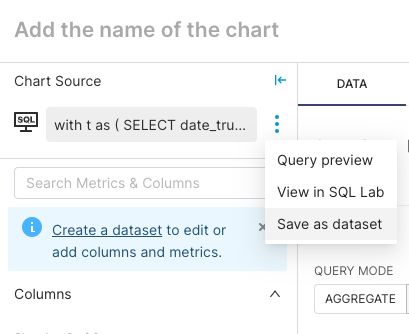
- Click on the light blue "Save As" button in the top right hand side of the Chart Builder.
- Fill out the prompt with the chart name and dataset name and click "Save".
- In the chart builder, you will now see that the chart source is the dataset that you created.
Now you are able to re-use this query as a virtual dataset to power more charts.