Overview
This page provides more context around managing and troubleshooting Alerts & Reports.
Managing Alerts and Reports
How to Edit an Alert or Report
You can edit an alert or report by selecting the Alerts or Reports tab and then hovering your cursor over an alert or report row. Under the Actions header, select the pencil Edit icon.
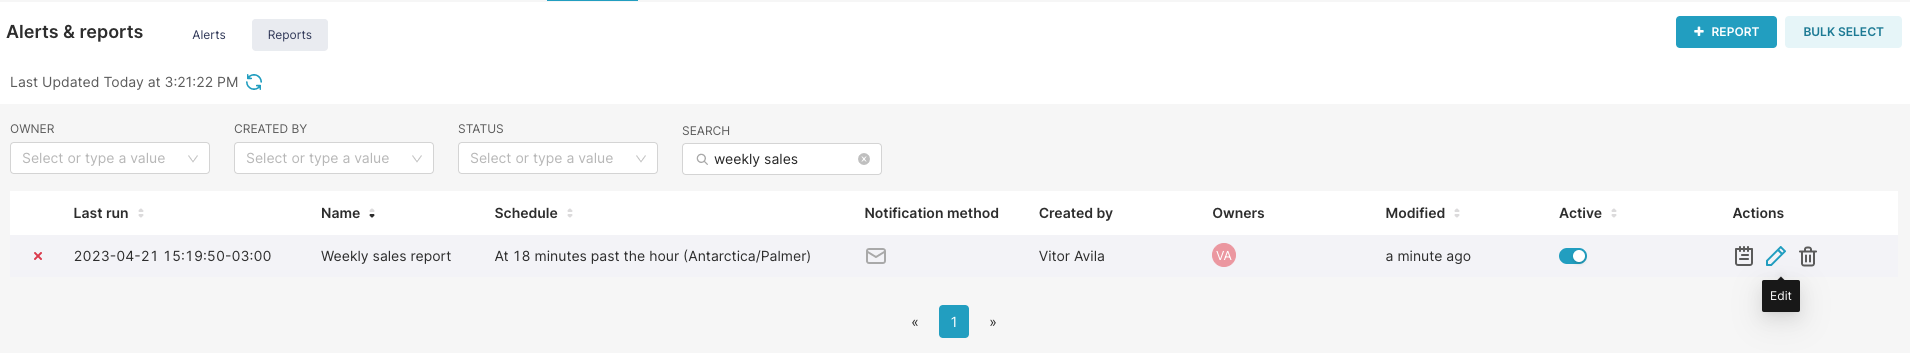
Modify any fields as needed. When done, select Save.
How to Delete an Alert or Report
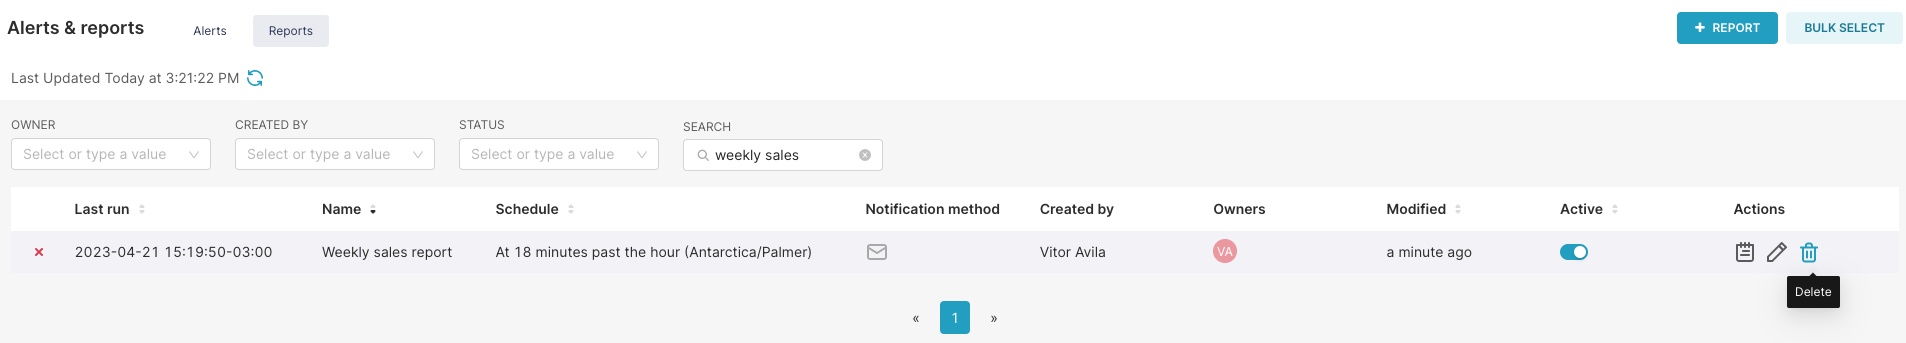
You can delete an alert or report by selecting the Alerts or Reports tab and then hovering your cursor over an alert or report row. Under the Actions header, select the trash bin Delete icon.
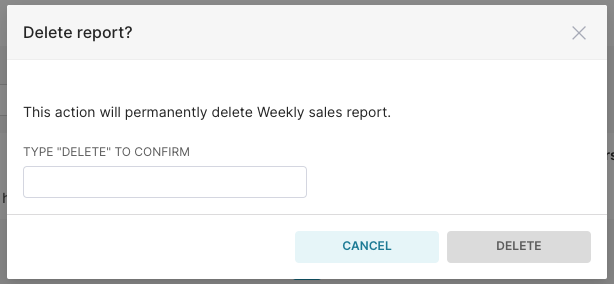
The Delete alert? or Delete report? window appears — type "DELETE" and then select Delete to confirm the deletion.
How to Bulk Delete Alerts or Reports
You can delete multiple alerts or reports easily by using the Bulk Select feature. To do this, navigate to the appropriate screen by selecting the Alerts or Reports tab and then select Bulk Select.
Each alert or report entry will now have a checkbox on the far left of the table. You can select multiple checkboxes to indicate entries for deletion. Alternatively, if you wish to delete all entries, you can select the top checkbox on the header row (as displayed in the graphic below). To delete selected entries, select Delete.
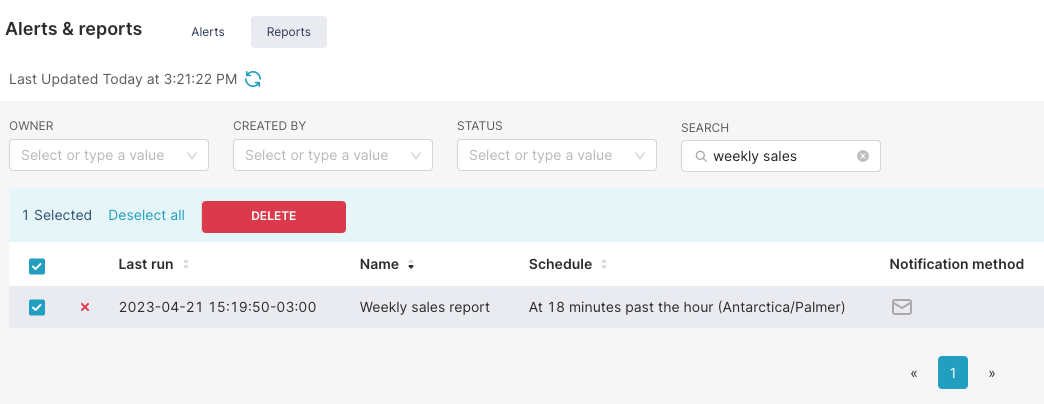
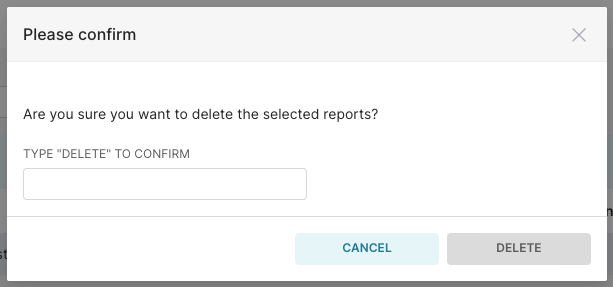
The Please confirm window appears — type "DELETE" and then select Delete to confirm the deletion.
How to Customize the Screenshot Width
You can define the width of the Alerts and Reports Screenshot width. If not defined, the width defaults to the current width specified by Preset.
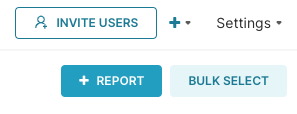
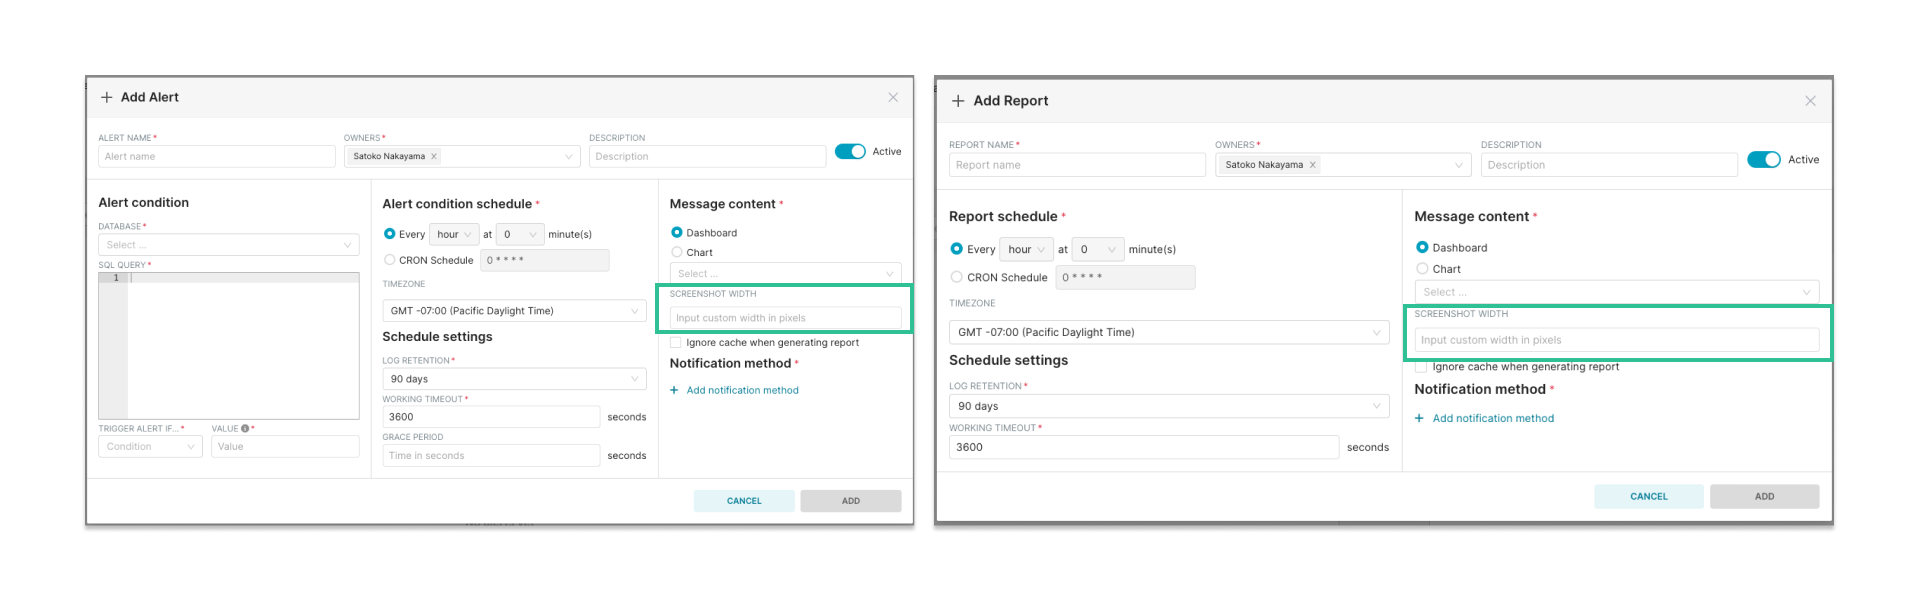
To adjust the screenshot width, click on +Alert or +Report.
.png)
In the "Add report" or "Add alert modal, go to the "Message content" section and enter the desired width in the "Screenshot width" field. The width must be between 600px and 2400 px.
Troubleshooting Alerts & Reports
How to Use the Execution Log to View Errors
The Execution Log is a listing of all individual executions of an alert or report. You can navigate to an execution log by selecting the Alerts or Reports tab and then hovering your cursor over an alert or report row. Under the Actions header, select Execution Log.
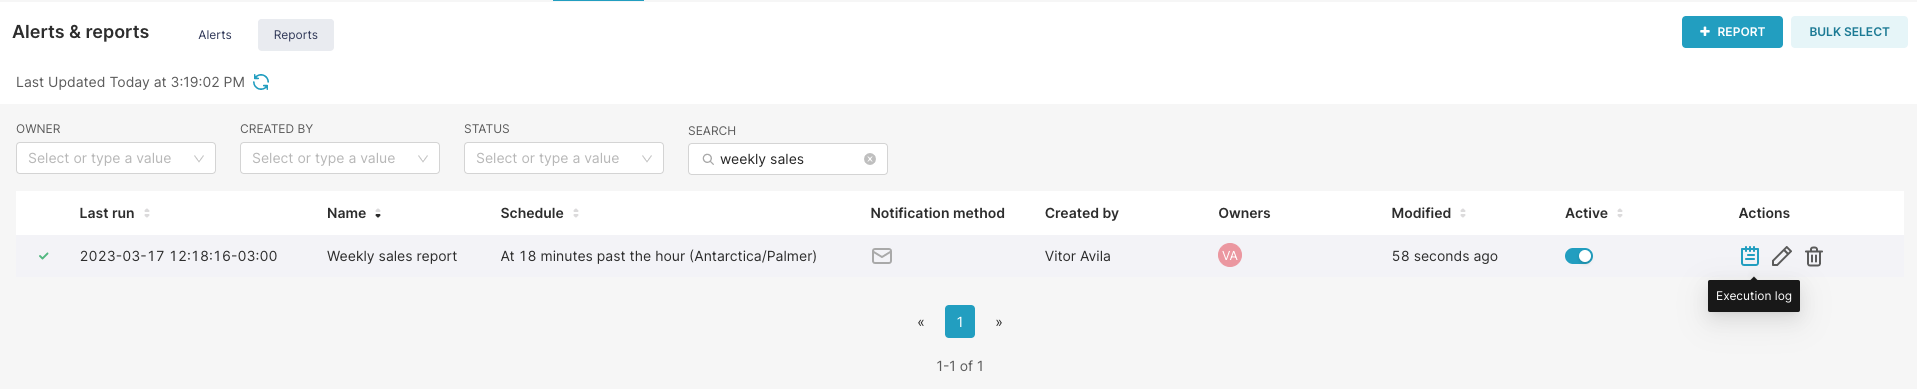
The execution log for the selected alert or report will appear.
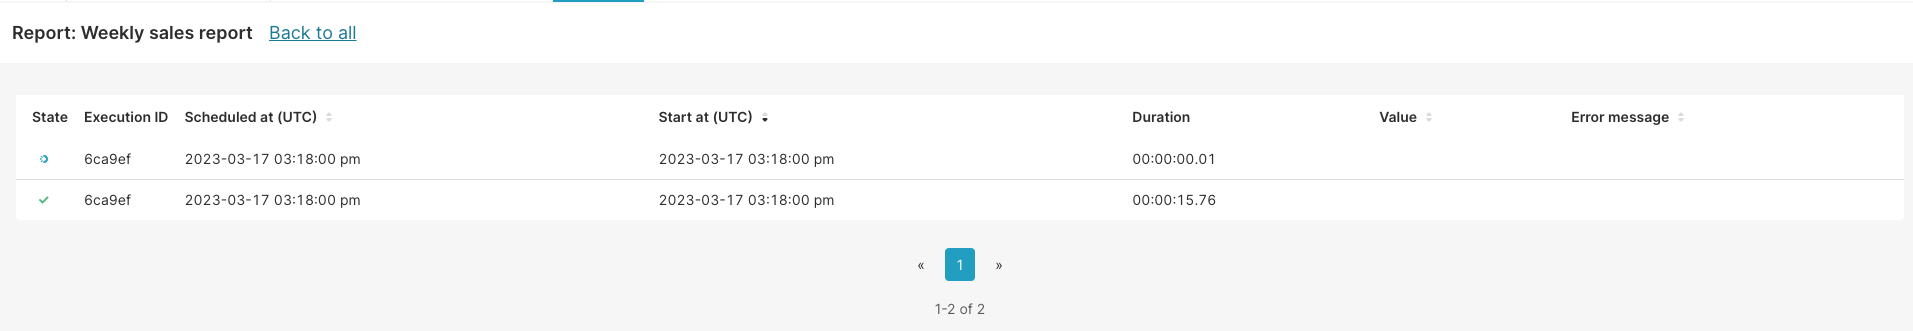
Column headers on this table include:
- State: The state of the operation as indicated by an icon (e.g., Report sending, Report sent).
- Scheduled at: The date & time when the alert or report was scheduled to run (report) or check for a trigger condition (alert).
- Start at: The date & time when the alert or report executed.
- Duration: The length of the execution.
- Value: The value returned from the defined condition (alert).
- Error Message: Any error messages generated from the execution.
Icon Definitions
- Blue circle: "Alert running" -- The alert was actively running or was logged as running.
- Yellow triangle: "Alert Triggered, In Grace Period" or "Alert Triggered, Notification Sent" -- The alert's threshold value was crossed so the alert was triggered. Depending on your grace period set, the alert may have resulted in a notification sent.
- Red cross: "Alert failed" -- The alert was not able to successfully run.
- Green checkmark: "Nothing triggered" -- The alert successfully ran and the threshold value was NOT crossed.
Log Message Definitions
- Report Schedule is still working, refusing to re-compute: An alert/report started it's evaluation but it's last state is "Working" so it refuses to continue. Prevents concurrent alerts and reports if a previous alert query takes more time to complete then the actual cron cycle, queries can start to build up.
- Report Schedule reached a working timeout: An alert/report started its evaluation but its last state is "Working", but it's working for more time then the working timeout value. The current state of the alert is changed to "Nothing triggered" to release the working state.
- Alert fired during grace period: An alert evaluation started but its last state was "Alert Triggered", if this state happened within the grace period. Then it will not continue and log this message.
- Alert query returned more than one row: The alert SQL query must only return 1 row.
- Alert query returned more then one column: The alert SQL query must only return 1 column.
- Alert query returned a non-number value: The alert config validates with numerical comparison but the SQL returned a non numerical value (a string for example).
All the other messages should be errors from invalid SQL queries.
Getting Notified of Alert or Report Errors
If an alert or report fails to be executed, owners of the alert or report will receive a notification via email (regardless of the original notification method) on the error. Recipients of the alerts or reports will not be notified of any errors during execution. Owners can then use the logs to check the error message for resolution.
Troubleshooting Alert issues
Alerts are executed based on a pre-defined schedule, but they are only triggered in case the result of a given SQL query meets a certain criteria. When troubleshooting your report, make sure to:
- Validate that the SQL query works through Preset's SQL Lab. This would help confirming that:
- Syntax is accurate
- The query runs within Preset timeout limit: 10 minutes (note that your IT team might have implemented a shorter timeout setting on the database level).
- Confirm that the SQL query used only returns one row and one column. It's not possible to configure alerts with results from multiple rows or columns.
Troubleshooting Report issues
Reports are always triggered based on a pre-defined scheduled. When facing failures to execute reports, validate that:
- The chart or dashboard configured for the report is loading properly.
- In case of a dashboard, make sure that all charts are properly loading.
Troubleshooting execution failures
Common errors
A timeout occurred while executing the query
This happens when the query execution is taking longer than allowed either in Preset (10 minutes), the database settings or specified on the Alert/Report configuration.
Next Steps:
- Validate the query is successfully executed in SQL Lab.
- Increase the Working Timeout settings, on the Alert/Report configuration.
Alert fired during grace period
This occurs when the alert was triggered during the grace period, which is the minimum interval between each execution. Since reports can be used to flag anomalies, the grace period settings can be used to prevent firing multiple alerts for the same root-cause, providing your team with time to address the issue.
Next Steps
- Decrease the grace period configuration on the alert settings.
Failed generating CSV
This error happens when the application can't export a CSV from your chart. A common cause is in case the chart was not returning any data by the execution time (for instance, in case it's a report for transactions in the last hour, etc). If that's not the case, the best course of action would be creating a support ticket to engage so that our Support Team can assist troubleshooting this behavior.
Slack related errors
In order to send Alerts & Reports to Slack channels, it's required to integrate your Preset Workspace with your Slack Workspace.
There are three possible errors related with the integration setup:
| Error | Full error message | Possible root-causes | How to fix it |
|---|---|---|---|
Invalid Auth | The request to the Slack API failed. The server responded with: {'ok': False, 'error': 'invalid_auth'} |
| Review the integration steps highlighted on this page. Make sure that:
|
Channel Not Found | The request to the Slack API failed. The server responded with: {'ok': False, 'error': 'not_in_channel'} |
|
|
Not In Channel | The request to the Slack API failed. The server responded with: {'ok': False, 'error': 'channel_not_found'} |