The Interactive Pivot Table builds on the flexibility of the Interactive Table, making it easy to dynamically summarize, explore, and analyze data with advanced pivoting capabilities. This visualization provides an intuitive drag-and-drop interface for grouping, aggregating, and reordering data—ideal for deep-dive analytics.
Reference Content
The following articles may be useful resources as you build your chart:
- Creating a Chart: A walkthrough of the overall process of chart selection and creation.
- Using Preset Chart Builder: How to work with the Chart Builder page, the primary interface used when creating a chart.
- Storytelling with Charts Mini Guide: How to create charts to effectively communicate with viewers
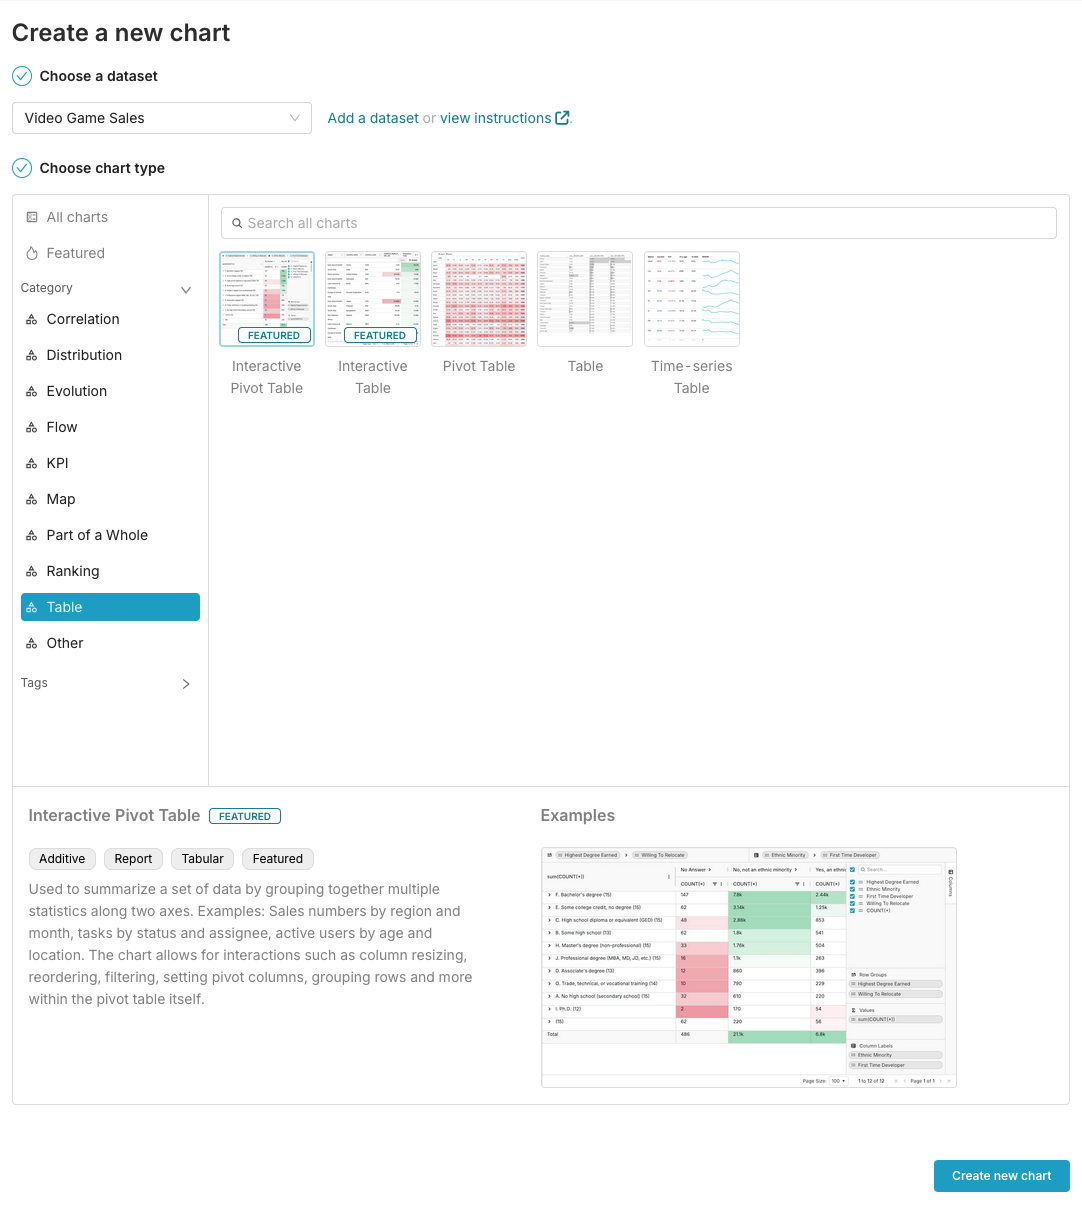
Types of Tables
You'll notice a few different options for tables in the visualization picker:
- Interactive Table
- Table
- Interactive Pivot Table
- Pivot Table
- Time-series Table
In this article, we'll be focusing on the Interactive Pivot Table visualization type.
Using the Interactive Pivot Table
If you have a Pivot Table that you'd like to switch to an Interactive Pivot Table, select the "View all charts" link at the top of the Chart Builder configuration panel. In the visualization gallery, look for the Interactive Pivot Table chart type.
To create a new Interactive Pivot Table, select your dataset and then choose the Interactive Pivot Table chart type in the visualization gallery.
Configuring Your Interactive Pivot Table
Add fields from your dataset into the Dimensions and Metrics fields of the Chart Builder. Any columns and metrics added here will be available in your Interactive Pivot Table and can be enabled or disabled within the Interactive Pivot Table later.
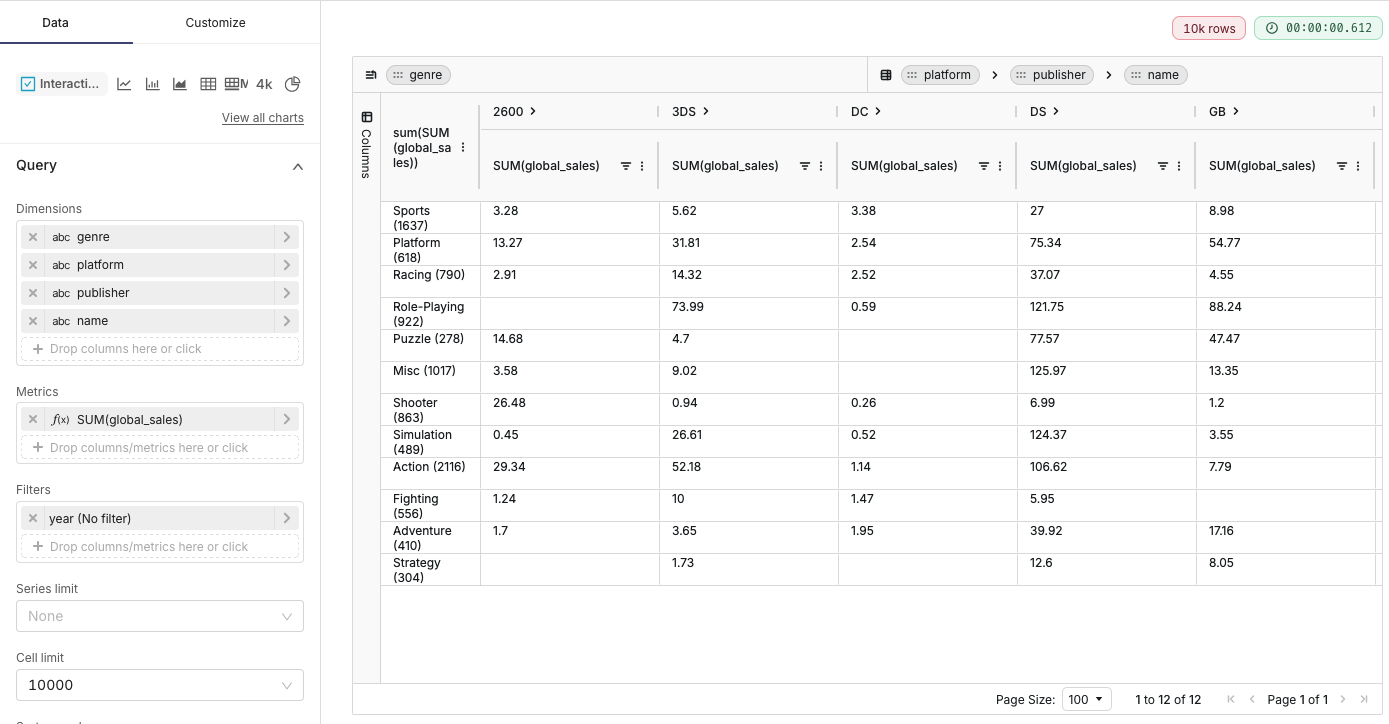
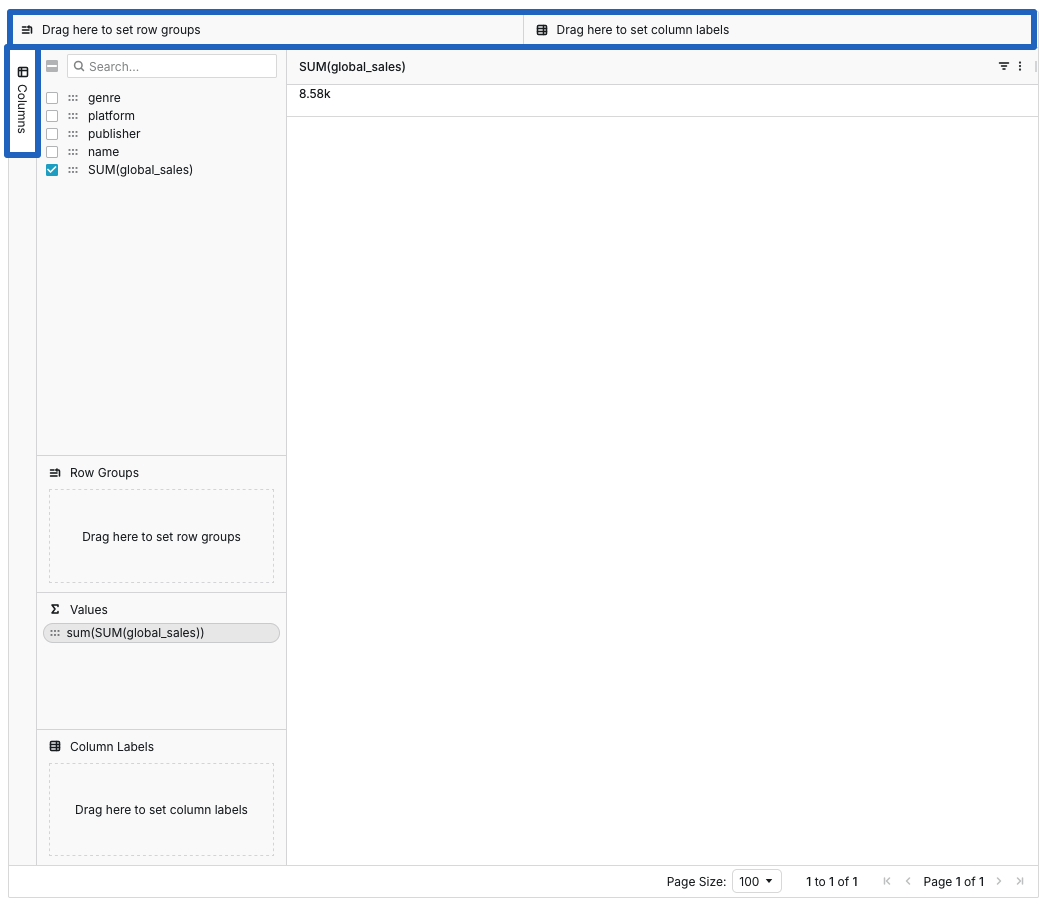
Set Your Row Groups, Columns, and Values
By default, some rows and columns will be set based on the dimensions added in the Data panel. To make changes, expand the "Columns" panel on the left or drag items between the row groups and column labels sections at the top of the Interactive Pivot Table.
Customize the Layout
- Resize columns by dragging their edges
- Adjust column sorting and filtering
- Expand or collapse row groups to focus on specific levels of detail
- Pin columns or drag to reorder
- Set your desired page size
These settings will be saved when you save the chart and view it on a dashboard.