👤 This documentation is intended for Workspace Admins and Primary & Secondary Creators (on CSV upload functionality). Check with your Team Admin for additional access.
Overview
Two of the most popular sources of data to include in a database are Google Sheets and CSV files. Preset supports both of these data sources, as described below.
Connect a Google Sheet
In order to connect a Google Sheet, you will need Administrator permissions on your workspace. Let's start by learning how to include data from a publicly-shared Google Sheet in Preset.
This is a Google Sheet that has the permission setting of Anyone with the link. To learn how to connect Preset to a privately-shared restricted Google Sheet, please see Google Sheets (Private) Connection.
Set up the Database
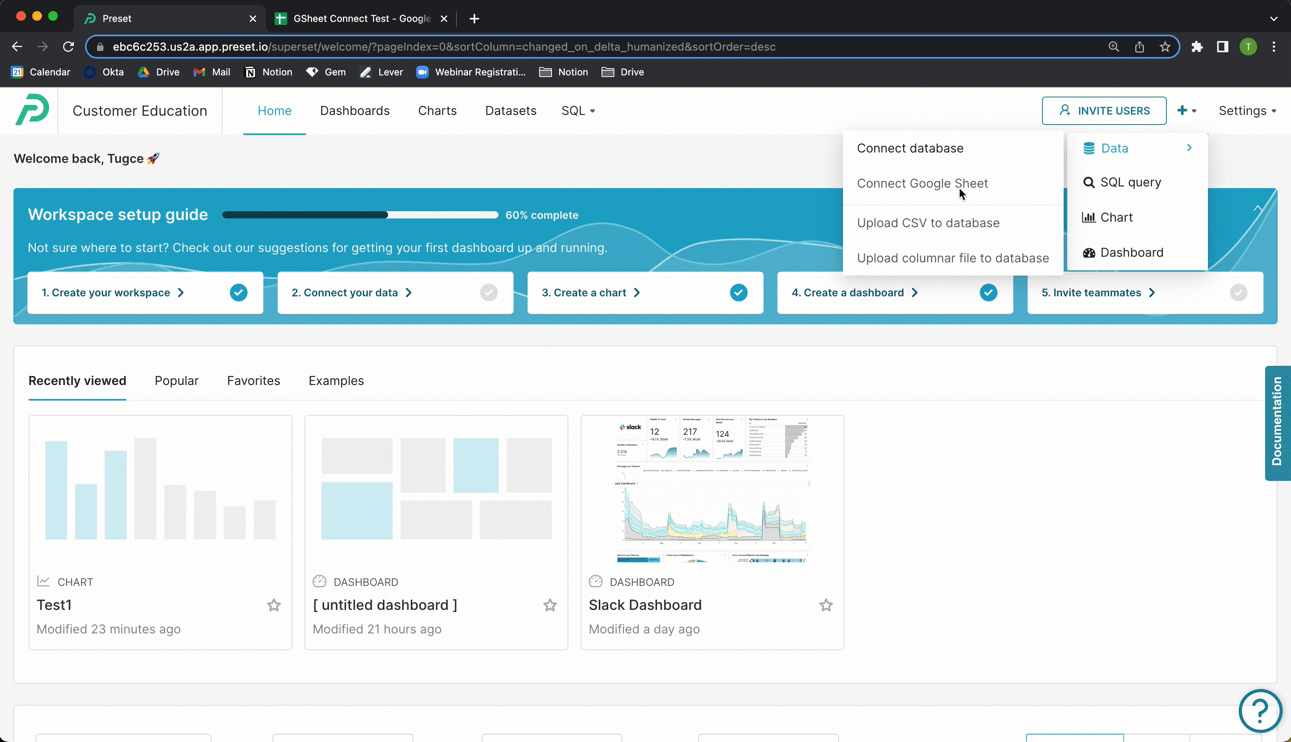
In the Toolbar, hover your cursor over the plus + icon, then Data, and then select Connect Google Sheet.
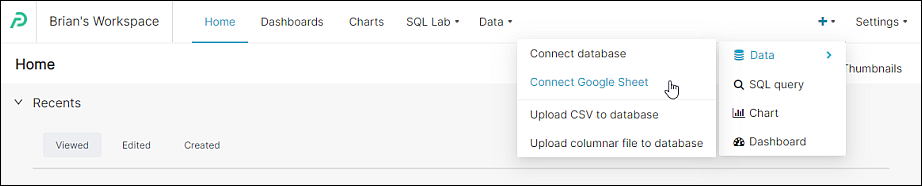
The Connect a database window appears.
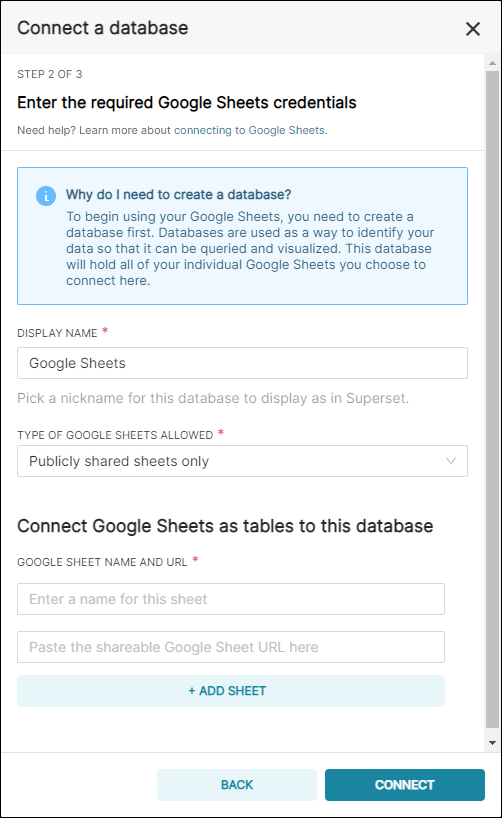
In the Display Name field, enter a meaningful name for the new connection to your public Google Sheet. In this example, we simply used the default Google Sheets.
In the Type of Google Sheets Allowed field, retain the default selection of Publicly shared sheets only.
Copy the Google Sheet Link
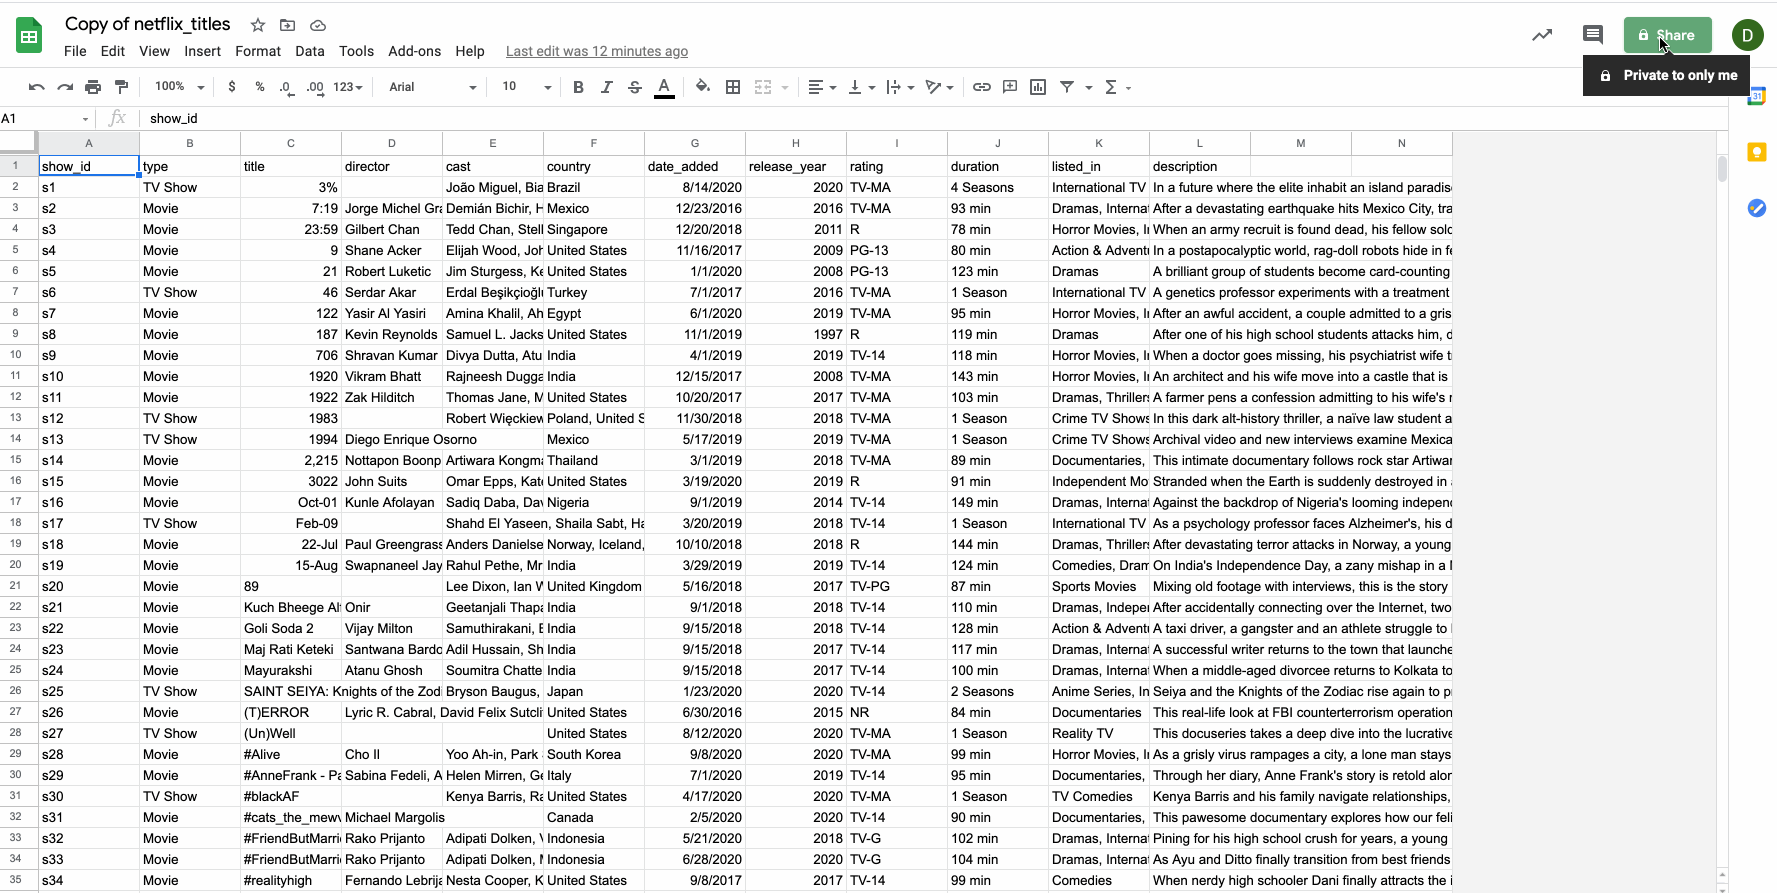
For this walkthrough, we are going to use a Google Sheet that contains data about Netflix titles. You can view the sample Netflix GSheet here  .
.
Set access permissions
Before continuing, make sure that the Google sheet has its permission set for anyone with a link.
Users will only be able to access a public google sheet if you provide them with the exact sharable URL. Public google sheets won't appear on search engine results, etc.
Copy the permalink to your clipboard
Connect Google Sheet as a Table
Our next step is to connect the Google Sheet as a table to the database.
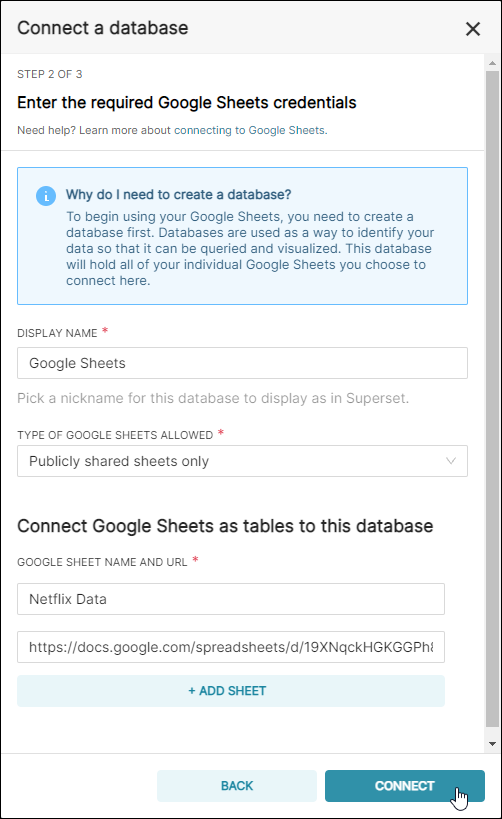
Return to Preset and, in the Google Sheet name field, enter a name for a table — in this example, we called our table "Netflix Data".
In the URL field, paste the Google Sheet URL from your clipboard.
To create additional tables, select + Add Sheet and repeat the process.
When done, select Connect.
Tip: Make sure your column names do not contain any special characters such as colon [:] and quotation marks ["] to successfully connect your Google Sheet.
Step 3 of 3 will appear. At this stage, you can configure Advanced options, if needed. To learn more, see Advanced Connection Settings.
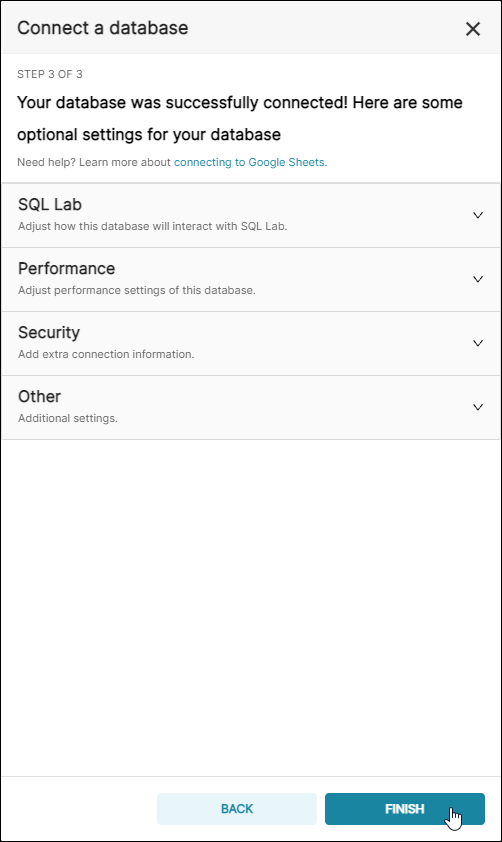
To finalize the connection, select Finish.
In order to create charts, though, one last step is required: add a dataset from your newly-created Google Sheet database.
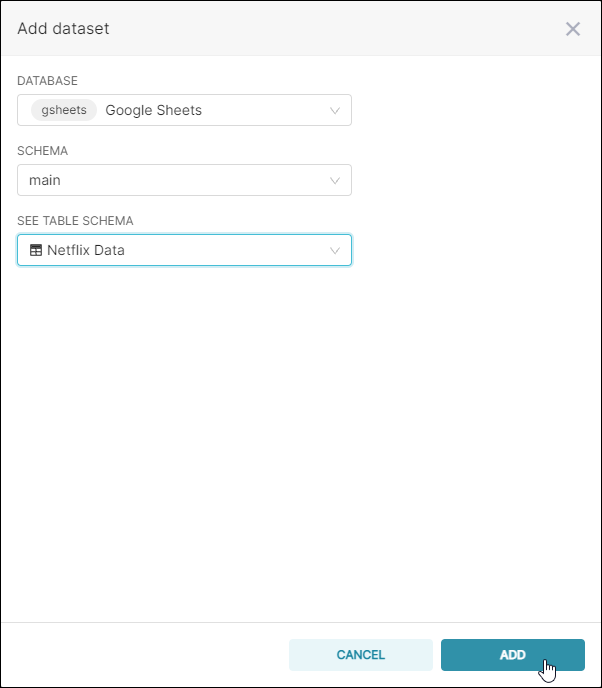
Add a Dataset to Preset
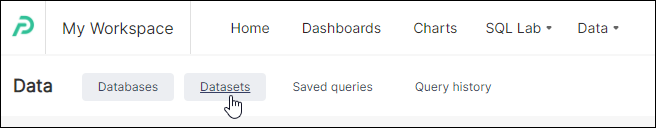
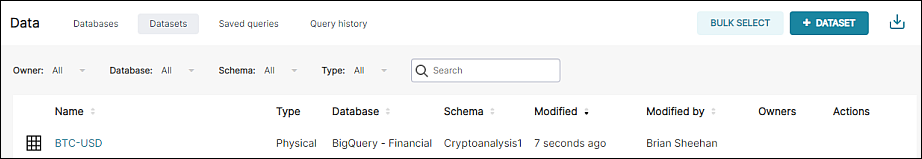
Start by navigating to Datasets. From the Data screen, select the Datasets tab.
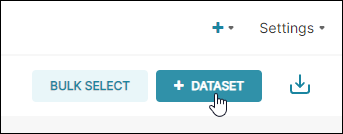
Then select + Dataset.
The Add dataset panel appears.
In the Database field, select the database name that you defined earlier in the Display Name field.
In the Schema field, select a schema (if applicable).
In the See Table Schema field, select a table that you created in Step 3 above.
Select Add.
Great, you are now ready to start creating charts using your Google Sheet data!
Upload a CSV File
You can also add comma-separated value-based data (CSV file). In order to do so, you will need Administrator or Primary/Secondary Creator permissions on your workspace.
Connect a Database and Enable Uploads
For workspaces created before April 13, 2023:
If you created your workspaces before April 13, 2023, a CSV file cannot be uploaded without a database connection. Be sure to add your database first to make use of the CSV upload feature!
In order for the database to accept the CSV, you need to enable data uploads. Data uploads will be enabled by default. If data uploading is disabled, follow the below steps.
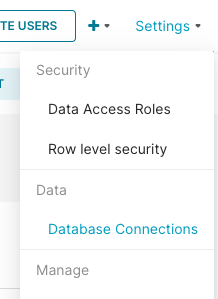
Start by navigating to the Database Connections link from your settings.
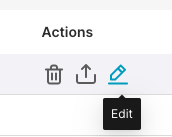
and then select the Edit pencil icon for your database.
The Edit database panel appears. Select the Advanced tab and then expand the Security panel.
In the Schemas Allowed for CSV Upload field, enter the name(s) of any schemas in your database that should be available for CSV data uploads. If more than one, separate each by a comma.
In the Allow data upload field, select the checkbox.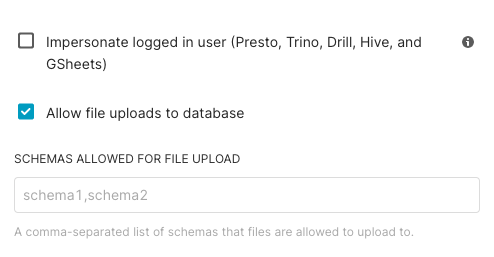
If there are specific schemas to house the CSV upload, specify those schemas in the text box shown.
Lastly, select Finish.
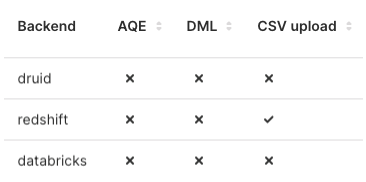
To confirm, in the Databases screen under the CSV upload column header, ensure that a checkmark is displayed for your database row entry.
In the example below, CSV data upload has been enabled
Configure the CSV Upload
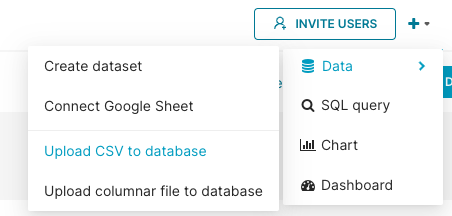
In the Toolbar, select Upload file to database, and then, in the sub-menu, select Upload CSV.
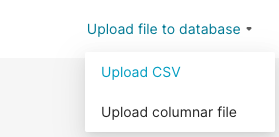
Alternatively, you can hover your cursor over the plus + icon, then Data, and then select Upload CSV to database from any screen in Preset.
The CSV to Database configuration screen appears.
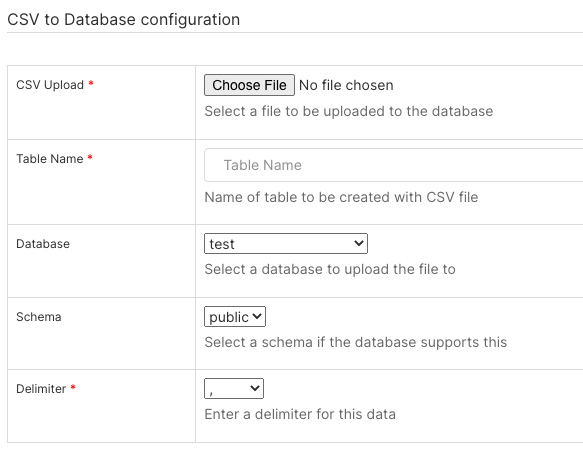
In the CSV Upload* field, select Choose File and select the CSV file on your local or network system.
In the Table Name* field, enter a memorable name for the table to be created from the CSV data.
In the Database field, select the database to use.
In the Schema field, select the schema associated with the selected database.
In the Delimiter* field, specify the symbol used to delimit the data. For a whitespace, use \s+.
Other CSV Configurations
File Settings
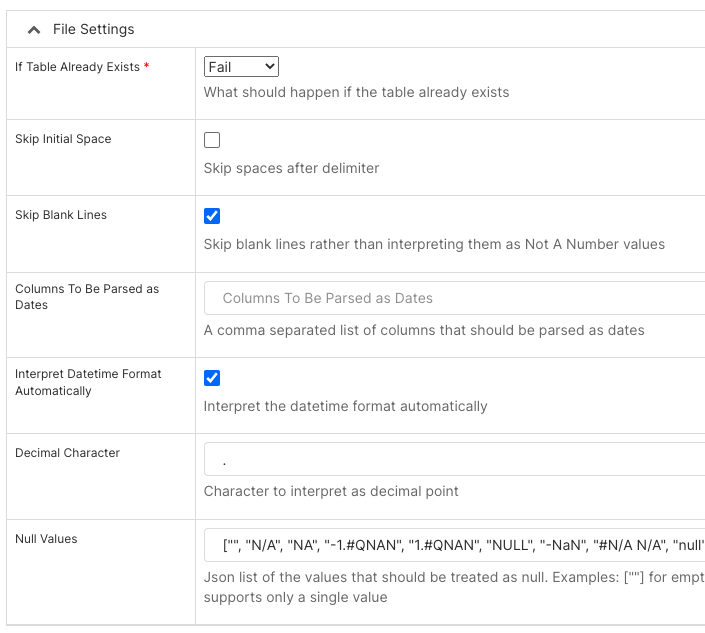
In the Table Already Exists* field, select what to do if a table already exists: Fail (do nothing), Replace (drop and recreate table), or Append (insert data).
In the Skip Initial Space field, select to skip spaces after the delimiter.
In the Skip Blank Lines field, select to skip blank lines instead of interpreting them as NaN values.
In the Columns To Be Parsed as Dates field, add a comma-separated list of columns that should be parsed as dates.
In the Interpret Datetime Format Automatically field, select to use Pandas to automatically interpret the datetime format.
In the Decimal Character field, enter a character to interpret as a decimal point.
In the Index Column field, enter the column to use as row labels for the data frame. Leave empty if there is no index column.
In the Overwrite Duplicate Columns field, select the checkbox to specify duplicate columns as "X.0, X.1".
Null Values: List of values that should be treated as null, in JSON format.
Columns
In the Dataframe Index field, select to write the dataframe index as a column,
In the Column Label(s) field, enter one or more column labels for index columns. If none are provided and if Dataframe Index is true, then index names are used.
Rows
In the Header Row field, enter 0 if your CSV data already has a header row or leave it empty if there is no header row present.
In the Rows to Read field, enter the number of rows to read.
In the Skip Rows field, enter the number of rows to skip at the start of the file.
*: Required
When done, select Save.
After selecting Save, you will be taken to the Datasets screen where your newly-loaded CSV and associated dataset appear.
Visualize the CSV Data
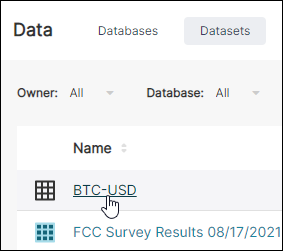
From here, you can select the dataset to launch it on the Chart Builder page and proceed with configuring a chart.
Common Errors in the CSV Upload
1. CSV upload is slow or frozen
- Your CSV upload speed can be dependent on well-formatted dates. Datetime values outside of the ISO 8601 may cause the CSV upload to be slower.
- Large files take longer to upload. You can enter a value to the Rows to Read field to try a smaller upload of the file.
- Column with long text length may delay the upload speed of the file.
2. Delimiter is incorrect
By default, Preset will use the , as the delimiter. If the delimiter is None, then instead the C engine, the Python engine will use csv.Sniffer to detect the delimiter.
Delimiters longer than 1 character and different from '\s+' will be interpreted as regular expressions and will also force the use of the Python parsing engine.
3. Header row is incorrect
The field for the header row is used to identify which row(s) to use as column names and which rows are the start of the data. 0 is considered the first row. By default, Preset will infer the row for column names. If no numbers are passed the behavior is identical to header=0, and column names are inferred from the first line of the file, if number(s) for the column names are passed explicitly, then the behavior is identical to header=None. You can explicitly type 0 to be able to replace existing names. The field also can receive a list of integers that specify row locations for a multi-index on the columns e.g. [0,1,3]. This parameter ignores commented lines and empty lines
4. Index column
Index columns are used as the row labels of the DataFrame, either given as string name or column index. If a sequence of numbers or text is given, a multi-index is used. If you have a malformed file with delimiters at the end of each line, False can be inputted so to not use the first column as the index.
5. Columns to read
All inputs must either be the text corresponding to the column names or be numbers that represent the index for columns.
6. Dates are not readable
It's possible some date values can't be interpreted by Preset because of an unparsable value or a mixture of timezones. In this scenario, the column or index will be returned unaltered as an object data type.