- 21 Jul 2023
- 1 Minute to read
- Print
- DarkLight
- PDF
Drill By
- Updated on 21 Jul 2023
- 1 Minute to read
- Print
- DarkLight
- PDF
Reach out to a Workspace Admin in case this feature is not available to you.
Note: This feature is not currently available for embedded viewers.
Overview
In Preset, you can drill into charts and tables in the dashboards by any dataset dimension (column). Drill By makes data analysis easier by allowing the slicing and dicing of data directly in the visualizations and helps to uncover product, business, and operational insights.
Supported Chart Types
All charts in Preset support the Drill By functionality as long as they group data by a dimension value. They include:
- Area Chart
- Bar Chart
- Box Plot
- Funnel Chart
- Gauge Chart
- Graph Chart
- Line Chart
- Mixed Chart
- Pie Chart
- Pivot Table
- Radar Chart
- Scatter Plot
- Smooth Line Chart
- Stepped Line Chart
- Table Chart
- Tree Chart
- Tree Map
- World Map
All columns in your dataset that are marked as a "dimension" are eligible for Drill By. To check, click on the Edit (pencil) icon of your dataset from the "Datasets" view.
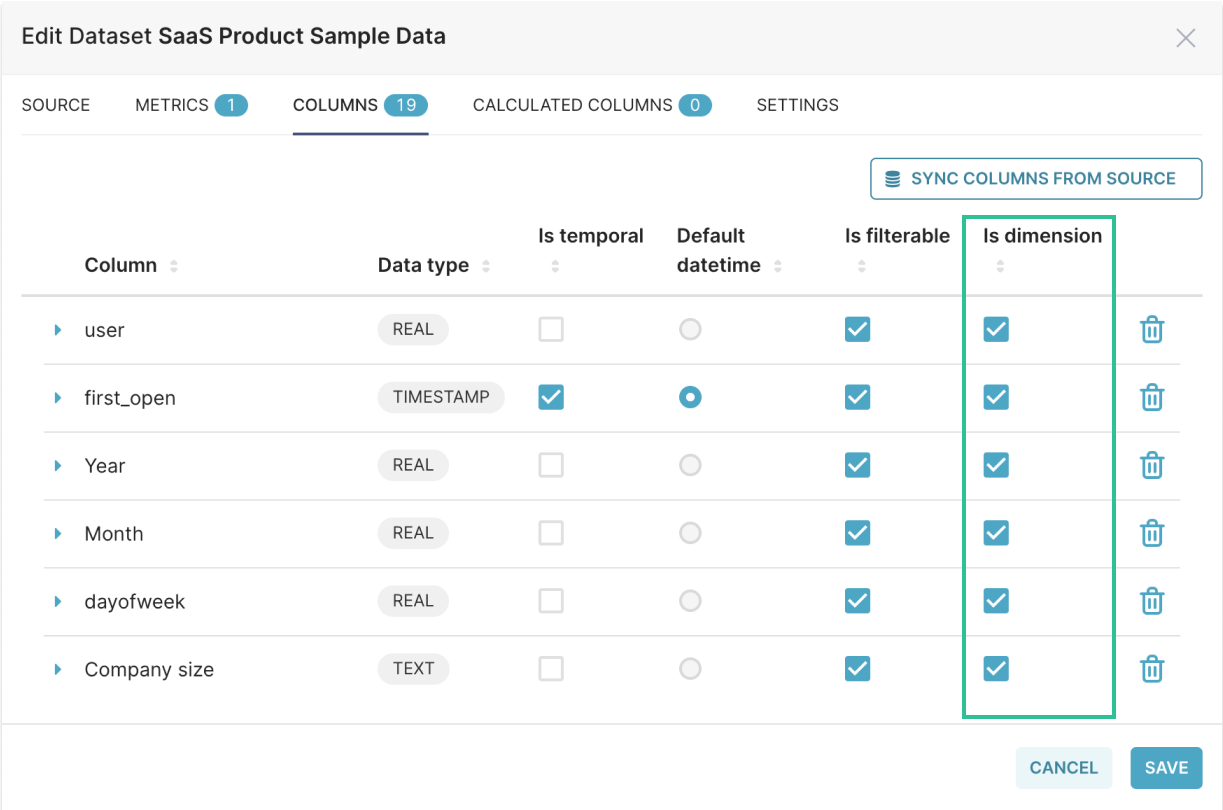
Columns can be hidden from the Drill By menu by unchecking them as a dimension on the dataset.
Unchecking the "Is dimension" check box will also remove that column from being used as a dimension in the chart builder.
How It Works
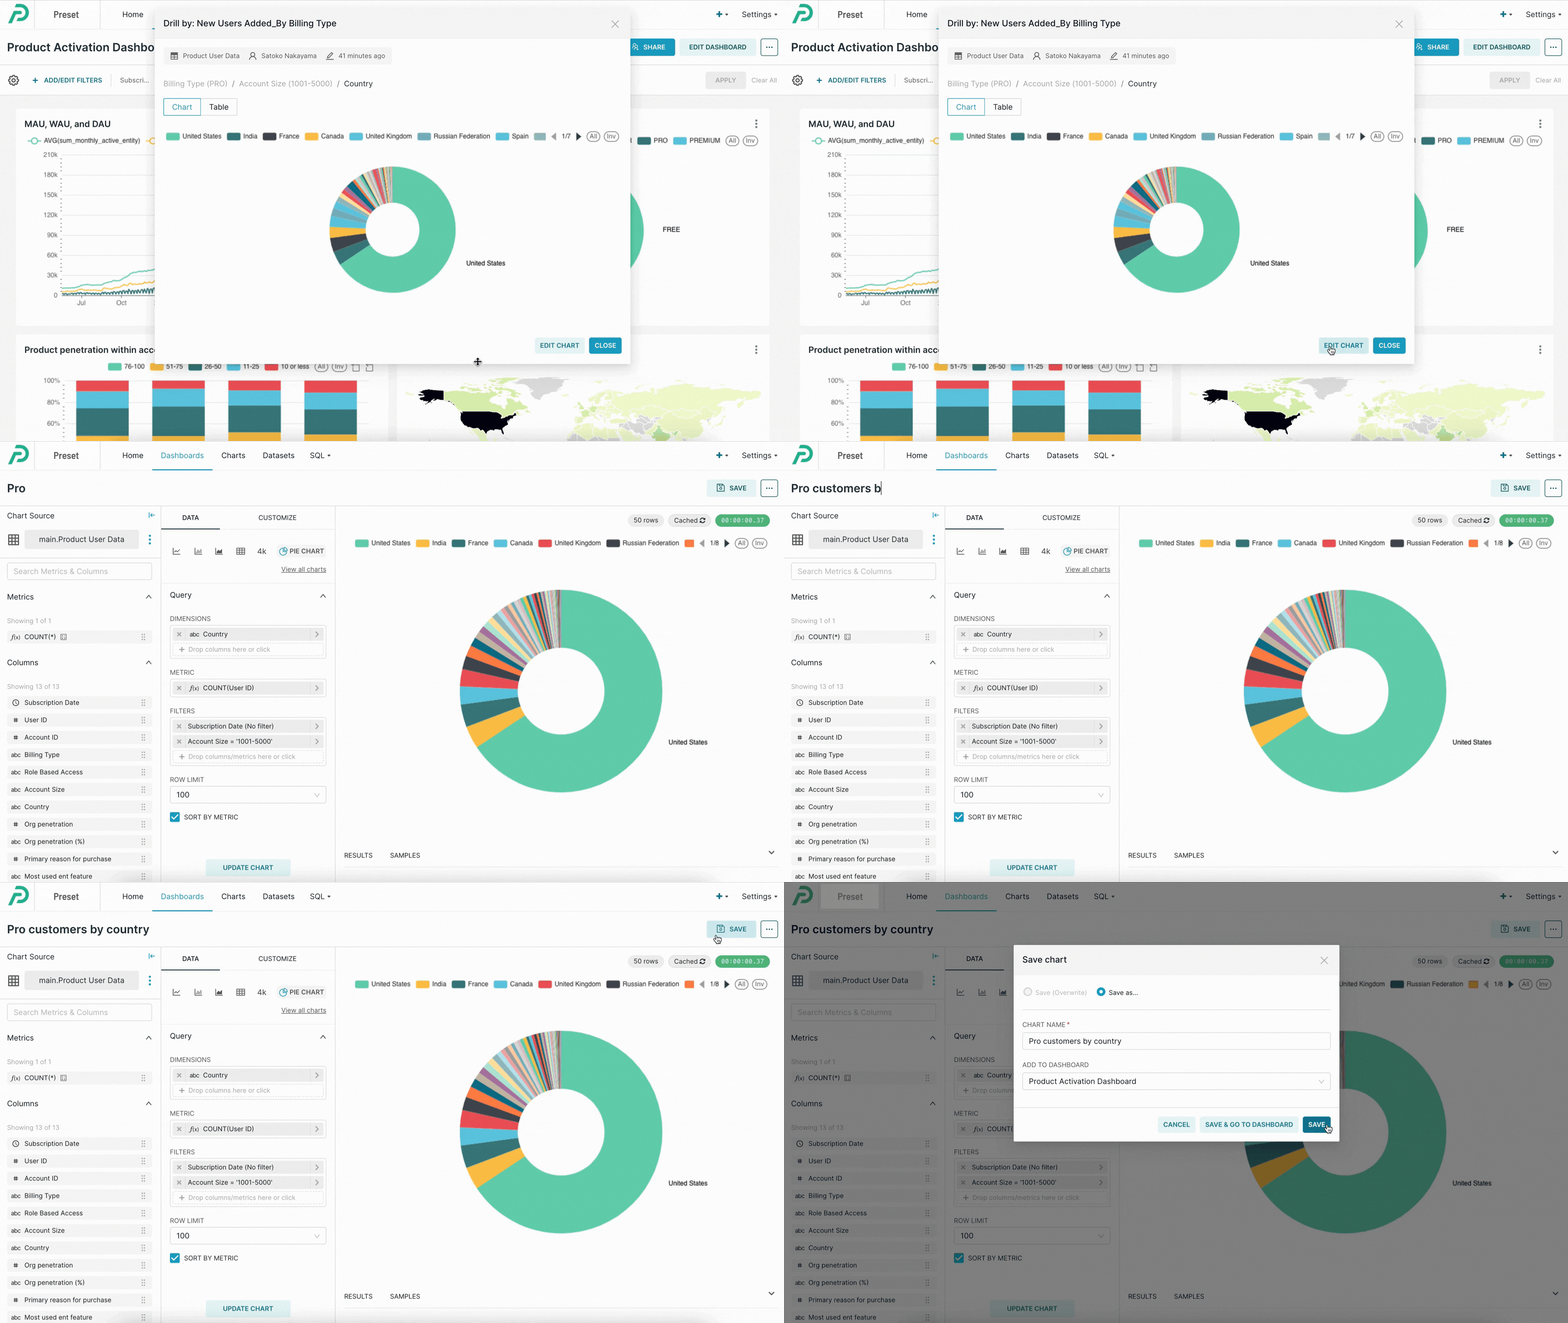
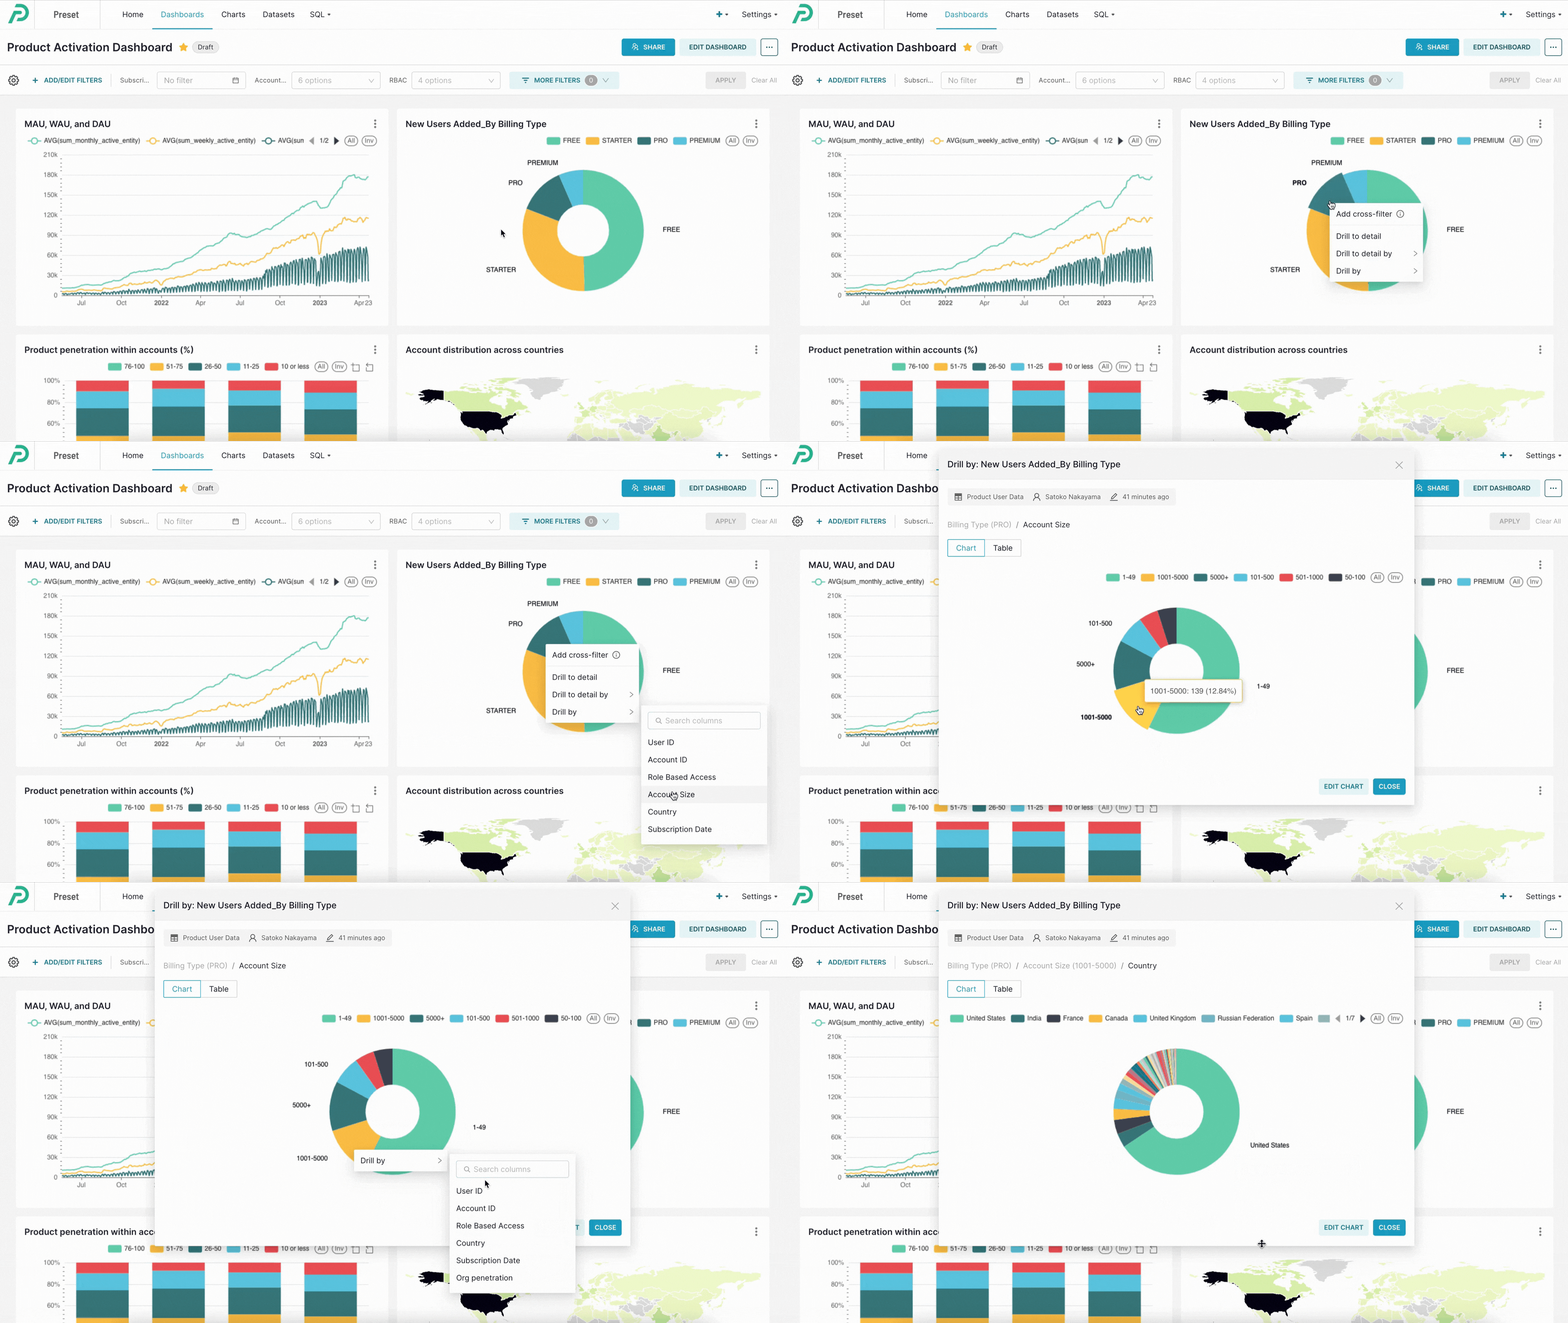
From your dashboard, right-click on a chart and select the Drill By option.
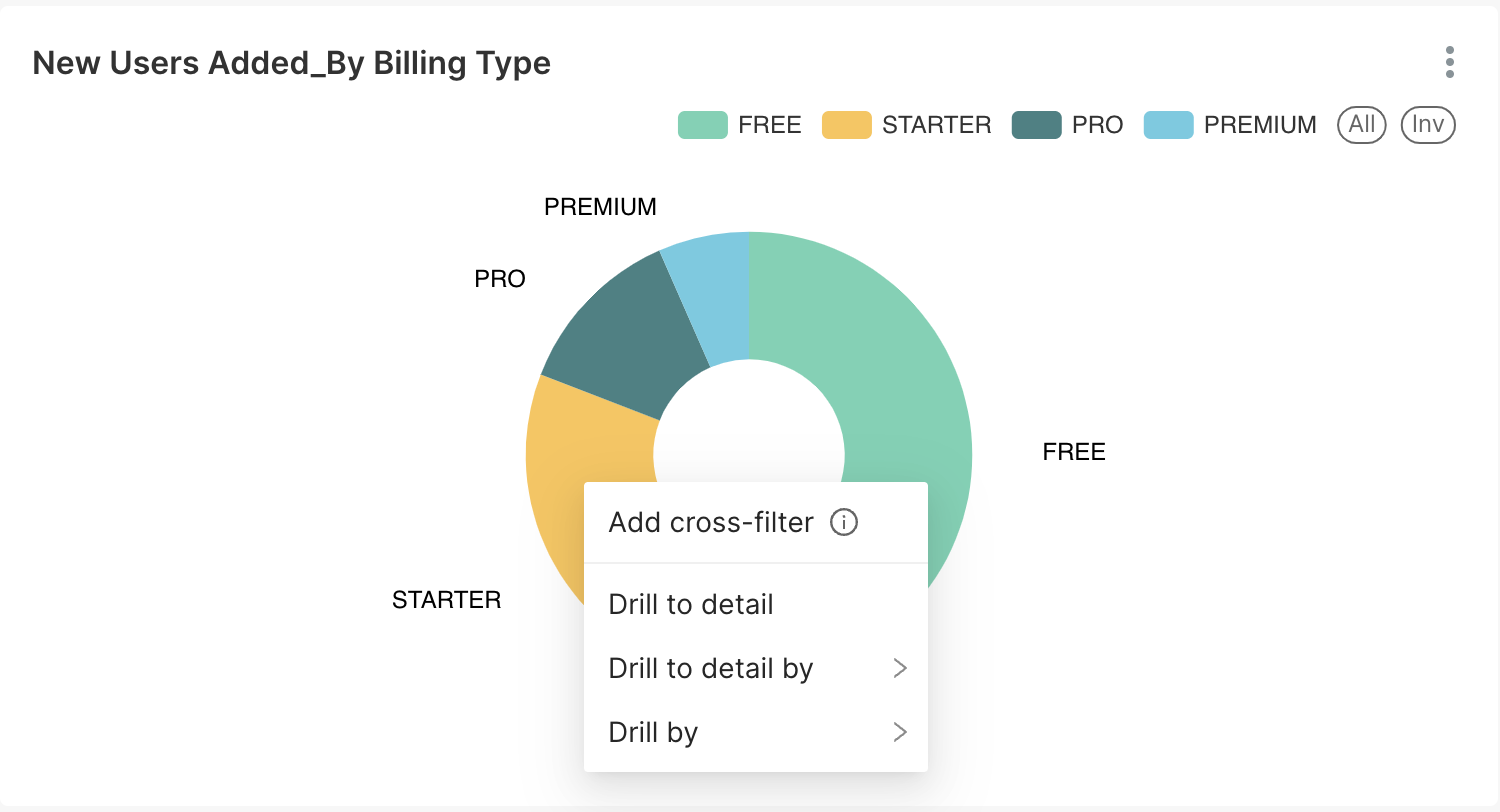
Select the column you want to Drill By. When there are more ten dimensions, a search bar is available to help you find the right column.
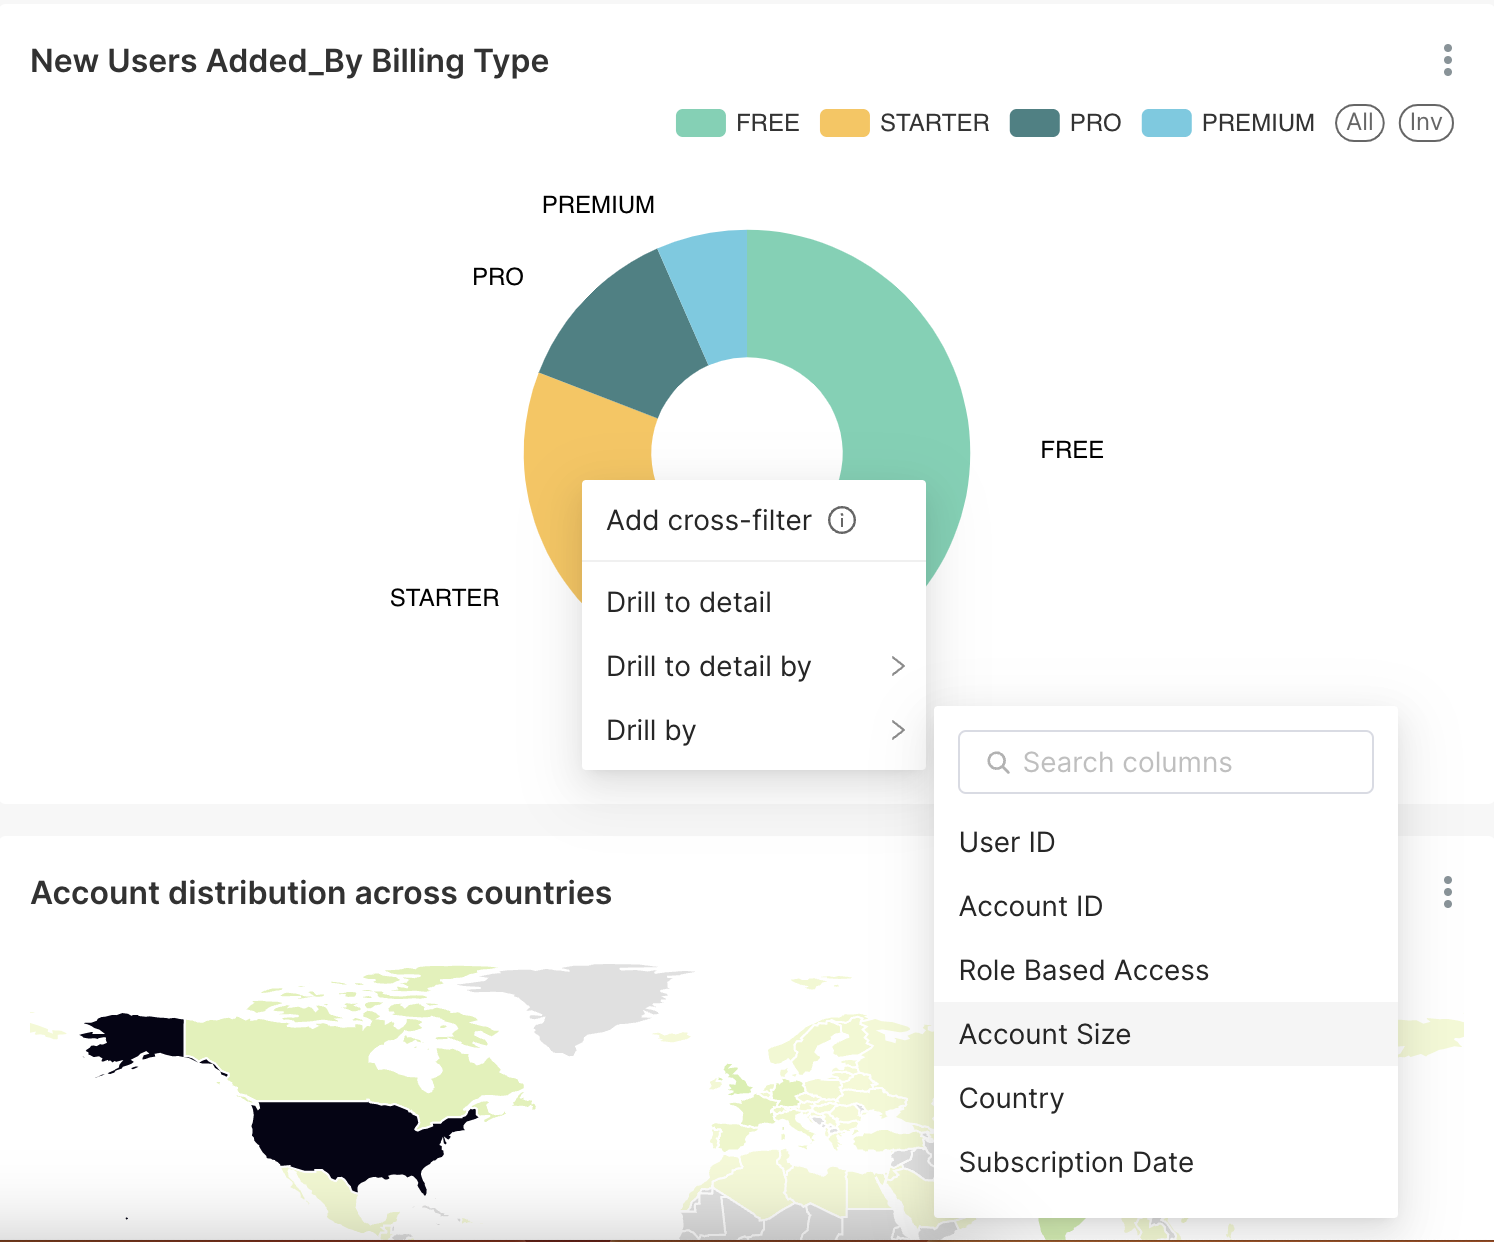
A new chart will open in a modal, filtered by the column that you drilled by.
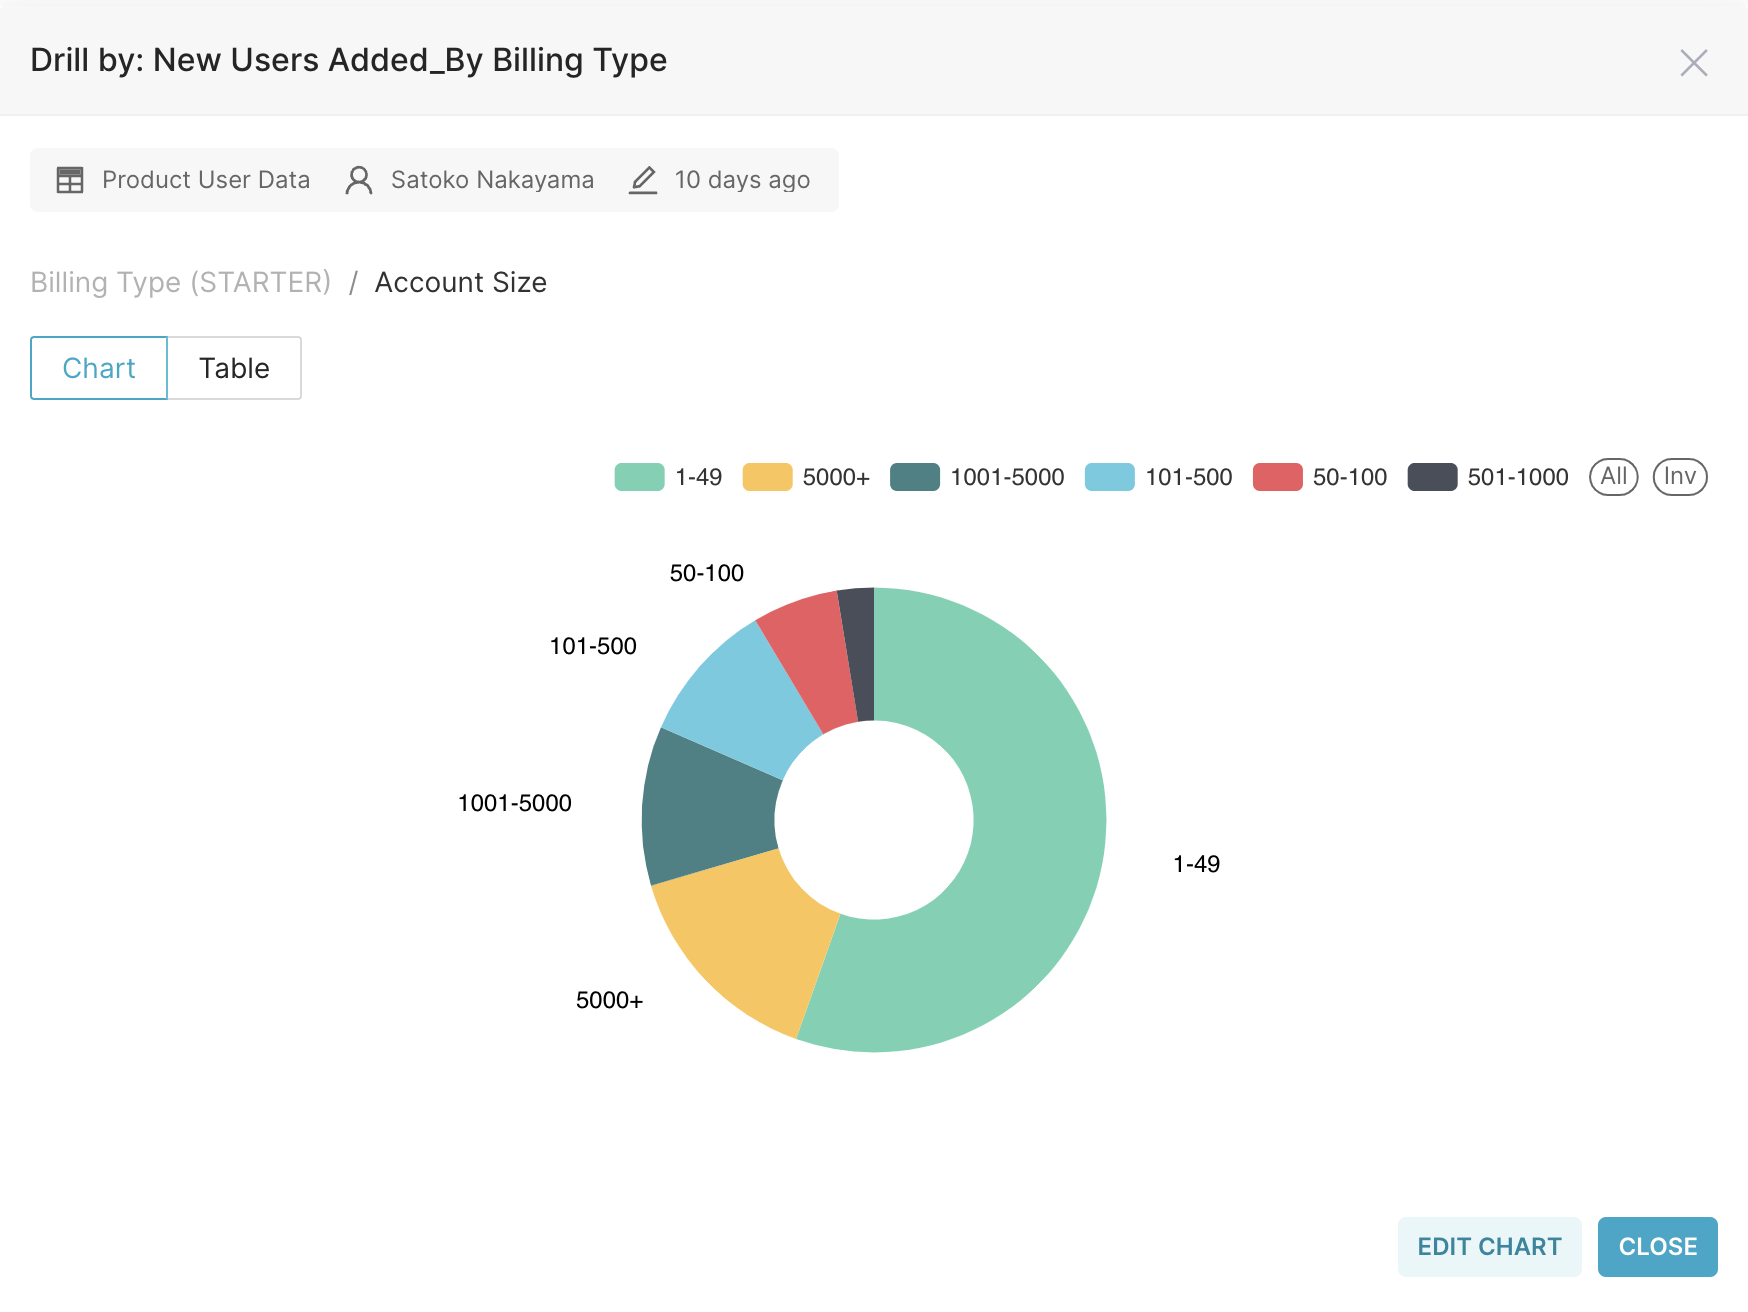
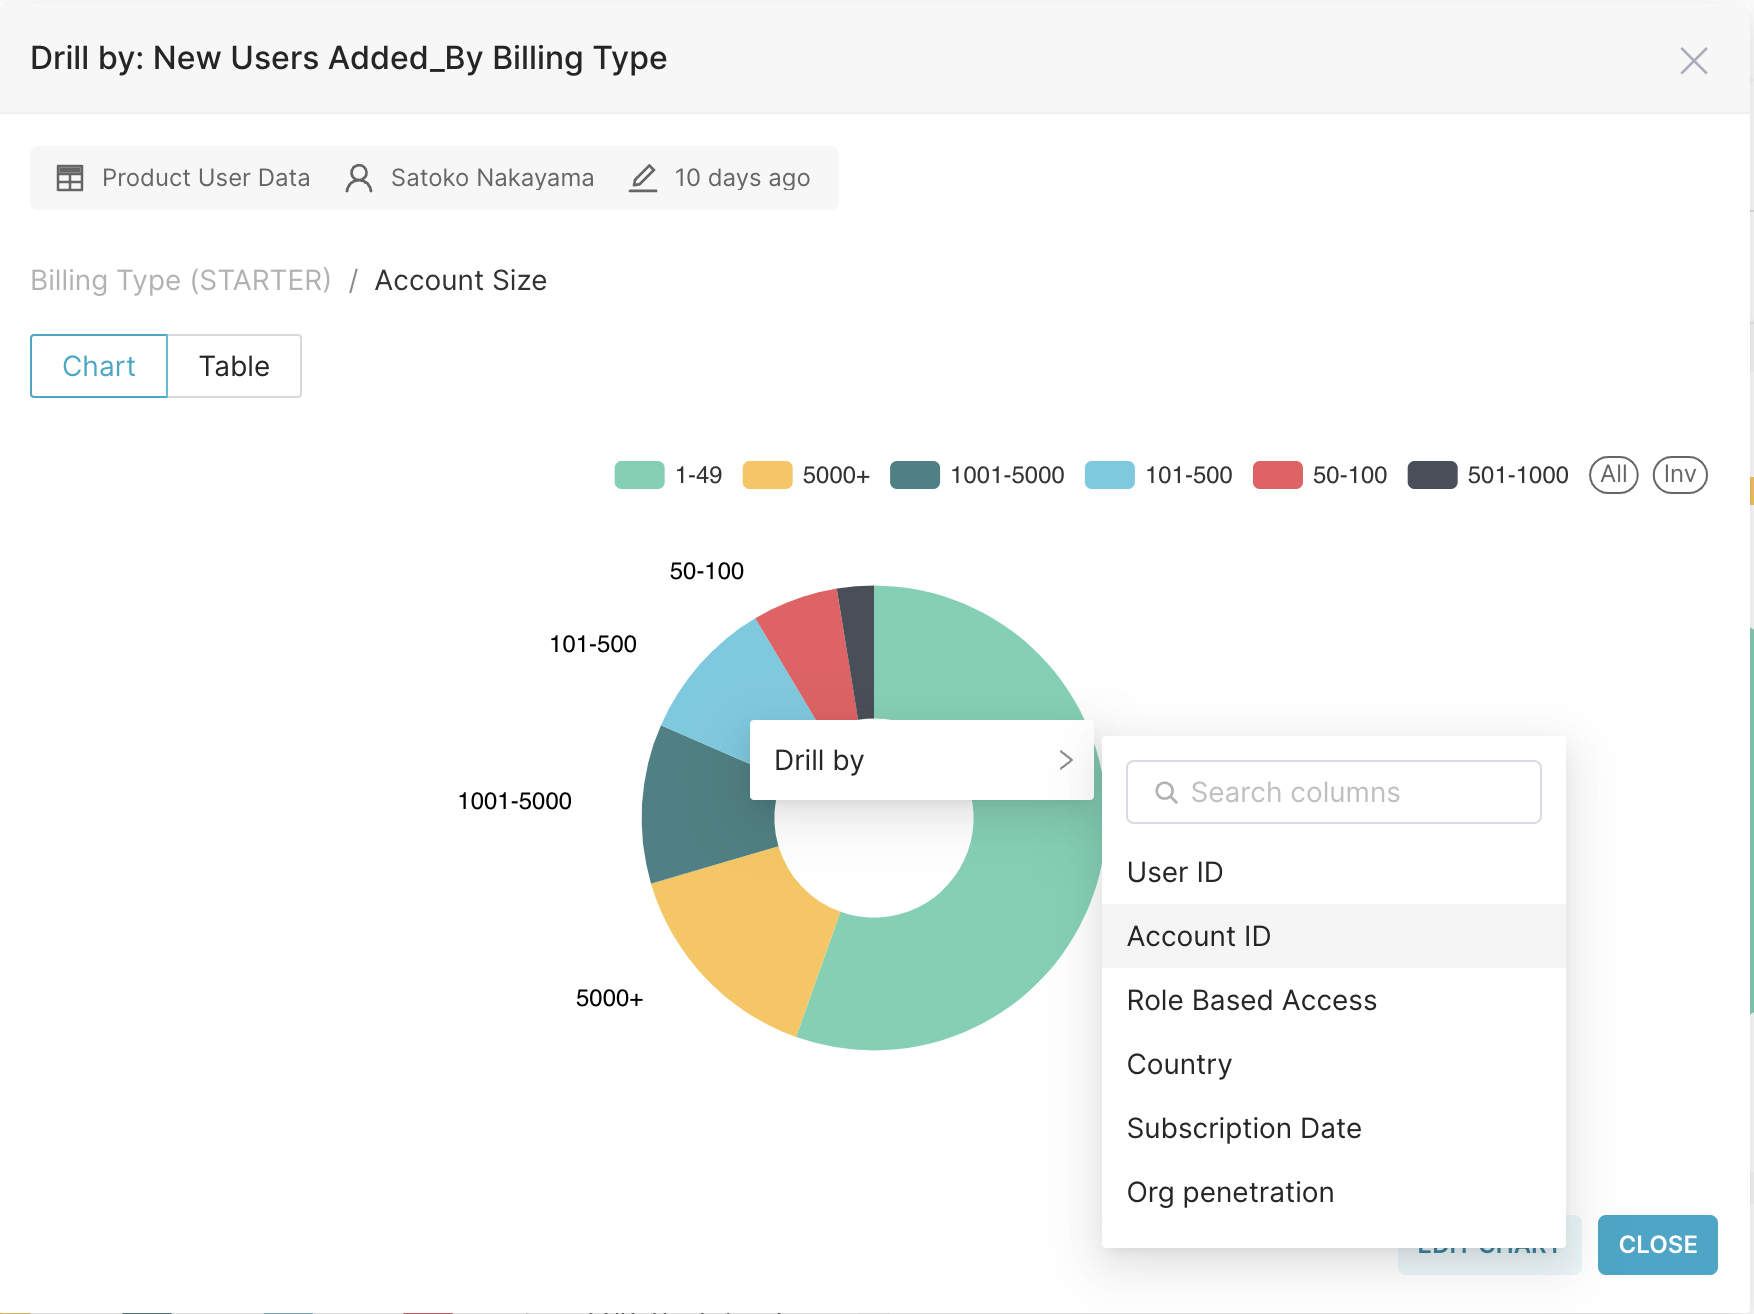
From the modal, you can:
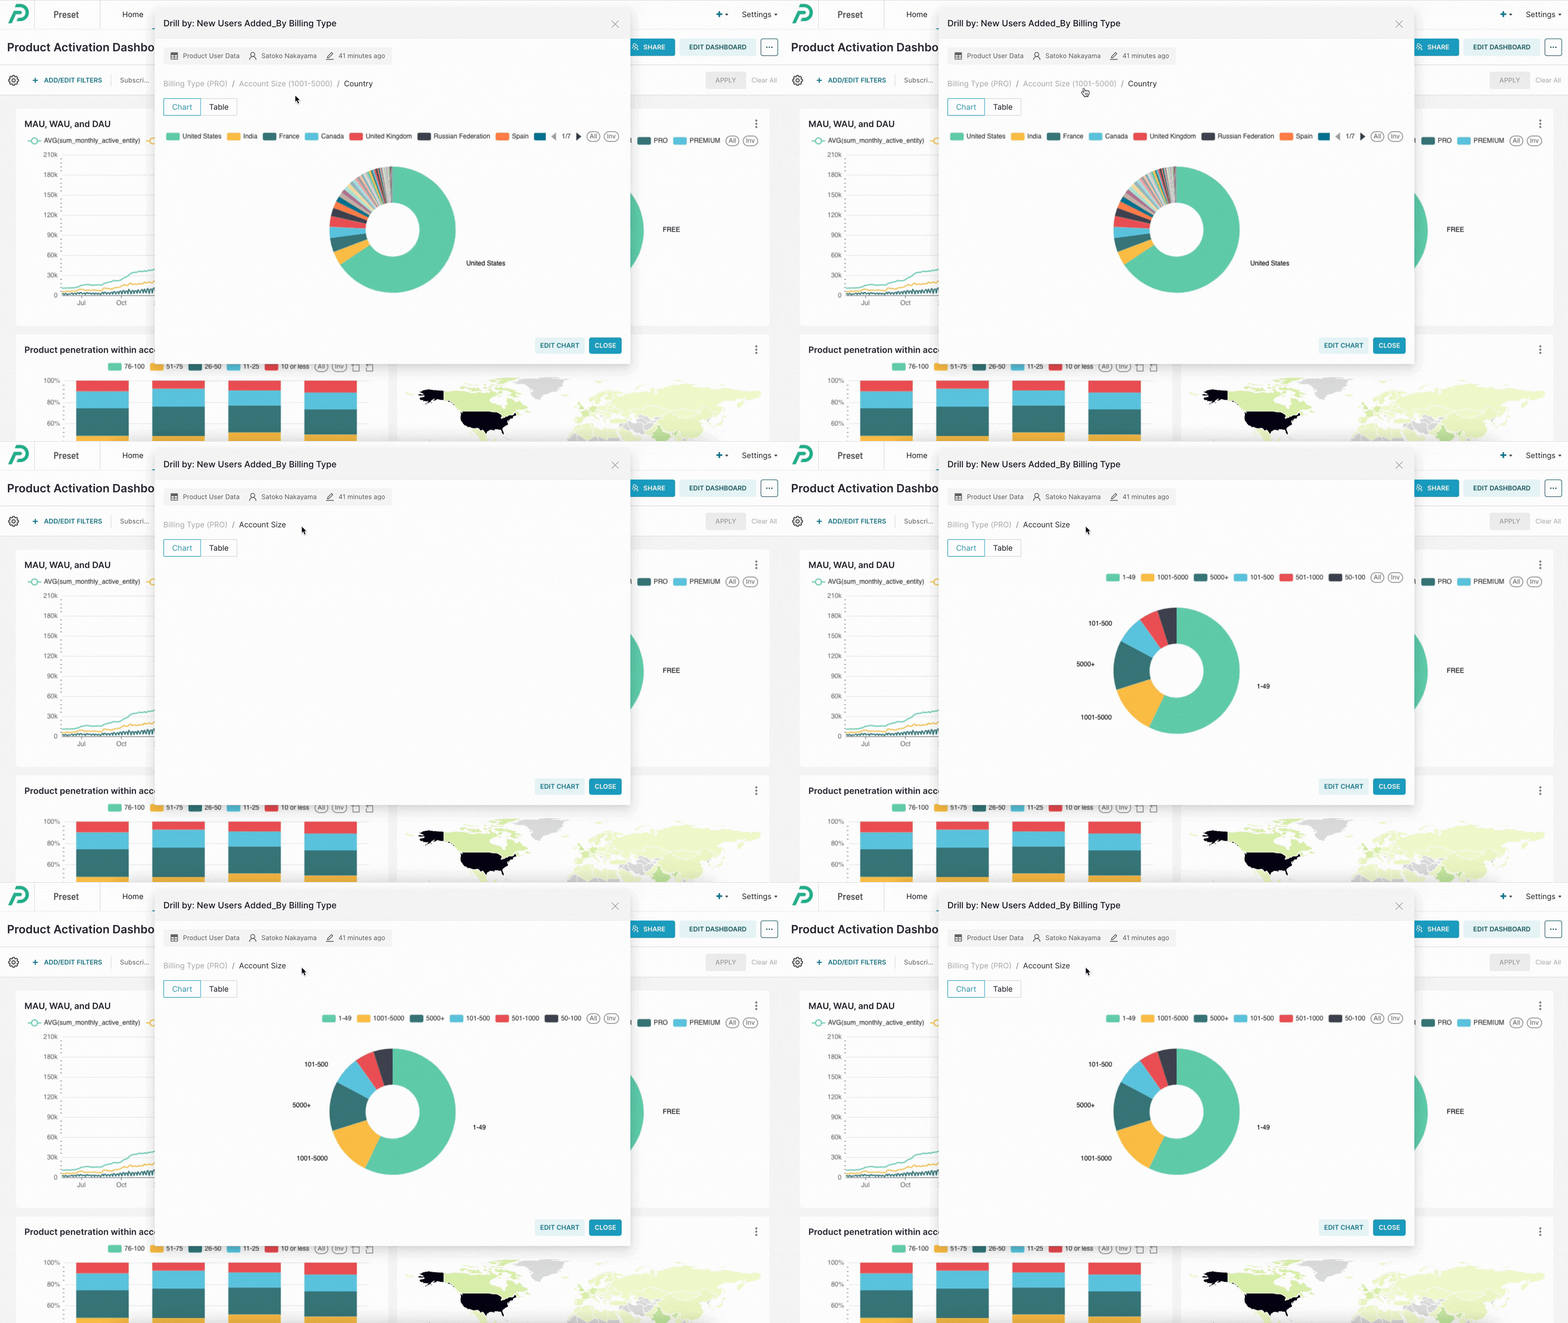
Continue to drill deeper by right-clicking and selecting a new column.
Return to previously drilled charts by clicking the breadcrumbs.
View your chart in a table format.
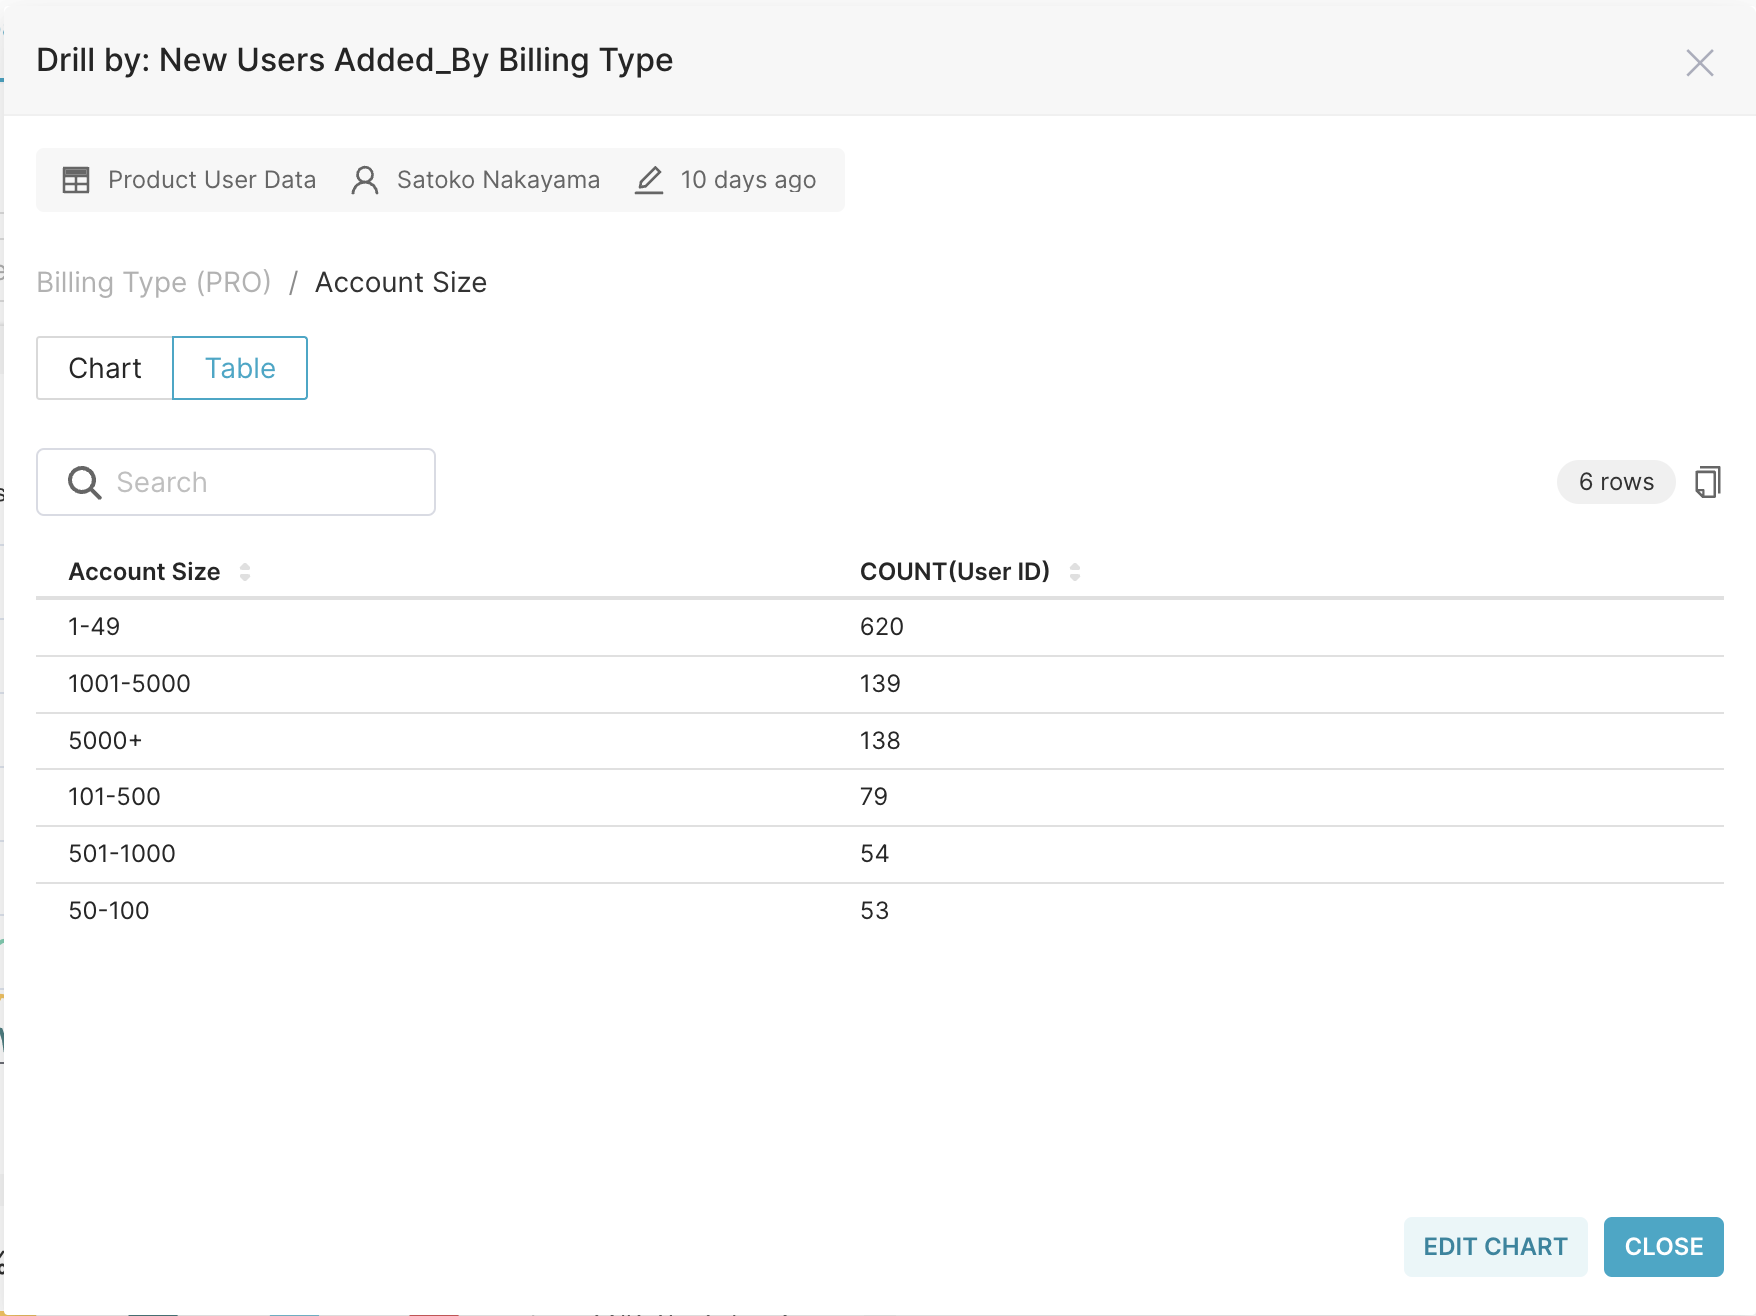
Click Edit Chart to open the drilled chart in the Chart Builder and save it from there.
