---
title: "Deck.gl Charts"
slug: "deckgl-chart"
updated: 2026-02-05T17:55:06Z
published: 2026-02-05T17:55:06Z
canonical: "docs.preset.io/deckgl-chart"
---
> ## Documentation Index
> Fetch the complete documentation index at: https://docs.preset.io/llms.txt
> Use this file to discover all available pages before exploring further.
# Deck.gl Charts
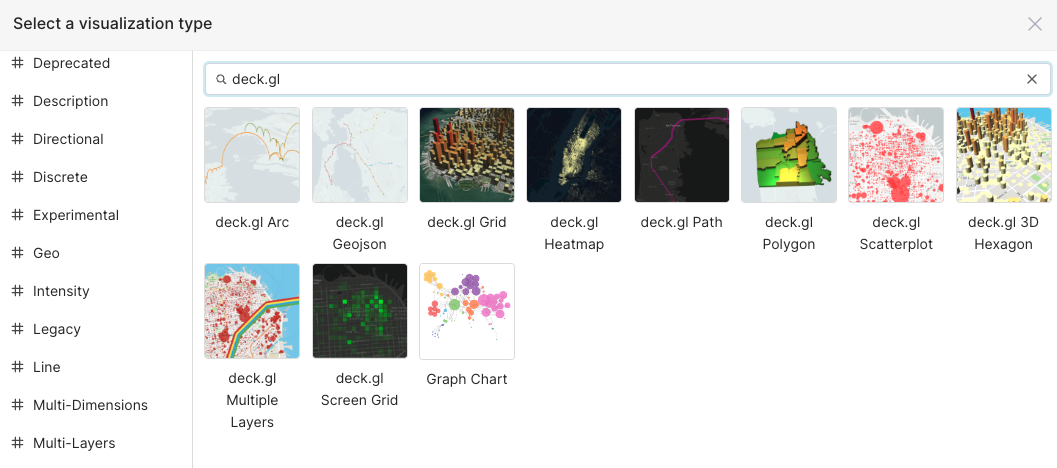
deck.gl is a powerful WebGL-powered data visualization library. It allows complex visualizations to be constructed by composing existing layers, and makes it easy to package and share new visualizations as reusable layers. Preset offers 10 deck.gl charts in its chart picker.
deck.gl is maintained by the open source Superset community
deck.gl integration with Preset is primarily maintained by open source Superset. You are welcomed to [contribute to updates to deck.gl integration](https://github.com/apache/superset/blob/master/CONTRIBUTING.md).
## Customizing and Extending deck.gl Charts
deck.gl provides various chart layers, each with its own set of props and customization options. Read on to learn about customization or can explore the [deck.gl documentation](https://deck.gl/docs/api-reference/layers) for further information about controls.
### Custom Tooltips
Customize the appearance and content of tooltips on deck.gl map visualizations using Handlebars templates. This feature allows you to create rich, styled tooltips that display exactly the information you need.
### Supported Chart Types
Custom tooltips are available on all deck.gl chart types:
- deck.gl 3D Hexagon
- deck.gl Arc
- deck.gl Contour
- deck.gl Geojson
- deck.gl Grid
- deck.gl Heatmap
- deck.gl Path
- deck.gl Polygon
- deck.gl Scatterplot
- deck.gl Screen Grid
### Configuring Custom Tooltips
1. Open your deck.gl chart in the Chart Builder
2. In the Query section, locate the Tooltip contents field
3. Add the columns and/or metrics you want to display in your tooltip
4. Once you add content, you’ll see them in the **Customize tooltips template** field.
5. Modify your tooltip using Handlebars syntax to customize the display
6. Click **Update chart** to preview your changes
#### Template Syntax
Custom tooltips use [Handlebars](https://handlebarsjs.com/) templating. Reference your columns and metrics using double curly braces:
```
{{ column_name }}: {{ metric_name }}
```
**Example:** For a scatterplot with `STREET` as a column and `occupancy` as a metric:
```
{{ STREET }}
Occupancy: {{ occupancy }}
```

#### Styling Your Tooltips
You can use inline CSS styles within your template to customize the appearance:
```
{{ location_name }}
Value: {{ metric_value }}
```
#### Aggregated Data in Grid-Based Charts
Grid, Screengrid, and Heatmap charts aggregate multiple data points into each cell. When you add a column to **Tooltip contents**, the template auto-generates with a `limit` helper:
`{{ limit occupancy 10 }}`
**Note:** Because each cell may contain many data points, the tooltip shows only a sample of values, not the full aggregated total.
### Color Scheme Controls
Configure how colors are applied to your deck.gl visualizations based on your data. You can choose from fixed colors, palettes, or custom breakpoints to control how metric values map to colors on your map.
#### Supported Chart Types
**Fixed color, Categorical palette, and Color breakpoints:**
- deck.gl Grid
- deck.gl 3D Hexagon
- deck.gl Scatterplot
- deck.gl Polygon
**Fixed color and Categorical palette:**
- deck.gl Screengrid
- deck.gl Arc
- deck.gl Heatmap
#### Color Scheme Types
When editing a deck.gl chart, the **Color Scheme Type** dropdown offers up to three options depending on the chart type:
- **Fixed color**: A single color applied to all data points. Useful for simple visualizations where color differentiation isn't needed.
- **Categorical palette**: Distinct colors assigned to categorical dimension values. Select a dimension column to color data points by category.
- **Color breakpoints**: Custom color ranges at specific thresholds you define. This gives you precise control over which colors appear at which values.
#### Configuring Color Breakpoints
1. Open your deck.gl chart in **Explore**
2. In the chart controls, locate **Color Scheme Type**
3. Select **Color breakpoints**
4. Click **+ Add Breakpoint** to define your first threshold
5. For each breakpoint, configure:
- **Min Value**: The lower bound of the range
- **Max Value**: The upper bound of the range
- **Color**: The color to apply for values in this range
6. Add additional breakpoints as needed
7. Click **Update chart** to apply your changes

#### Example: Population Density Map
To visualize population density with three distinct color bands:
1. Add a breakpoint: Min `0`, Max `100`, Color green → Low density areas
2. Add a breakpoint: Min `100`, Max `500`, Color yellow → Medium density areas
3. Add a breakpoint: Min `500`, Max `10000`, Color red → High density areas
