👤 This documentation is intended for Primary Creators and Workspace Admins. Check with your Team Admin for additional access.
How to Create an Alert
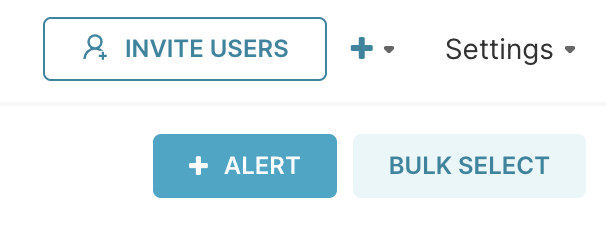
After navigating to the Alerts & Reports screen, you'll be taken to the Alerts interface by default. To create a new alert, select + Alert.
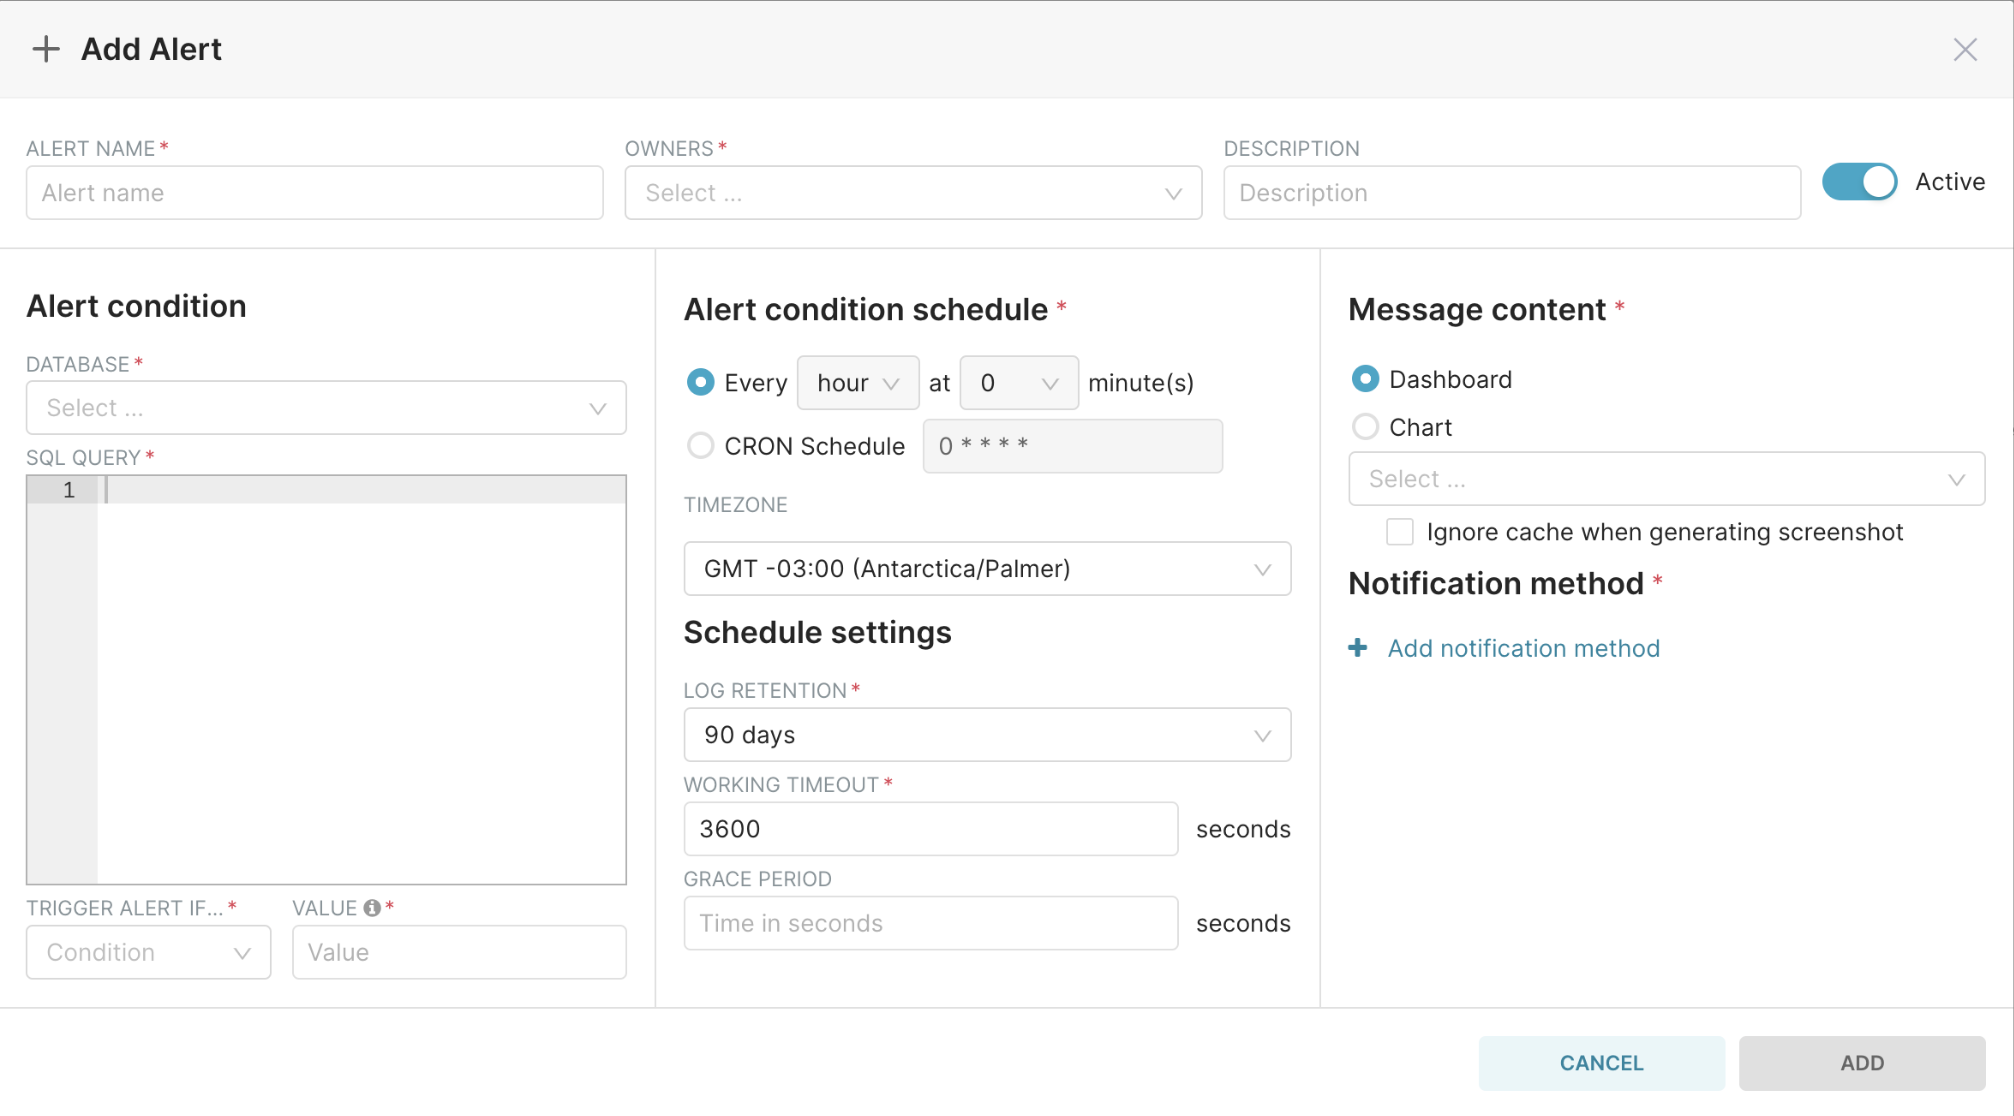
The Add Alert window appears.
Define Basic Alert Details
To start, we need to define some basic details for your new alert. In this walkthrough tutorial, we will create an alert that is triggered when there is a failed user logon attempt within the last 24 hours.
Let's start with the horizontal panel across the top of the Add Alert window.
- In the Alert Name field (required), enter a name for your new alert.
- In the Owners field (required), select one or more owners for the alert. Owners have the ability to edit an alert. They are also notified in case of any execution failures.
- In the Description (optional) field, enter a short but meaningful description of the alert, to be included on the alert message.
The Active toggle switch is automatically enabled. Our alert's Basic Information looks as follows:

Define the Alert Condition
Next, we will move to the Alert Condition panel. This area is used to define the event that triggers the activation and notification of the alert.
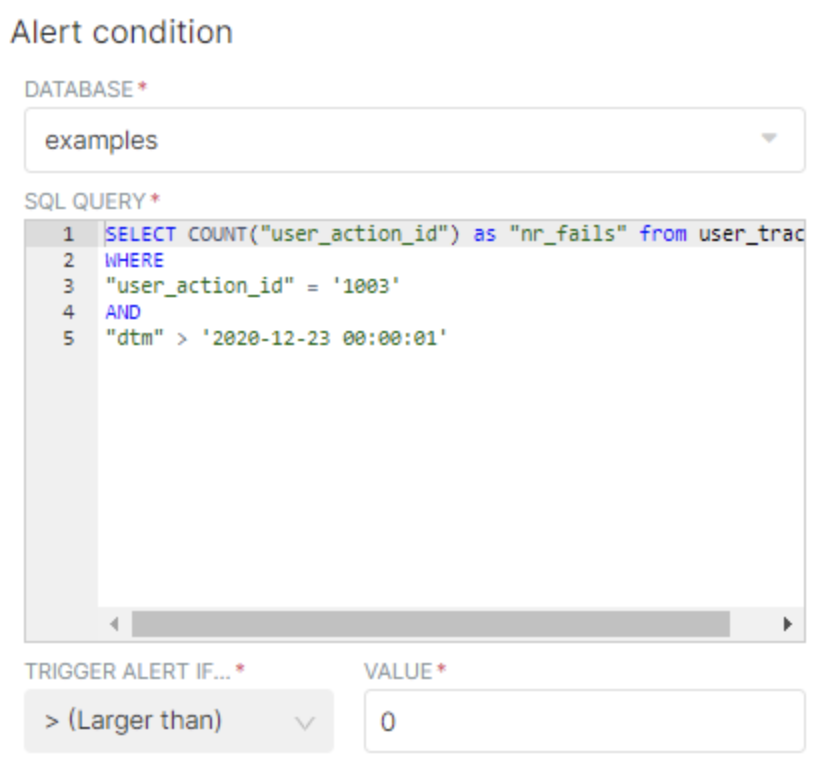
- In the Database field (required), select the database in which the SQL query should be executed.
- In the SQL Query field (required), enter a SQL statement that defines the nature of the alert (the metric you want to monitor). In the graphic below, the SQL statement instructs Preset to count the number of failed logon attempts.
- In the Trigger Alert If... field (required), define the condition and, in the Value field (required), enter the associated value of the condition. In the example shown, the alert is triggered when there is a value that is greater than 0 (i.e., a failed logon attempt happened):
Define the Alert Condition Schedule
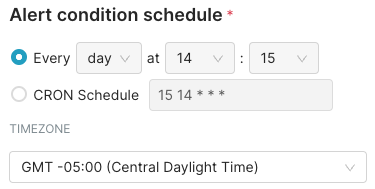
This panel is used to define the frequency at which the data is checked to see if the defined condition has been met.
Specify Time
The first schedule option enables you to specify a highly granular schedule based on your specific requirements. Data can be checked every minute, hour, day, week, month, or year, The day, week, month, and year options all allow you to define a schedule down to the hour & minute granularity.
Check or Enter CRON
After setting a schedule, the subsequent CRON field will automatically populate with an equivalent CRON expression that represents your defined schedule.
Alternatively, you can also directly enter a CRON expression by selecting the secondary radio button and entering the expression in the CRON Schedule field.
Select Timezone
In the Timezone field, select the drop-down menu and choose your timezone.
Define Schedule Settings
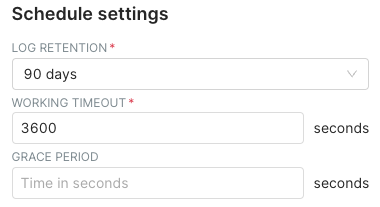
- In the Log Retention field (required), enter the number of days that the alert will be stored in the execution log. By default, this is set to 90 days.
- In the Working Timeout field (required), enter the number of seconds that the alert job is allowed to run before it results in an automatic timeout. By default, this is set to 3600 seconds.
- In the Grace Period field, enter the number of seconds that should pass before the alert can trigger relative to when a previous alert was triggered. If an alert triggers within this period, its status will be On Grace and the alert's evaluation will commence when this period concludes. By default, this is set to 14400 seconds.
Define Message Content
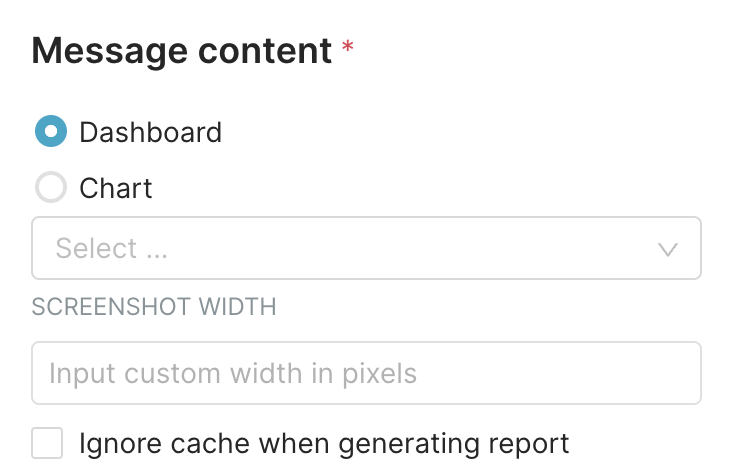
In the Message Content section, select either the Dashboard or Chart radio button. Then, in the drop-down field, select the relevant dashboard or chart — a custom link will be prepared and sent based on the defined notification method (below).
Screenshot Width is an optional parameter which allows you to customize the width (in pixels) for your alert dashboard / chart screenshot. Your custom width can be between 600 and 2400 pixels. The format is the plain number ( ex. 2000 ). Utilizing the custom screenshot width may allow you to show more columns in an wide table chart which would normally be cut off by the typical screenshot width; please note that tables wider than the maximum limit of 2400 pixels will be cut off.
Ignore cache when generating screenshot checkbox to produce real-time data (invalidating cache).
Define Notification Method
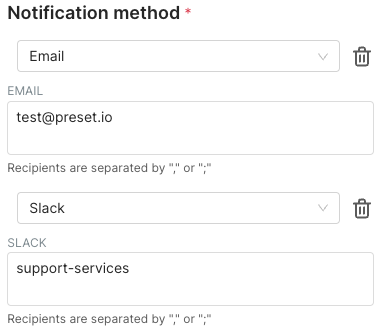
In the Notification Method section, select Add notification method. The Select delivery method drop-down field appears. Select either Email or Slack, as needed. On selection, you will be prompted to enter an e-mail address or the channel name. You can also configure it to be sent to both recipient types:
Good job, your alert is ready to go! To finalize your alert, select Add.