👤 This documentation is intended for Primary Creators and Workspace Admins. Check with your Team Admin for additional access.
Overview
The Alerts & Reports feature in Preset enables users to easily create event-triggered notifications (Alerts) or scheduled notifications (Reports).
Reports provide a snapshot of a dashboard or chart along with a link that enables recipients to browse directly to Preset further explore the visualization or dashboard. Alerts provide a custom link that facilitates viewing and further exploration. Both can be delivered either via e-mail and Slack.
This topic explores this functionality. First, though, let's discuss the definition of an alert and report in Preset.
What is an Alert?
An alert provides a custom link to a chart or an entire dashboard and is triggered when an event occurs. An event is a logical condition in your data, such as when a failed logon attempt occurs.
What is a Report?
A report provides a snapshot of a chart or an entire dashboard as well as a link for further slicing & dicing of the query. A report, however, runs on a defined schedule (e.g., at 4pm every day, every week, etc.).
Navigating to Alerts & Reports
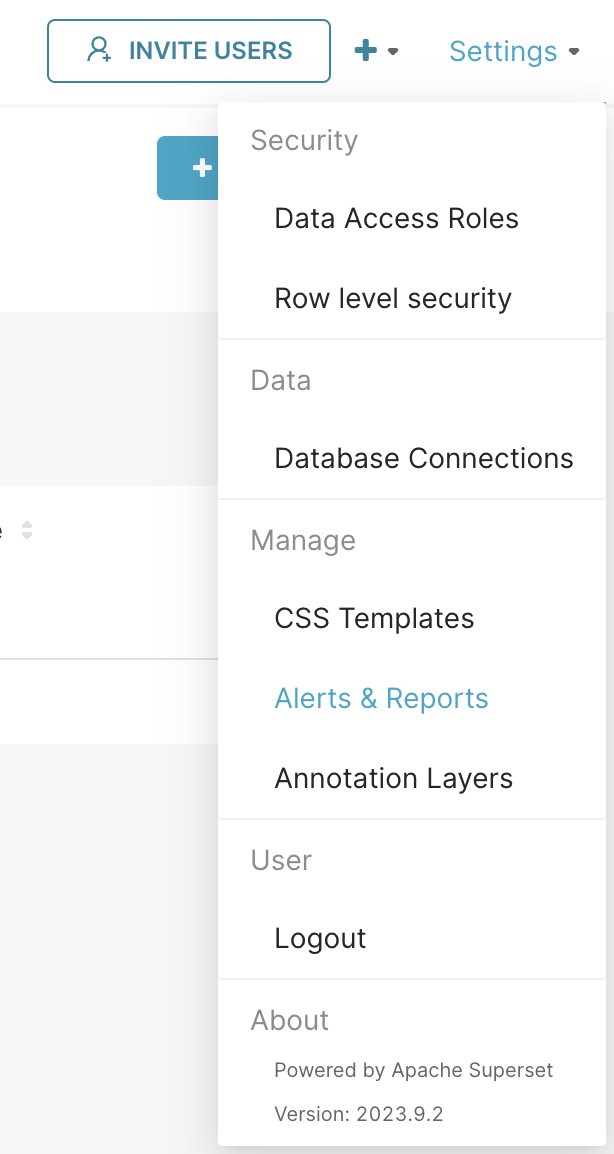
In the Toolbar, hover your cursor over Settings and then, in the drop-down menu, select Alerts & Reports.
Interface
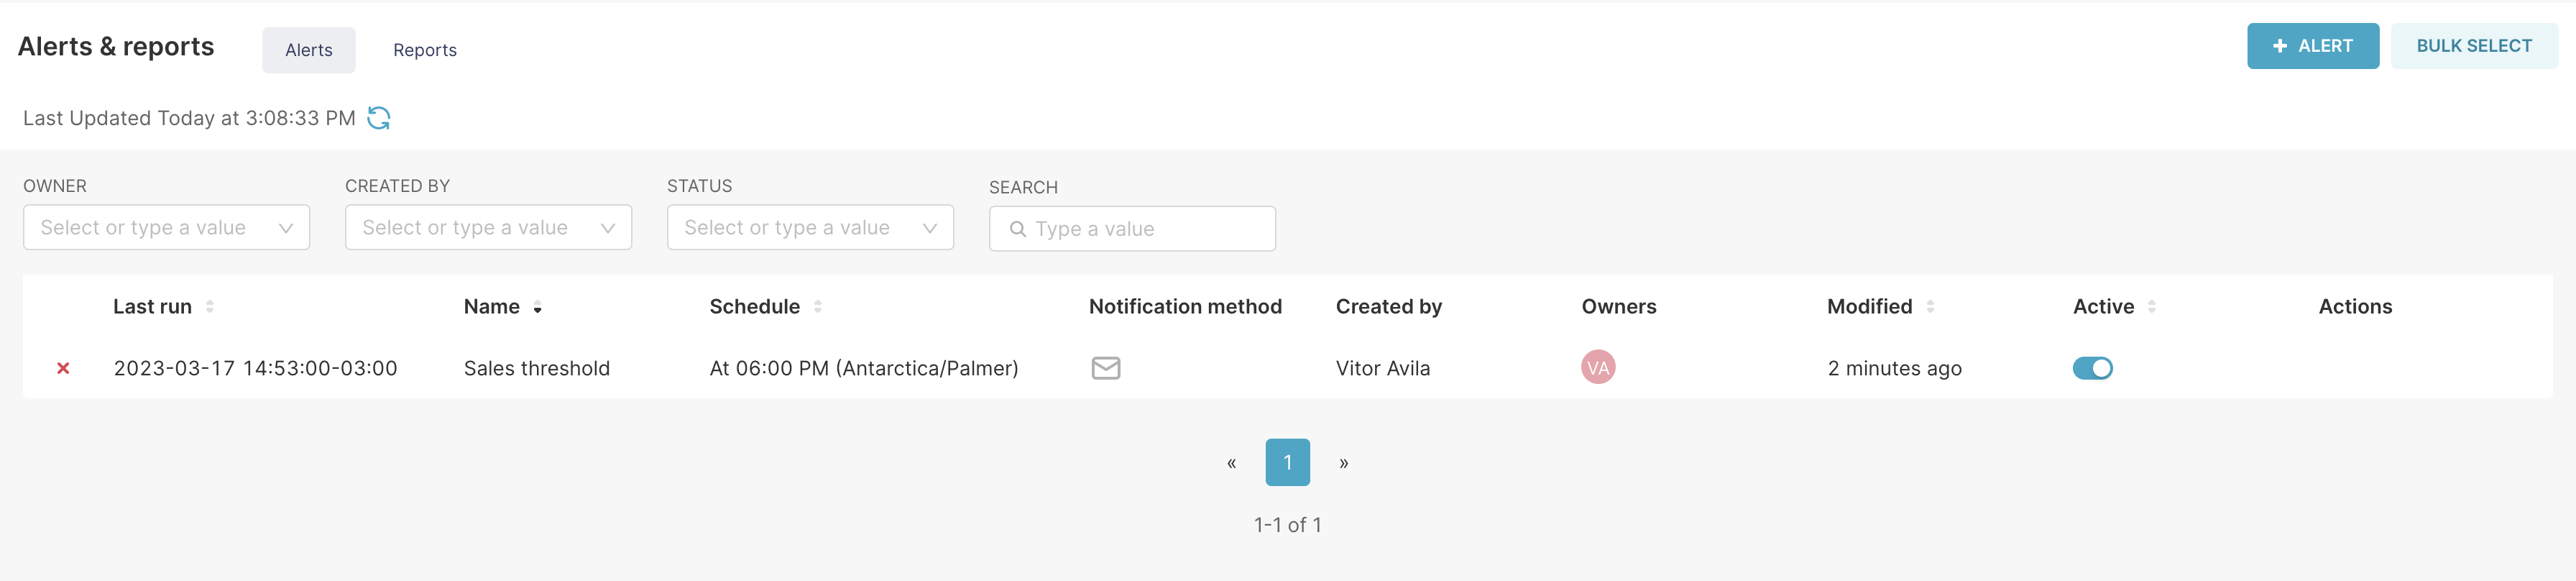
Alerts Screen
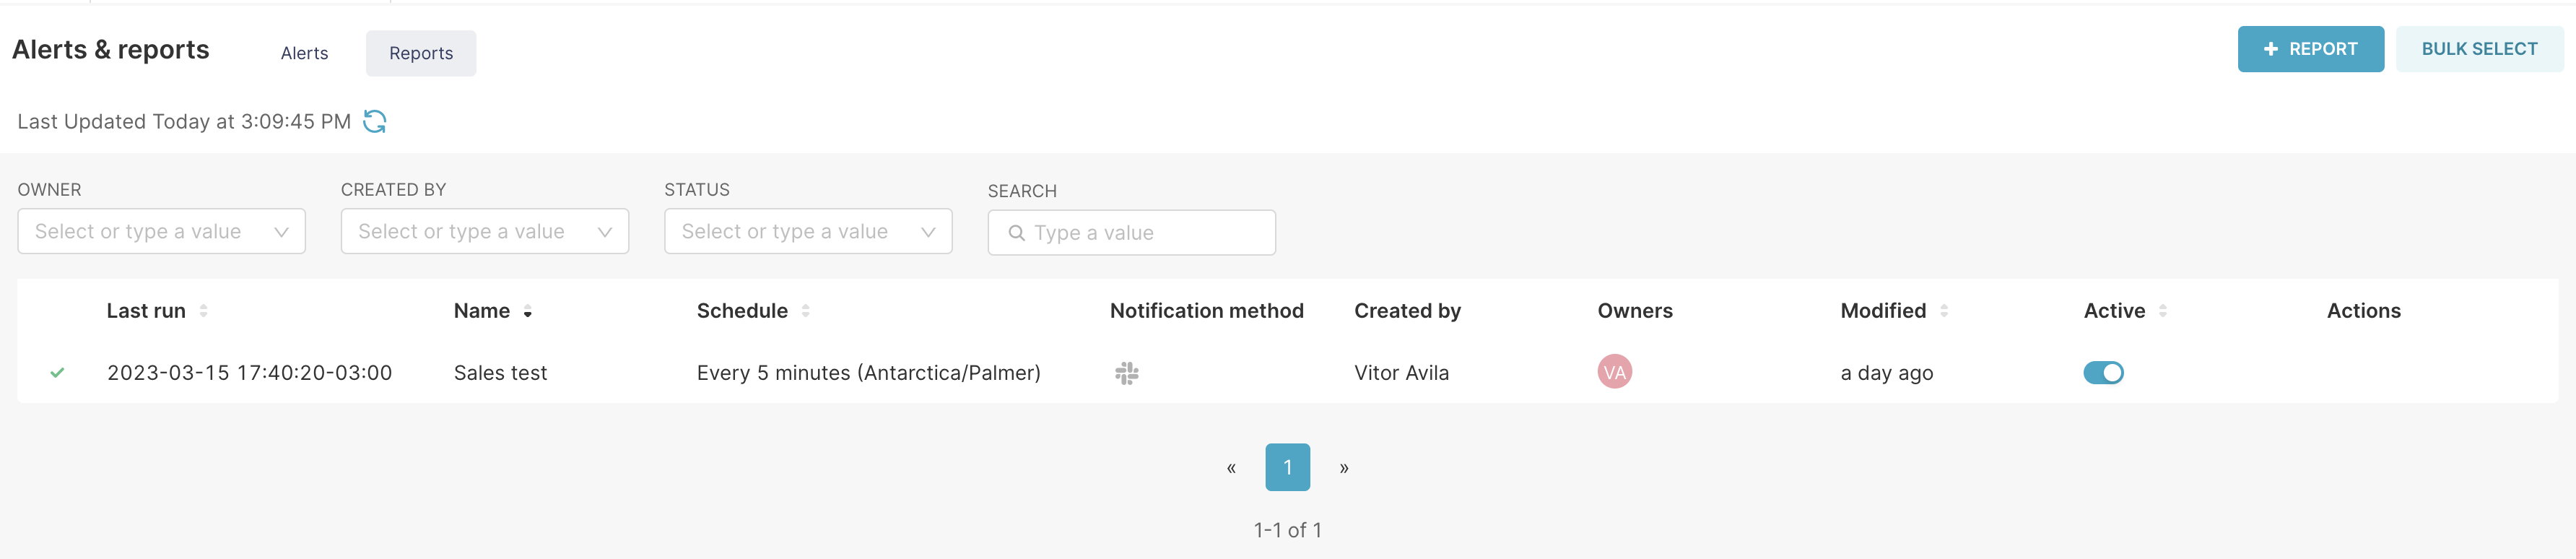
Reports Screen
Alerts and Reports Navigation
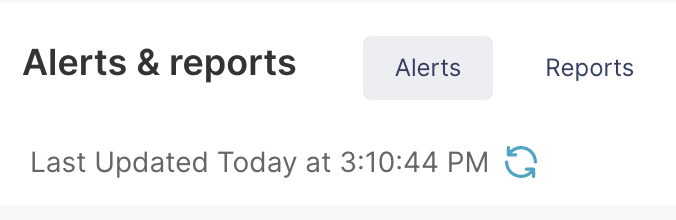
When you browse to the Alerts & Reports screen, the Alerts interface appears by default. You can easily control what content you'd like to view by selecting the Alerts or Reports tab at the top of the screen.
Below the Alerts and Reports tabs is Last Updated information — this simply conveys when the screen was last updated with data. You can force refresh the page by selecting the circular Refresh icon.
Filters and Search
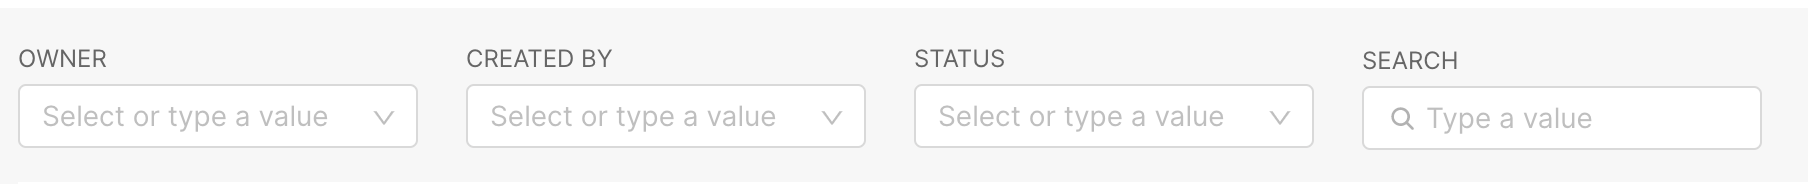
The filters and search features enable you to quickly find the alert or report that you're looking for, which is inavaluable when there are many entries.
Available filters include the following:
- Created By: Select a user to display alerts or reports created by that person.
- Status: Select an option to display alerts or reports that match the selected status. Available status options include:
- Any (default): Displays all entries regardless of status.
- Success: Displays entries that ran successfully.
- Working: Displays entries that are currently being processed.
- Error: Displays entries that did not successfully run.
- Not Triggered: Displays entries with a trigger that has not yet been activated.
- On Grace: Displays entries that are currently in a defined grace period.
To use the Search feature, simply enter a term in the text-entry field and hit
Table Column Headers
The Alerts and Reports tables include the following column headers:
- Last Run: The date, time, and UTC hour difference when the entry last ran.
- Name: The name of the alert or report, as defined when adding or editing the entry.
- Schedule: The defined schedule of the alert or report (e.g., every hour, every minute, etc.).
- Notification Method: One or more icons that indicate whether notifications will be sent by e-mail and/or via Slack.
- Owners: Icons that indicate the owner(s) of the alert or report.
- Active: Toggle switch that indicates whether the alert or report is currently enabled or not.
- Actions (visible on cursor hover): Icons that enable you to access the execution log, edit the entry, or delete the entry (please see descriptions of each below).
Next Steps
- Refer to the Creating an Alert and Creating a Report documentation to understand the creation process.
- Check the Managing Alerts & Reports article to check how to maintain them at scale.
- Got an error? Check our Troubleshooting section.