Datasets: The Foundation of Visualizations
If your Admin has already connected your organization's database, then you are almost ready to start creating stunning data-driven charts and dashboards.
There is, however, one key step remaining: adding a physical dataset or a virtual dataset.
Datasets are curated representation of data in your database, allowing charts you want to create to have unified metric definitions. They are a critical component, as every chart is created from a dataset. Datasets offer a high level of flexibility in modeling data you've collected, enabling your organization to take then determine how information is presented to specific audiences in a chart or dashboard.
In this article, we will look at how Preset works with your data and answer some common questions about datasets.
We encourage you to read Physical Datasets and Virtual Datasets to learn more about how to add these two dataset types.
Key Points: Preset and your Data
- Preset doesn't extract data from your database.
- All storage and computation occurs on your existing backend.
- A Preset dataset is a curated representation of data already in your database.
- Every chart is based on a dataset.
What is a dataset?
A dataset is a Preset abstraction that points to data in your database. This data is used to create charts in Preset.
Dataset Questions & Answers
Why datasets? Why not a pure query-centric approach?
Datasets offer an agreed source of truth for metric definitions — all charts that are built from a single dataset utilize the same set of comprehensive collection of relevant dimensions and metrics.
Datasets further enables users to self-serve within this safe "dimensional" playground. Your team members can typically slice and dice, apply arbitrary filters, and drill into dimensional details — all without altering pre-determined definitions of certain metrics.
This is superior to a pure query-centric approach (i.e., one-query-one-chart), where “pivoting” and slice-and-dicing requires going back to the query, understanding semantics of certain columns or metrics, and updating a query to fit your next question. Oftentimes a query-centric approach create multiple interpretations of the same metric.
Do I need to add a dataset?
In short, yes. Adding a dataset enables you to create new charts and, consequently, dashboards.
What are the benefits of datasets?
Datasets can be customized to align with your unique audience, such as defining availability of field data, specifying date formats, and changing labels.
How do I add a dataset?
Please see Physical Datasets or Virtual Datasets to learn about the process for each dataset type.
Can datasets be further customized?
Yes. Preset's semantic layer enables you to modify a dataset's metrics, columns, and create calculated columns.
How do I use a dataset?
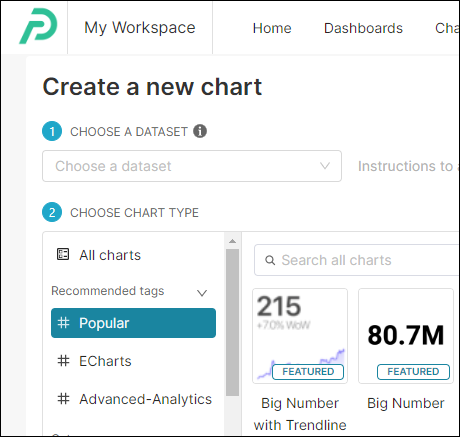
The primary purpose of a dataset is to enable you to create a chart. You can create a chart in one of two ways:
- Use the Chart Gallery screen to select a dataset and a chart type, and then configure a chart; or,
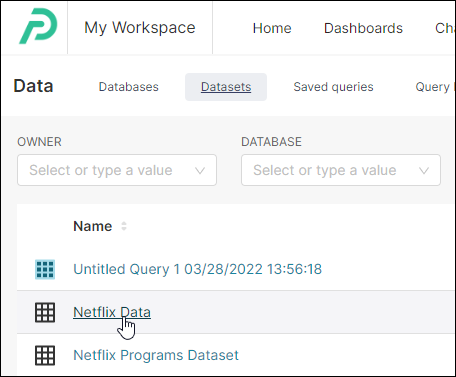
- Select a dataset from the Datasets screen and use the Explore interface to configure a chart.
Please see Chart Examples to see some of the more popular chart types available in Preset.